Visualize Math Tables!
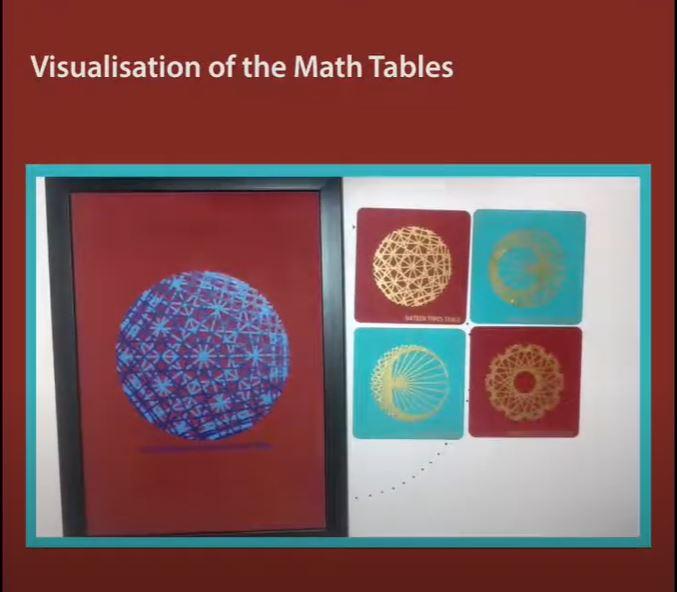
This activity is a fun, and unique way to artistically represent mathematic tables. We will be making some very cool artwork that you can customize in many ways, including those shown above. In this tutorial, we will demonstrate how to represent the 2 times table. The technique can be expanded to cover other tables as well.
And as always, for a video tutorial, you can click on the link below. Let's get started!
Collect Your Materials!
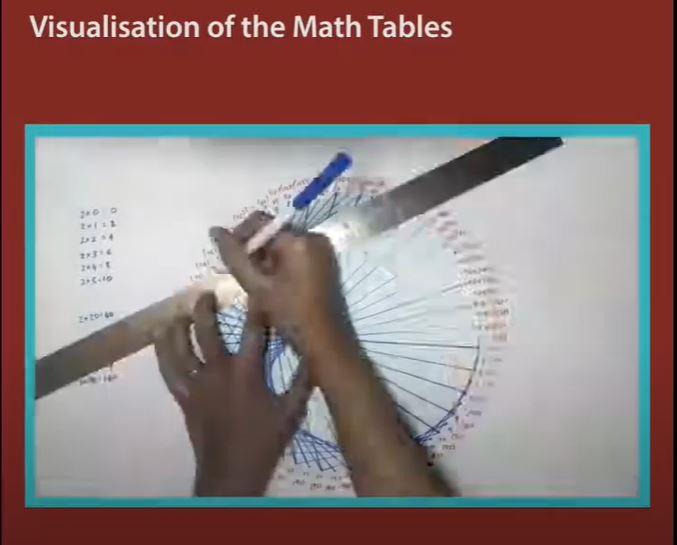
For this activity, all you need is some paper, a ruler, and a pen/pencil/colour pen. Since you can customize the design of your visualization, feel free to keep other stationery to help you do that! Once you have your materials with you, lets get started.
Mark Your Points
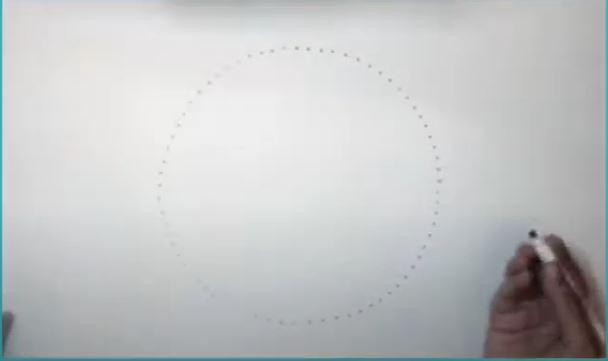
The first step here is to draw a circle as wide as you would like, and mark 72 equidistant points on it, as shown above. You can choose to make fewer or more points, but we chose 72, as it was easy to make using the protractor.
Number the Points
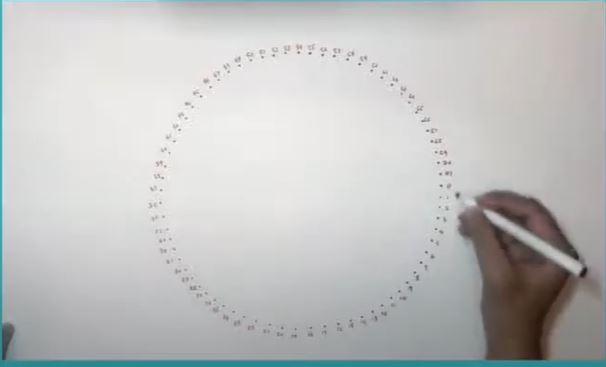
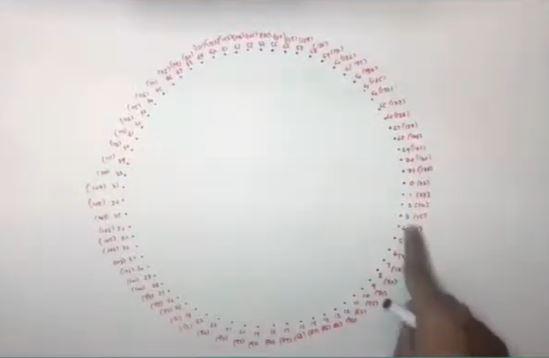
Starting from the horizontal on the right, number all the points in a clockwise direction starting from 0, so the last number will be 71. You can add numbers beyond 71 by going around the circle again, this time, 0 can be 72, 1 can be 73, and so on. You can see the images above or the video tutorial to see how to do this.
Start Joining the Points!
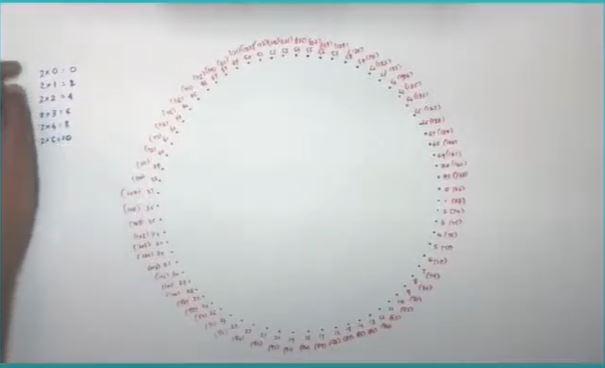
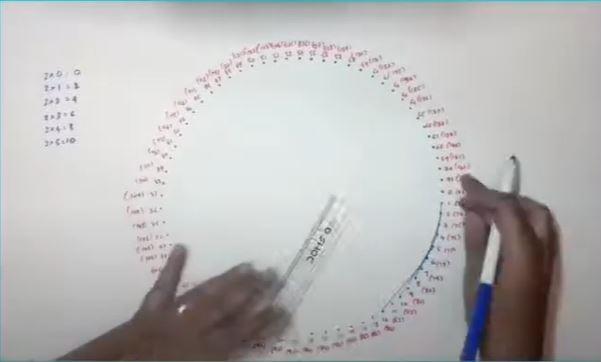
Start by writing the 2 times table for clarity on the side. So say we have the following:
2x1 = 2
2x2 = 4
2x3 = 6
2x4 = 8
2x5 = 10
In the table above, consider only the number 2 is multiplied by, and the product, and connect these two points.
So in the case above, you would connect 1 and 2, 2 and 4, 3 and 6, 4 and 8, 5 and 10 and so on, as you can see above.
Keep Connecting and Joining!
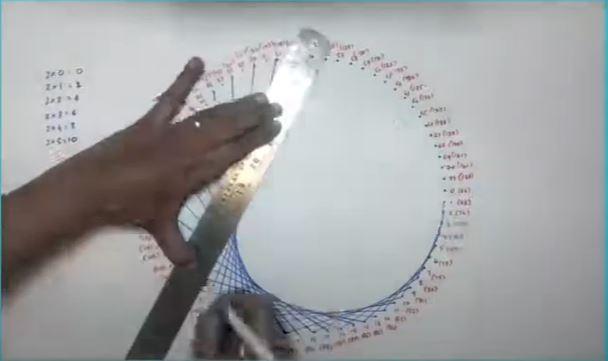
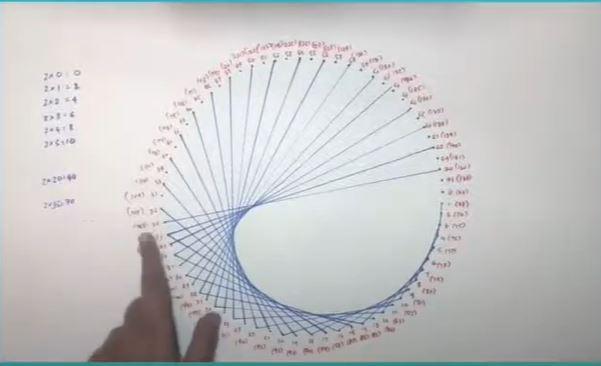
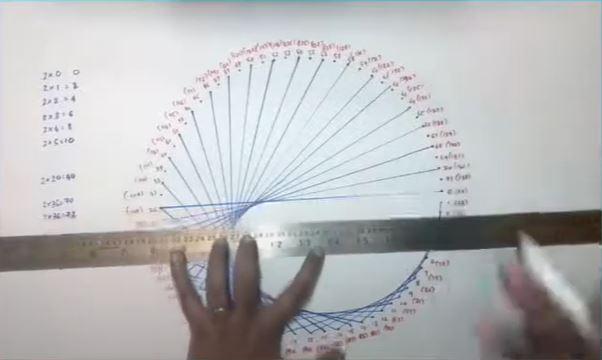
Repeat the previous step till you go around the circle once. Now, connect using the second set of points as shown until you finish connecting the last set of numbers you have written.
And You Are Done With the Basic Structure!
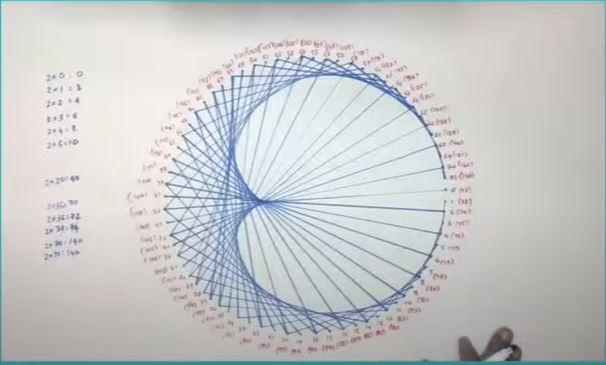
Once you finish joining all the points, your visualization should look something like the image above. And that's it! You are done with the basic structure!
Customize and Innovate!
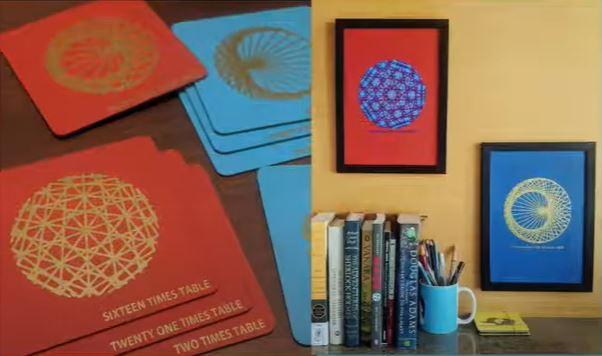
You can feel free to design it further, and add elements to turn it into a nice painting, or paint coasters, or come up with your own creative applications. Do try this out and let us know what you did with it!
You can also try this out with other tables, in a similar manner!