Touch Board + Grapher
by Bare Conductive in Circuits > Electronics
1303 Views, 5 Favorites, 0 Comments
Touch Board + Grapher
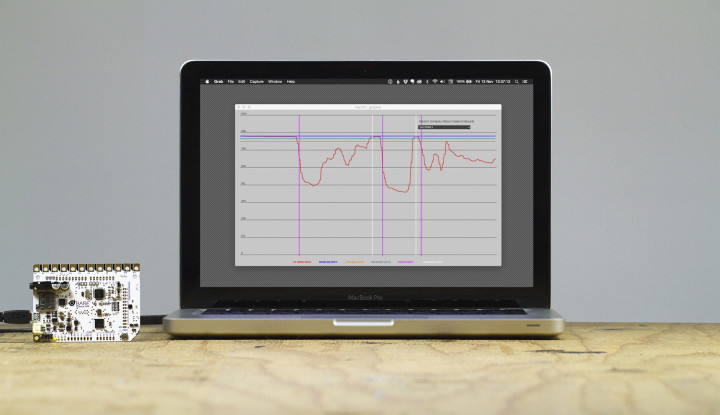
Use the grapher to visualise the sensitivity and precision of the Touch Board’s sensors.
How sensitive are your sensors? Use the grapher to visualise the sensitivity and precision of the Touch Board’s sensors. Perfect for prototyping a new sensor design, testing a new material or calibrating your project.
For more project ideas visit www.bareconductive.com
Materials
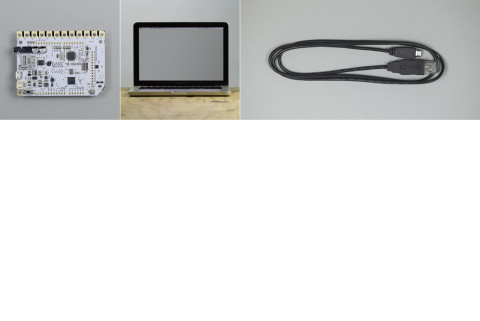
To begin you will need:
1 x Touch Board
—
1 x USB A to Micro B cable
1 x Computer running Processing with the latest ControlP5 library installed
—
1 x Internet connection (but you are reading this, so I guess you must have one!)
Upload Datastream to Your Touch Board
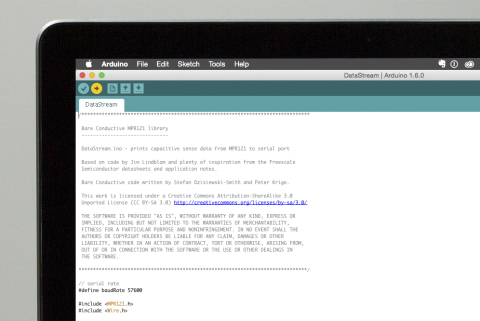
Your Touch Board will need our DataStream code to communicate with the Max patch. The DataStream code is an example within our MPR121 Library. Find it by navigating to File/ Examples/ MPR121/ Examples/ DataStream. Make sure to select the correct Board and Port before hitting upload.
If you haven’t set up your Touch Board with Arduino then make sure to complete our “Setting up Arduino with your Touch Board” tutorial first.
Check Datastream
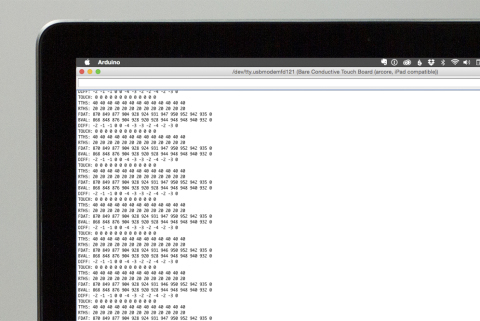
Check that you’ve uploaded Datastream correctly by opening up the Serial Monitor (Tools/Serial Monitor) in Arduino. You should see a stream of values.
Uncheck autoscroll to pause the values and you’ll note that there are repeating lines of values which start with TOUCH, TTHS, RTHS, FDAT, and BVAL. Don’t worry about them for now, this is the raw data that Processing is going to parse.
Download the Grapher
To download our grapher, click the link below and unzip it to a convenient location. Our patch runs on Processing and requires the ControlP5 library. If you don’t already have Processing installed you can find a link below. Once you have installed and opened Processing navigate to Sketch/Import Library/Add Library… from the top menu. Search for “ControlP5” and select “Install.” Close the dialogue box once the library has installed.
Start It Up
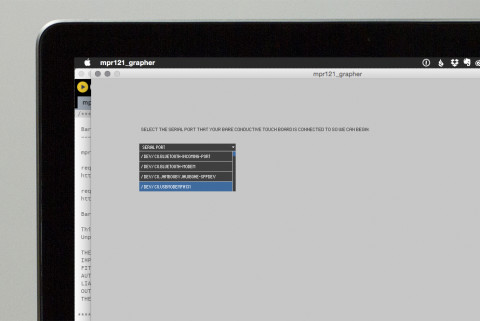
Plug in your Touch Board and open up the grapher sketch. Click run and select your Touch Board from the dropdown menu that appears in the window. You’ll probably have a number of choices. Generally the Touch Board is the last or near the end of the list named something like “/DEV/CU.USBMODEM…”
You’ll know you’ve selected the right serial port when you see a scrolling display of data. Touch electrode 0 and you should see a reaction. If not, try closing the window, running again and selecting a different port.
All the Data You Need.
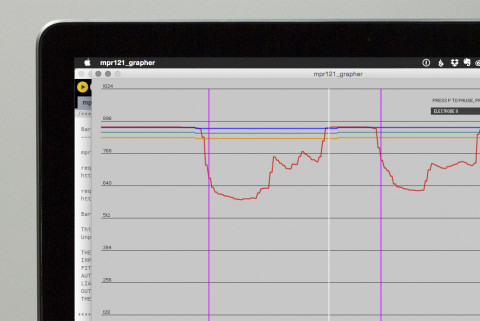
Once you have the grapher running you will notice that there a few different lines on your scrolling display. The red line is the filtered data. It should move when you touch (or even approach!) the electrode. The blue line is the baseline. Clip something to the electrode, restart the grapher and notice that it changes. The yellow and green lines are the touch and release thresholds as set in the DataStream code you uploaded earlier. The vertical purple line indicates a touch event and the vertical white line indicates a release event.
If you liked this tutorial visit www.bareconductive.com for more!