TFT Touch Display - Aligning Touch Points to Display Pixels
by hausofpayne17 in Circuits > Arduino
2638 Views, 0 Favorites, 0 Comments
TFT Touch Display - Aligning Touch Points to Display Pixels

You may have previously seen my BlueBerri6 Arduino project that uses a 320x240 TFT Touch Display shield.
It works okay but I found a couple of challenges to overcome.
If the Arduino is plugged into my computer's USB port, all works fine. But if it's plugged into a 9V battery, the touch points no longer match up to the display pixels. There is a variation in points detection based on input voltage.
This doesn't necessarily apply to ALL TFT Touchscreen Shields, but it happens for mine.
Additionally, there is no getting around the fact that the touch pad has a different origin and resolution than the display. It would be great if we could easily and accurately map touch points to display pixels.
This instructable shows you how to accurately and consistently map the touch points to the display pixels so you can just use the display pixels for all references in your project.
Let's get started!
Supplies
Arduino Uno or Mega
TFT 240x320 Touch Display Shield
Appropriate MCUfriend_kbv, Adafruit_GFX and Touchscreen libraries as for your shield
Orientation Differences Between Display and Touch

In portrait mode, the display has it's origin in the top left corner and starts at (0,0). The touch pad's origin is in the lower left corner and starts at numbers other than (0,0). This means that the resolution of the touchpad is much higher than the display's resolution.
In this tutorial, my display is in LANDSCAPE mode.
The Alignment Sketch


You could try using the map() method in Arduino to map your touch points to display coordinates.
for example: int displayX = map(p.y,890,500,0,320);
int displayY = mpa(p.x,540,280,0,240);
where the touch x and y ranges are based on what you see when you click the corners of the display and read off the sketch screen display. (Yes, in landscape mode, p.y maps to the x display coordinate and p.x maps to the y display coordinate)
For 5V USB power, the results are not bad. But for the 9V battery power, it doesn't really work well as you move across the screen.
To get better results, we can use Quadratic Regression Analysis to get mapping functions for x-touch values to x-display values and y-touch values to y-display values.
The supplied sketch has 9 touch points that you can press to determine the touch coordinates for the corresponding display points. Look at the arrays at the top of the sketch and you'll see the display (x,y) coordinates for the black and white dots.
By clicking on each dot, you can record the touch coordinates that you will then map to the display coordinates.
You'll see from the second image that for the 9 Volt supply, the red DISPLAY dots really drift from the black/white TOUCH dots as we move from left to right.
The last image is the result of deriving equations to map the touch points to the display pixels. The results are very good.
So load this sketch into your Arduino and click on each white dot and record the Touch coordinates for the corresponding display coordinates for the black/white dots.
ex. Display: 20,20 160,20 300, 20
Touch: 513,219 429,220, 215,218 etc
In the next step, we'll use the Desmos.com graphing calculator app to do regression analysis to get these functions (ie. mapping equations).
Downloads
Regression Analysis With Desmos
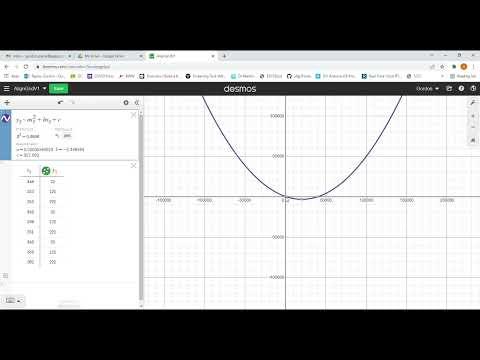


Regression Analysis is a mathematical process that attempts to derive a function from a set of (x,y) points.
There are various types of regression analysis available in Desmos, namely:
Linear y = mx+b
Exponential y = ab^x+c
Logarithmic y = alogx .....
Quadratic y = ax^2 + bx + c
In my testing, I found that Quadratic regression gave the best results. We'll do one regression analysis for the x-coordinates and a separate regression analysis for the y-coordinates. You'll have two equations you can use to convert touch points to screen coordinates very accurately.
Please watch the attached video to see how to analyze the sampled points to get the coefficients for mapping touch-x values to display-x values and touch-y values to display-y values.
Screen shots of a similar regression analysis process are attached as well.
Include Coefficients in Your Sketch


Insert the a,b and c values from your regression analysis into the sketch.
Look at the map2d() method.. It accepts touch point x and y coordinates and maps them to display (x,y) cooridnates.
Compile and upload the sketch to your Arduino and try it.
You should now see a better coordination between the point touched on the screen and the display response.
The big advantages of this method are that your touch coordinates map to your display coordinates and now you just use the display coordinates for your sketch instead of having to incorporate touch and display coordinates into your sketch touch detection logic..
Good luck in your future touch screen projects!