TAM 335 Lab 5: Calibration of Flowmeters
by emilyr18014 in Workshop > Science
408 Views, 0 Favorites, 0 Comments
TAM 335 Lab 5: Calibration of Flowmeters
There are two types of flowmeters used in this procedure: a hydraulic flowmeter, which is either a Venturi or orifice-plate flowmeter, and a paddlewheel flowmeter.
Procedure
1) Make sure the discharge valve is closed and that the mercury levels in the mercury-water manometer are equal. Adjust the drain valves if the levels are not equal.
2) Calibrate the manometer differential pressure transducer. This is used in measuring the pressure difference for the hydraulic flowmeter.
1. Zero the transducer output
2. Make sure the discharge valve is closed. Then open the manometer bleed valve.
3. Take readings of the transducer output and manometer levels, making sure the maximum output voltage does no exceed 10V.
4. Use the LabVIEW software to do a linear least-squares analysis on the data collected.
5. Close the manometer bleed valve.
3) Collect data using both flowmeter systems.
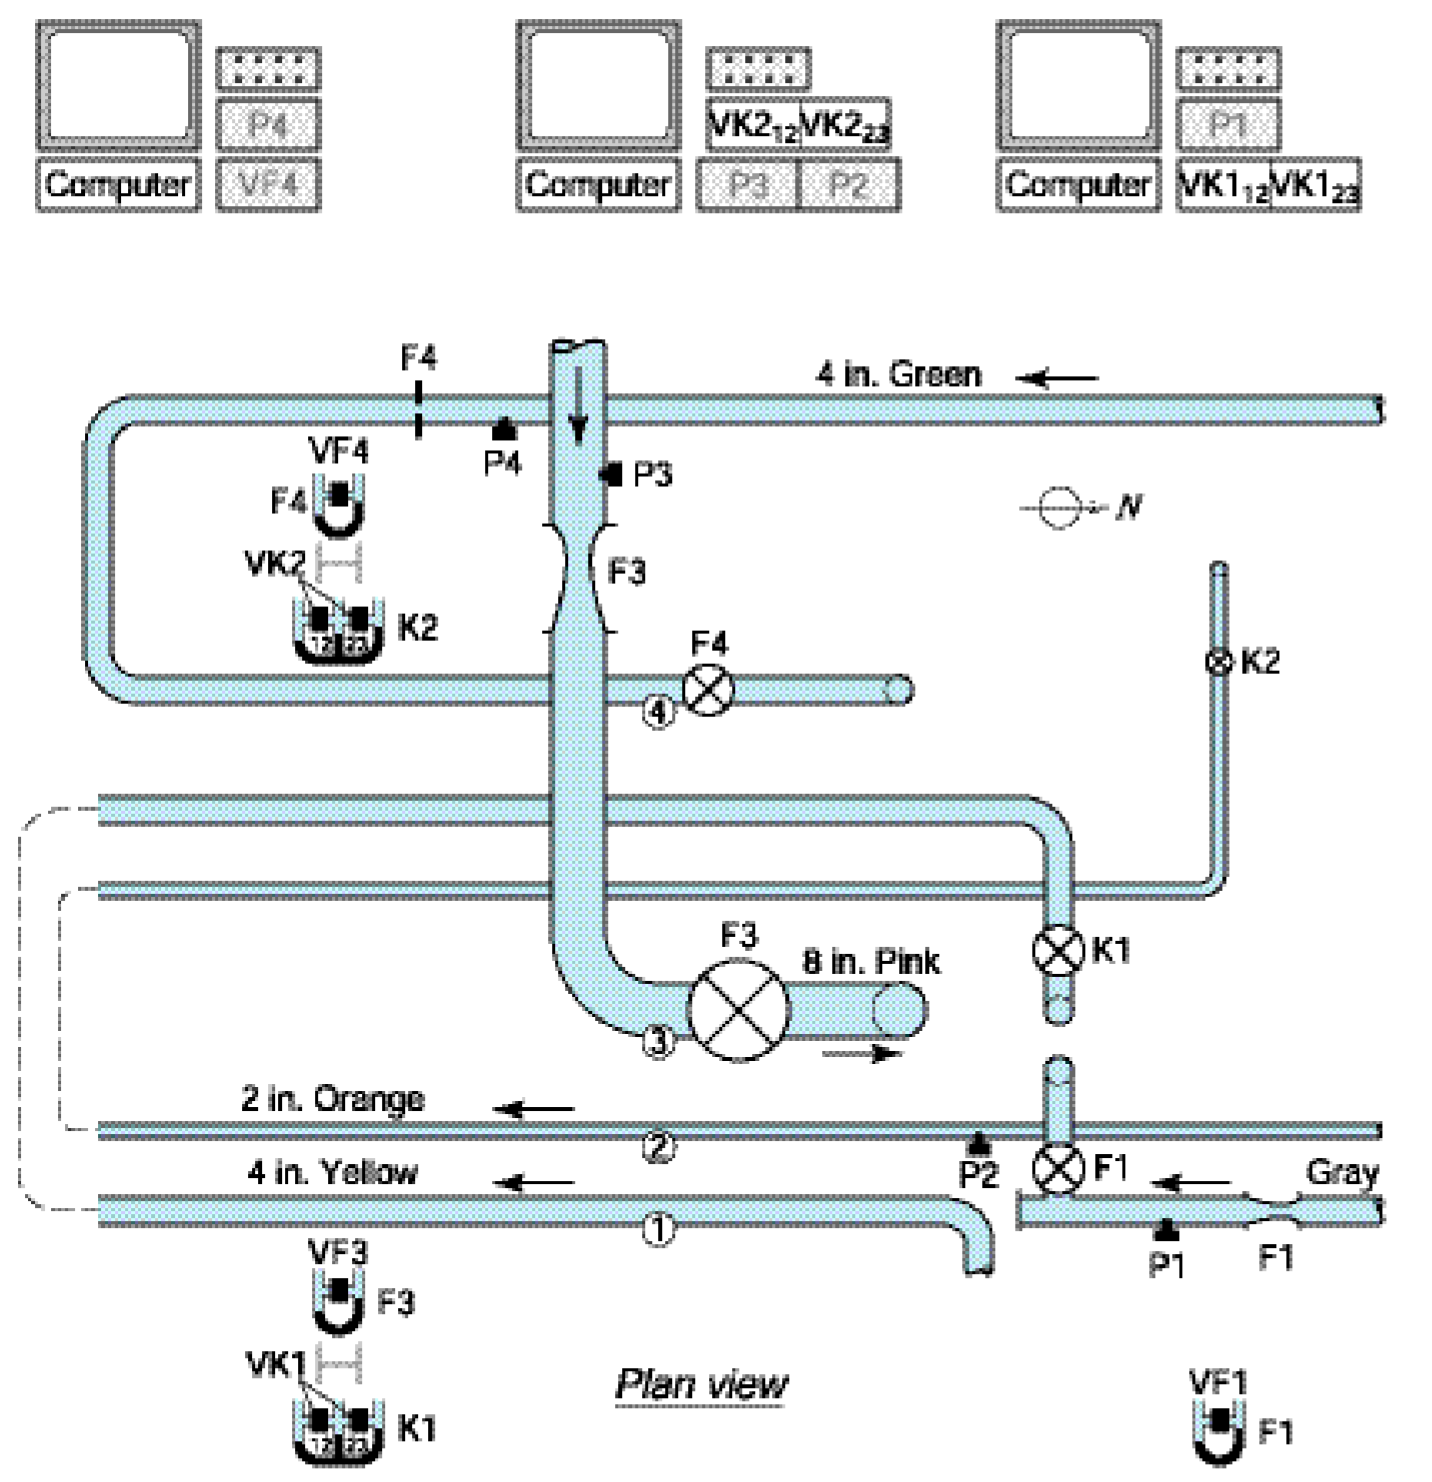
1. Make sure the controls at P1 and P4 in the figure are set to 6.25 turns and P3 is set to 3 turns.
2. Zero the paddlewheel flowmeter output.
3. Slowly open the discharge valve.
4. Take voltage readings when the paddlewheel flowmeter first has a nonzero value.
5. Record the voltage readings of the flowmeter when the system is at the maximum flow rate, and use LabVIEW to record the data.
6. Repeat the process using slower flow rates, which should be approximately 90% to 80% to eventually 10% of the original maximum flow rate.
7. After collecting the 10 data sets, you should be able to view the flow coefficient related to Reynolds number as well as the paddlewheel flowmeter's readings in relationship to the flow rate calculated by the weight-time method using LabVIEW.
Flow Rate Vs. Manometer Deflection Data Results
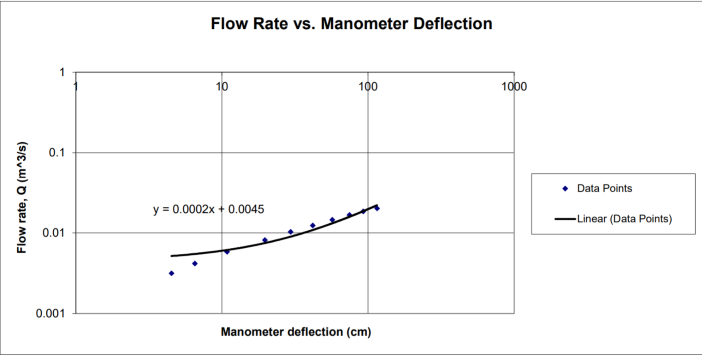
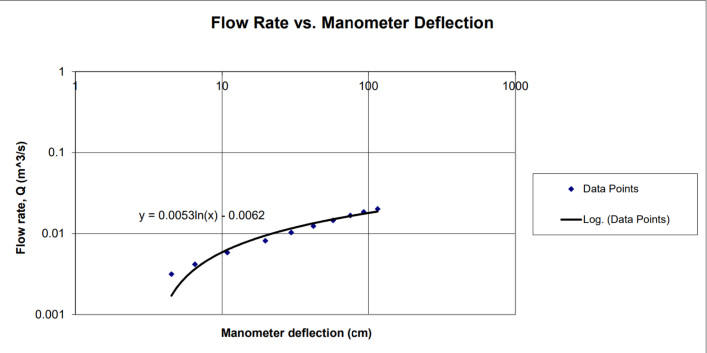
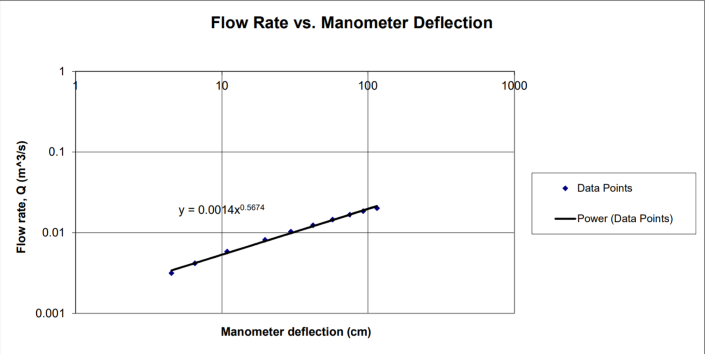
Figure 1 shows what the resulting plot should be when the flow rate is plotted against the manometer deflection for the hydraulic flowmeter, using linear scales.
Figure 2 shows the same data plotted using logarithmic scales.
Since the data basically creates a straight line, it can be inferred that the power-law relation can be used. This can be seen in Figure 3.
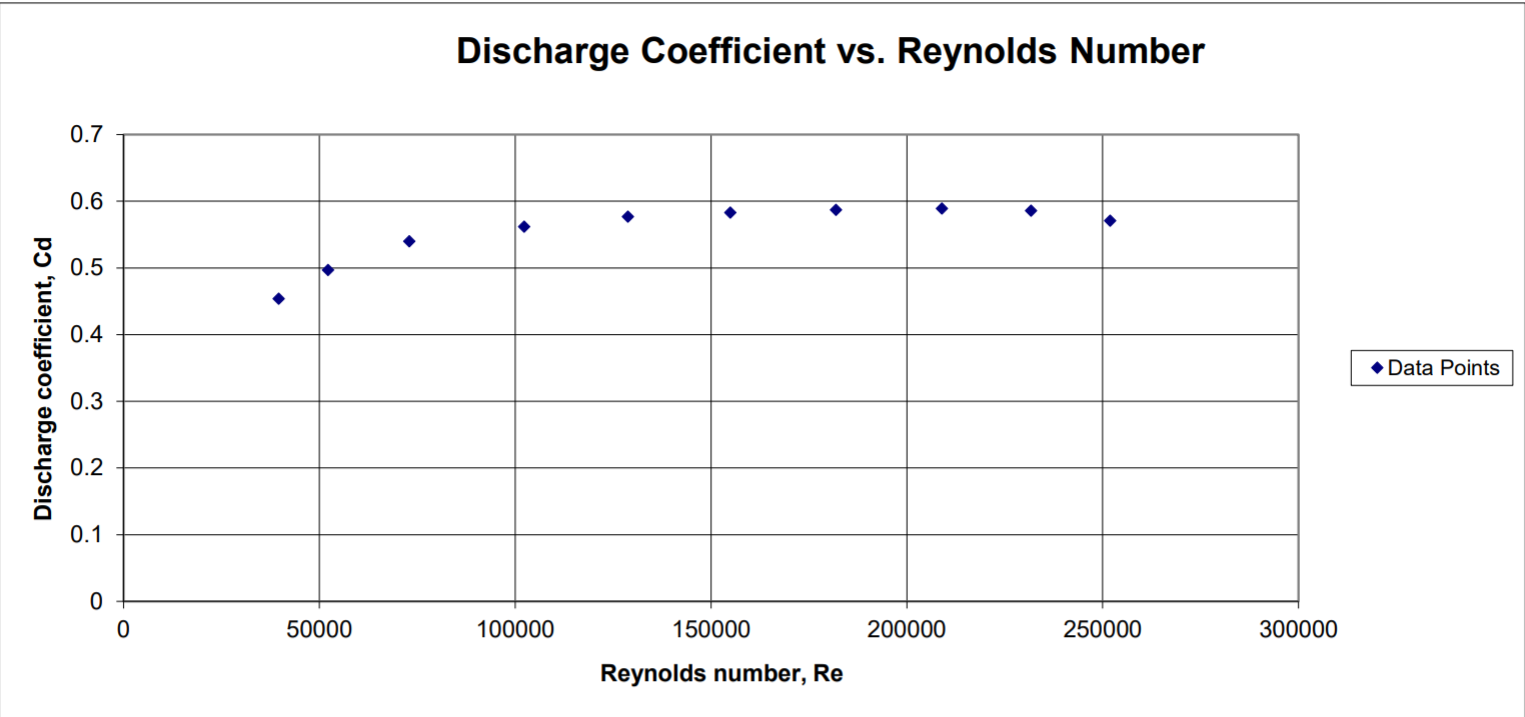
Discharge Coefficient Vs. Reynolds Number Data Results
Paddlewheel Flowmeter Data Results
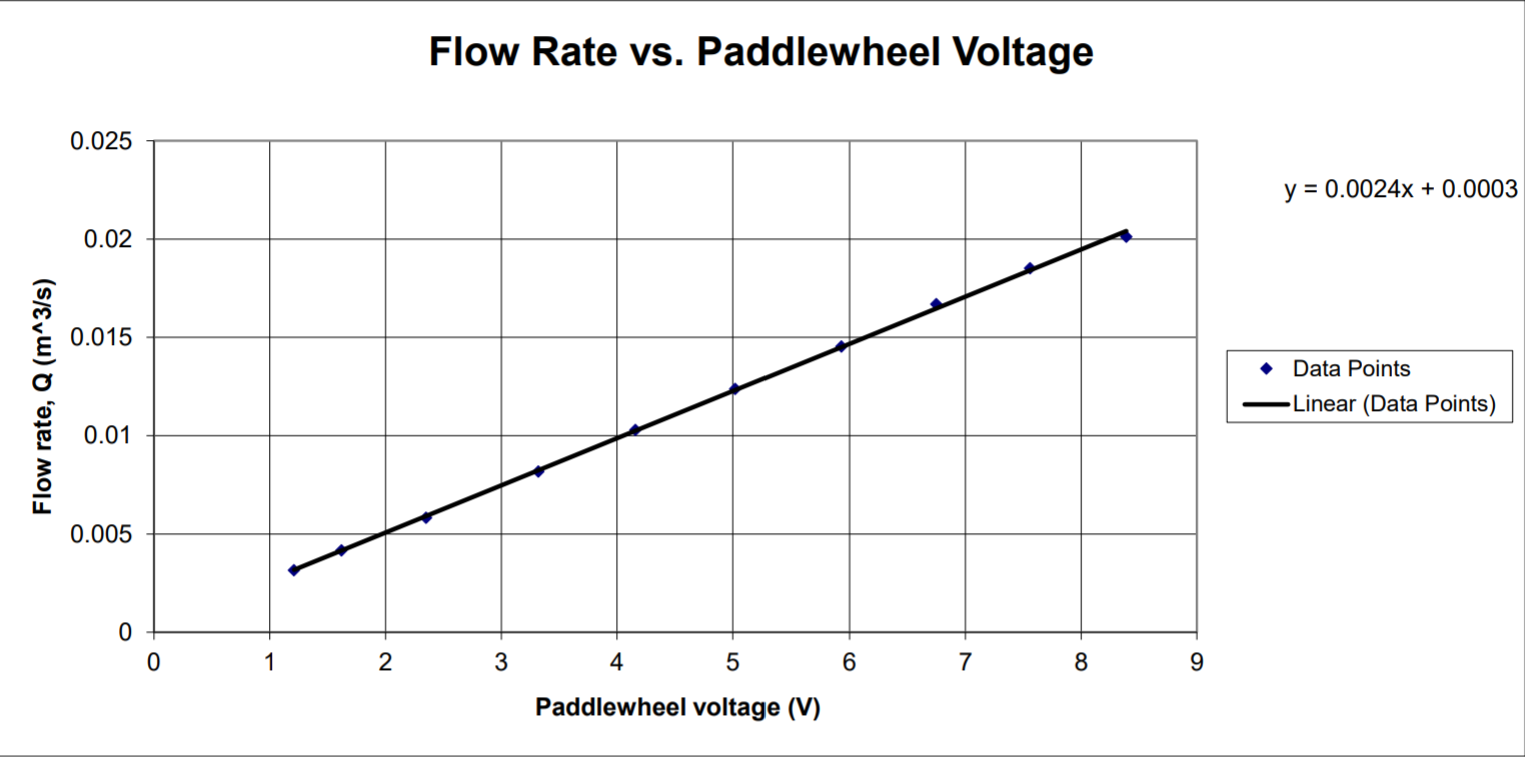
The paddlewheel flowmeter voltage results are found to be proportional to the flow rate, which can be seen in the figure. Therefore, the voltage is also proportional to the velocity in the pipe, since Q=vA and the area is not changing throughout the pipe.
Data Questions
#2. The discharge coefficient is essentially constant over the range of Reynolds numbers tested. The values for the discharge coefficient that were measured are not really close to the ideal value of unity derived theoretically, which is equivalent to 1.
#5. The paddlewheel flowmeter seems to be relatively reliable, although not as reliable as the weight-time method. The readings of the paddlewheel flowmeter would be more accurate at high flow rates because is requires a significant flow to get the paddlewheel flowmeter to begin moving steadily.