Spectrometer #phablabs


Spectrometry allows us to see what colours of light are present in our source. Create a simple spectrometer from 3D-printed material, a diffraction grating and some cellotape with an option to make it even more advanced with a Raspberry Pi
Properties of this workshop:
Timeplanning Basic spectrometer: Total: 1h25
1. Understanding the concepts of 'Diffraction, Interference & diffraction grating experiment': 20 minutes
2. Construction of the 3D printed spectrometer with diffraction grating: 15 minutes
3. Imaging of different light sources and calibration using imagej: 50 minutes
Timeplanning Advanced spectrometer: Total: 2h20
1. Understanding the concepts of 'Diffraction, Interference & diffraction grating experiment': 20 minutes
2. Construction of the 3D printed spectrometer with diffraction grating: 30 minutes
3. SD card mount and Raspberry Pi software & setup: 45 minutes
4. Python and Imaging of different light sources: 45 minutes
Target audience: Students (15-18 years old) & Young professionals (+18y)
DISCLAIMER: By using this information you agree to be legally bound by these terms, which shall take effect immediately on your first use of the information. PHABLABS 4.0 consortium and its member organizations give no warranty that the provided information is accurate, up-to-date or complete. You are responsible for independently verifying the information. VUB cannot be held liable for any loss or damage that may arise directly or indirectly from the use of or reliance on the information and/or products provided. PHABLABS 4.0 consortium and its member organizations disclaim all responsibility to the maximum extent possible under applicable laws: All express or implied warranties in relation to the information and your use of it are excluded. All liability, including for negligence, to you arising directly or indirectly in connection with the information or from your use of it is excluded. This instruction is published under the Creative Commons licence CC-BY-NC.
Understanding the Concepts of 'diffraction, Interference & Diffraction Grating Experiment'

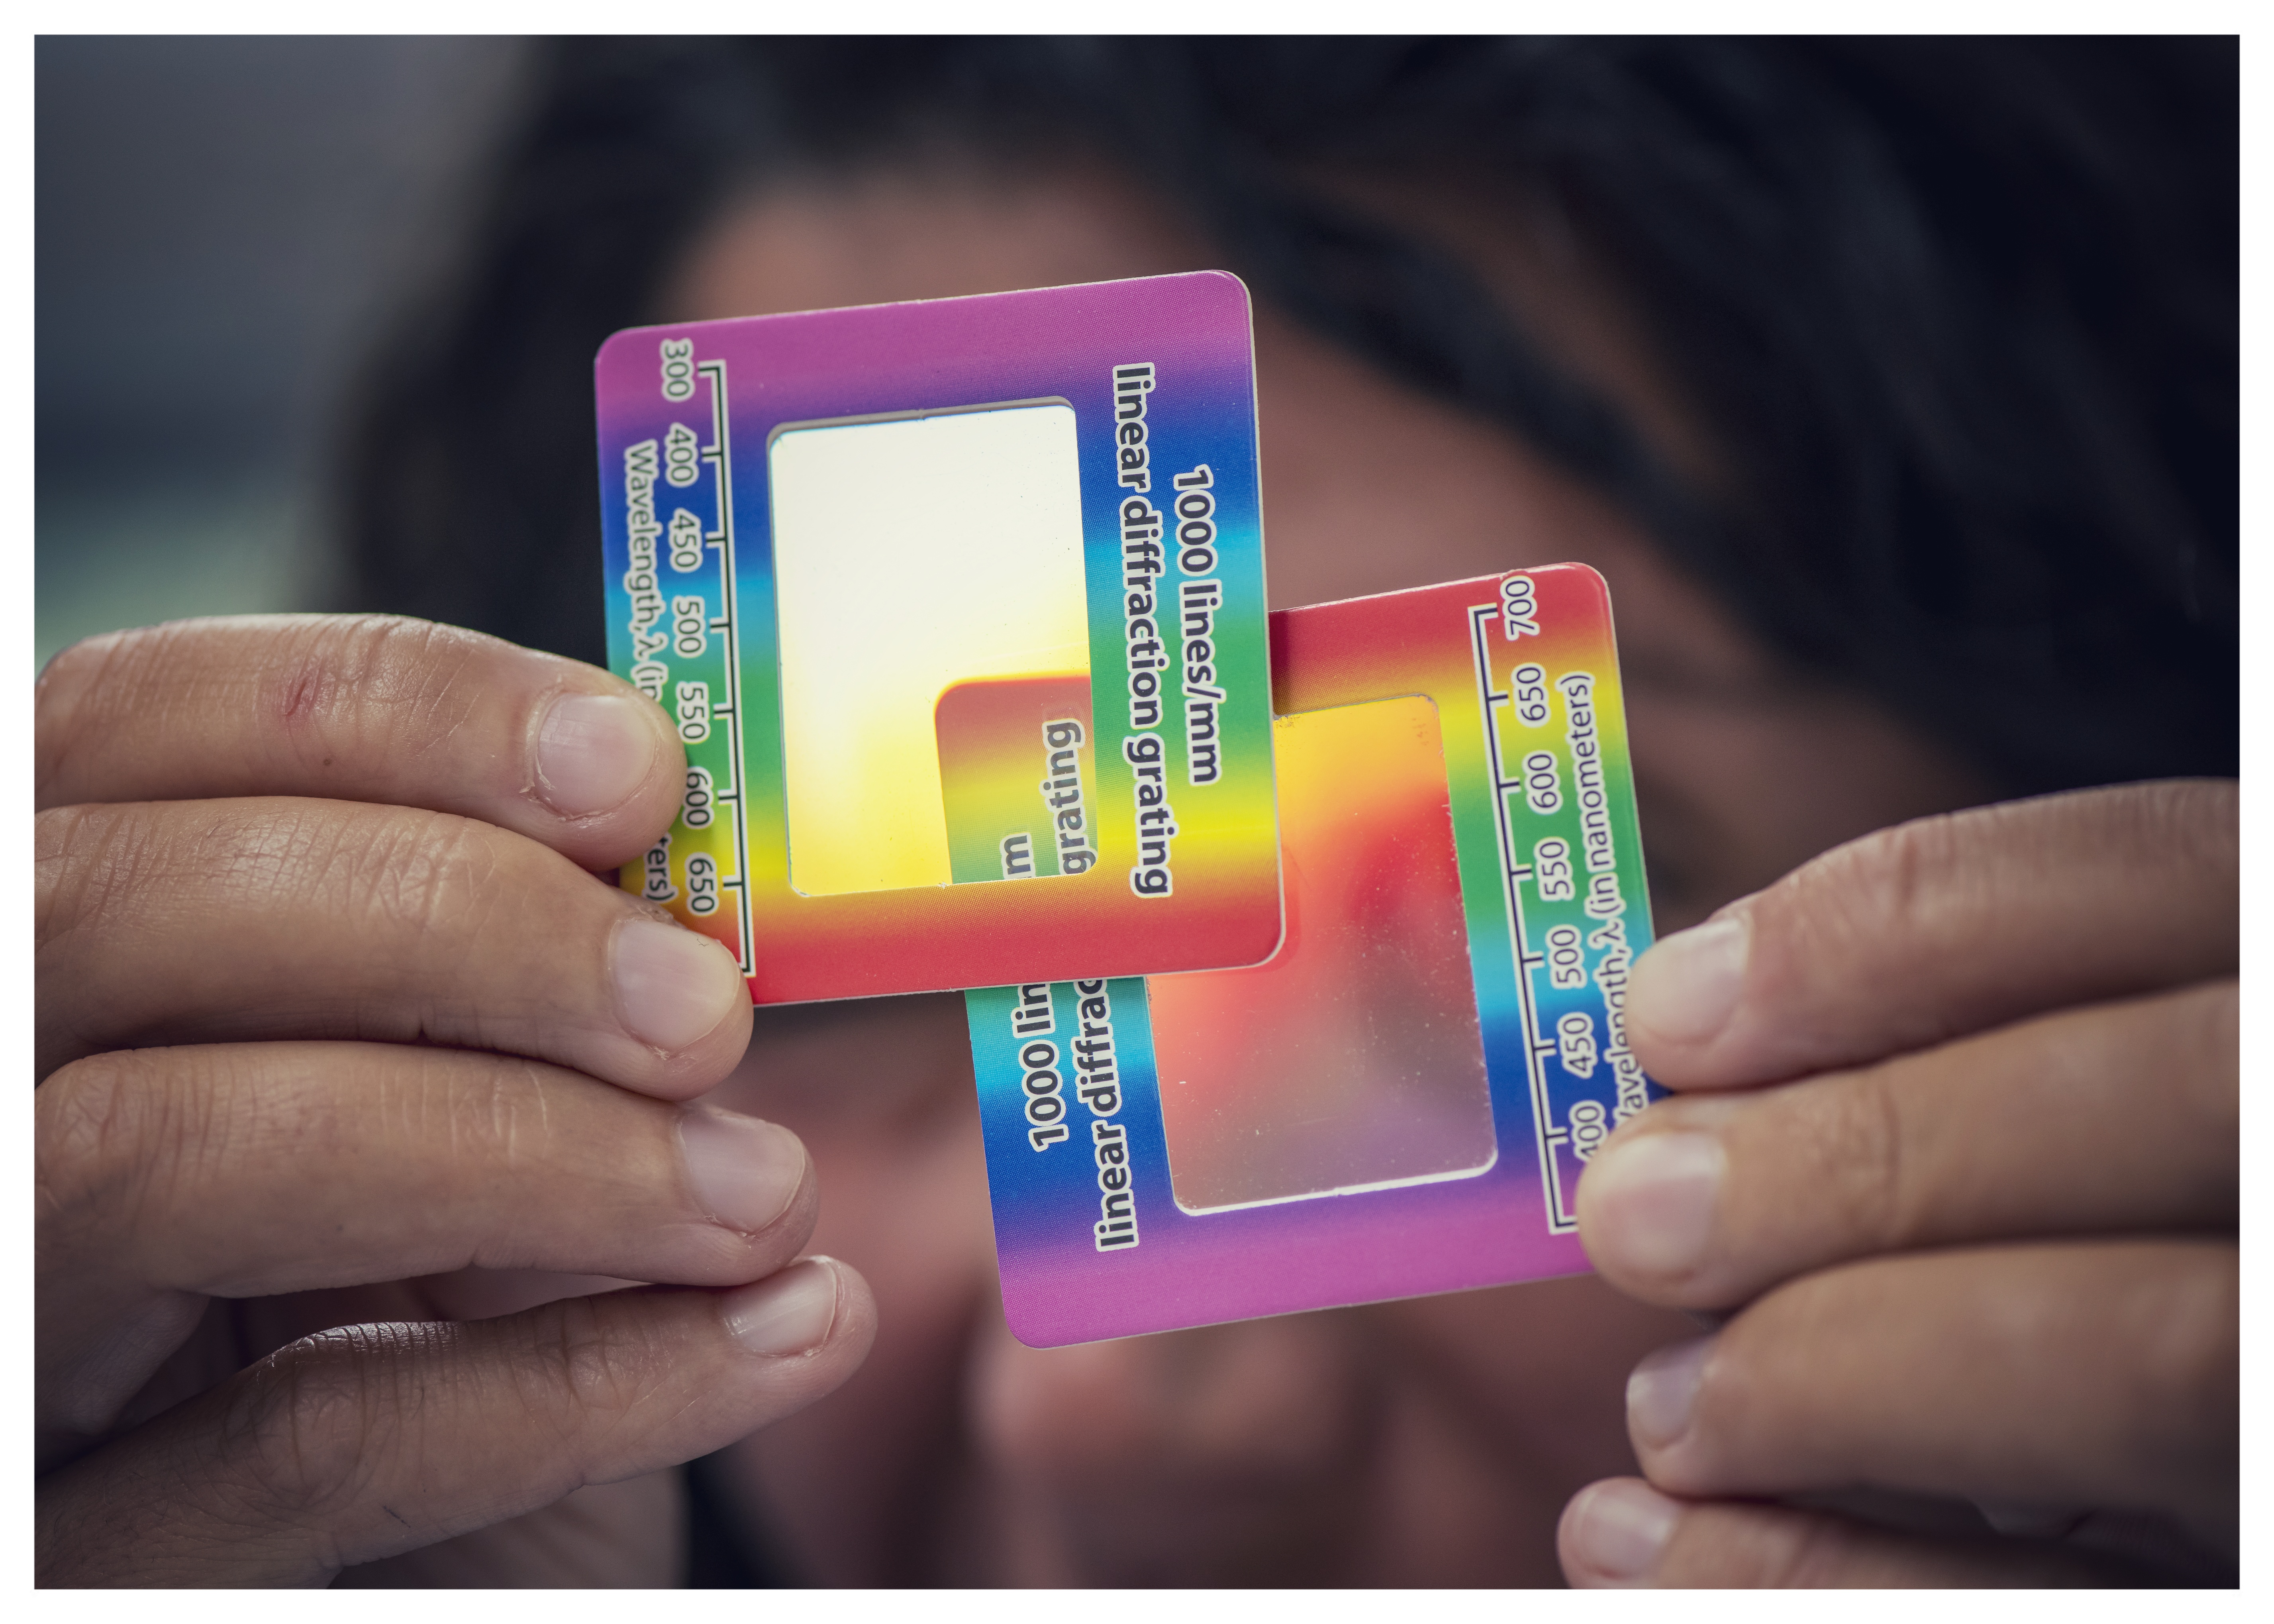
Interference and diffraction of waves not only produces interesting visual effects by interaction of waves in nature, they can be harnessed as a powerful tool for the study and measurement of tiny objects. Although the phenomenon has been known about for centuries, it is of special interest today. More and more technology relies on micro-- and nanometer--sized particles – too small to be seen by a normal microscope. By understanding diffraction and the interference of light waves and using them smartly, not only can we peek into this microscopic world, we can even manipulate objects in it. Photo 1
To gain an intuition about light diffraction, where our wavelength is in the nanoscale, we can look at our experiences with sound involve diffraction. The fact that you can hear sounds around corners and around barriers involves both diffraction and reflection of sound. Diffraction in such cases helps the sound to "bend around" the obstacles.
Light too can bend when it encounters a corner, we have have designed a spectrometer to exploit this feature using a Diffraction Grating.
Diffraction experiment
Place an A3 sheet of paper on the table. Draw a central axis line on the sheet of paper. Switch on a laser light, place it on the sheet pointing along the axis you have just drawn. Place the diffraction perpendicular on the central line in the perpendicular orientation and mark its position on the central line.
First using the red laser, point it directly along the central line and through the diffraction grating. The laser light will produce three spots on the vertical paper. The central spot is the ‘straight through’ beam from the laser. The outside spots are the diffracted beams. Using a red pen, mark the position of the three spots. Now replace the red laser with a green / blue laser and again point the laser along the central axis such that the central spot overlaps with the central mark from the red laser. Mark the position of the diffracted spots using green / blue pens.
Measure the distance between the diffraction grating and the projected spots. Call this distance d. Take down the sheet of paper and measure the distance between the central spots and the diffracted spots. For each colour measure the distance between both the left and right spots and find the average. Let this distance be y. We can now calculate the angle (θ) the light is diffracted at for each wavelength through the diffraction grating
Calculate theta = tan^(-1) (y /d)
Now we can use the diffraction equation to calculate the wavelength of light emitted from each laser: nλ = dsin(θ)
n is the order and you will see that only one order is seen with this diffraction grating, n = 1.
λ is the wavelength of the light
d is the distance between consecutive lines of the grating = 1 / 1000 (mm)
θ the angle the light is diffracted at for each wavelength through the diffraction grating
Rearranging the diffraction equation: λ = dsin(θ) / n
λ ≈ 630 nm for red.
λ ≈ 560 nm for green
Blue?
A good approximation for the central region of the visible part of the visible spectrum is 545 nm.
Calculate the angle of diffraction for this wavelength. = 33°.
This is the reason the spectrometer is angled the way it is.
How do cameras ‘see’ the light? Will a camera sensor see outside the visible portion of the spectrum? Demonstrate using the IR light emitting diode on a remote control to show that a smart phone camera will easily see this portion of the spectrum.
Part List


Basic spectrometer:
Photonics parts:
*1 diffraction grating
Other parts:
*black insulation tape
Tools (for example in Fab Labs):
*3D printer
Advanced spectrometer:
Photonics parts:
*1 diffraction grating
Other parts:
*black insulation tape
*Raspberry Pi Zero kit
*PI NoIR Camera V2
*Camera ribbon
*SD card (8GB) and USB stick (flash drive)
*7 port hub
*Power cable
Tools (for example in Fab Labs):
*3D printer
*Computer with SD card reader
Don't find the material you are looking for? Via this link you could buy all the photonics material needed for this workshop. http://b-photonics.eu/photonics-toolkit/general-p...
Construction of the 3D Printed Spectrometer With Diffraction Grating


Photo 1: Details of the spectrometer.
The following are the steps to construct the spectrometer:
1. First things first, the spectrometer must be 3D printed using the Spectrometer V4.stl file (See attached). One spectrometer per person is usually the way to run the workshop but you can also work in pairs, if need be. The printed spectrometer should look similar to the one on photo 2.
2. Next, remove the waste 3D printer plastic surrounding the spectrometer components, as per photo 3. Note: There is a piece protruding out of the spectrometer (circled in red), please do not remove this as its function is to block out stray light from the slit entering the eye/camera. Also, please do not remove the flaps (circled in blue). They are very similar to the waste plastic but they do serve a purpose, as you will see.
3. Now fold the spectrometer base into a rectangular tube and use insulating/black tape to stick the opposing edges together as on photo 4. Try blocking out as much of the gaps with the tape as possible as to neglect any stray light entering the spectrometer.
4. Fold over the top panel, with the slit, covering the end of the tube as on photo 5. Tape down the edges, again blocking as much of the gaps as possible with the tape. Be Careful not to tape over the slit itself as this is where light from the source will enter the spectrometer.
5. Now take the square panel and cover the square hole in the spectrometer. It should click in, then tape over it to get rid of any gaps. Photo 6. Note: To take this workshop further, a cuvette should fit into the square hole instead of covering with the square. The spectrometer can then be used to construct absorption/transmission spectra of different substances. This is Optional though and should only be done if there is enough time and interest.
6. Next, carefully bend the flaps at the open end of the spectrometer out as on photo 7.
7. Now tape the the diffraction grating to the flaps as per the below images. This must be done in the correct orientation (as in photo 8) or else the spectrometer will not work properly. And again, try to block out any gaps with tape.
8. At this point, if done adequately, you will be able to see spectra if you point the slit at a light source and look closely into the spectrometer through the diffraction grating. You can also use your phone camera to test. Point the camera through the diffraction grating, covering any gaps and take a photo. You should be seeing something like the below image. The ‘ghostly’ light at the bottom of this image is due to light getting into the camera through gaps in the spectrometer at the diffraction grating. This is one of the reasons it is so important to block any gaps, to get decent looking spectra. Photo 9
9. Now take the last piece of the spectrometer, and fold the outer three pieces inwards, in the same direction as the four pins, and then tape, again blocking any gaps. These pins will be used to keep the PiCamera in place. Photo 10
10. Next, the spectrometer needs to be changed a little bit. Carefully cut the top piece of the diffraction grating off as on photo 11. Try to tape any gaps again to block out stray light, don't worry if a little bit of the top of the diffraction grating gets covered.
11. Next, tape the top edge of the folded piece which protrudes further than the others to the top of the spectrometer, where the diffraction grating was cut as per the images below. Leave the sides un-taped as we need a bit of flexibility to add more parts. Photo 12
12. Now point the slit of the spectrometer at a computer screen showing a white image, holding it similarly as photo 13.
13. Looking through the hole, you should see something like photo 14. Notice the discrete spectra bands, this is due to the nature of computer screen pixels.
Downloads
Basic: Obtaining Spectra and Analysis Using Imagej


Now, by pointing the spectrometer at a light source and the camera of a phone camera into the spectrometer, we can obtain pictures of the various spectra. Images of the diffraction pattern for each wavelength of light source will be taken. As the wavelength varies, spacing between the order will change. The recorded images can then be analysed using ImageJ software https://imagej.net/Downloads with the distance between dots measured in pixels. The distance between dots will also be measured using a meter stick.
Since nλ = dsin(θ), for large distance d we have θ = y / d, the students can estimate the wavelength of the light and graph the relationship between y and n, this will have a different slope for each wavelength of light source.
Photo 1, 2: Spectral images of various spectra.
Photo 3: Spectral images and profiles of the LED lamp as emits various colours of light.
Instructions for calibrating the spectral lines
Image the spectral line emitted from low pressure sodium. This line is a known wavelength of and we shall call it λ1. In imagej note the pixel of maximum intensity for this line, we will call this p1.
Image the spectral line emitted from mercury. This line is a known wavelength of and we shall call it λ2. In imagej note the pixel of maximum intensity for this line,we will call this called p2.
We can now have a calibration equation:
Each pixel corresponds to (p2 – p1 / L2-l1) nm
Say 600 nm – 400 nm = 500 – 100 i.e. 200 nm across 400 pixels i.e. each pixel = 0.5 nm
Advanced: SD Card Mount, Raspberry Pi Software & Setup


The first thing that needs to be done is downloading the Operating System (Raspbian) for the Raspberry Pi zero and flashing it on to an SD card, which will be inserted into the Pi itself.
The software for the raspberry pi system is available at:
https://www.raspberrypi.org/downloads/raspbian/
Then the image of the raspberry pi system needs to be flashed (copied) to an SD card using an SD card reader such as the one linked below:
https://www.mymemory.co.uk/mymemory-all-in-one-usb...
The OS can then be flashed directly using Etcher software that is freely available online https://etcher.io/
Photo 1
Our system image already has all the accompanying python and wifi capabilities installed, it is only necessary to construct and power the system.
For further Instructions, visit the Website below:
https://projects.raspberrypi.org/en/projects/raspb...
Once Raspbian has been flashed onto SD the card, it can then be inserted in the Raspberry Pi zero board as on photo 2. Handle the Raspberry Pi very carefully as not to damage it from static etc.
Next, connect the PiCamera to the Raspberry Pi via the connector as on photo 3. Again, do this carefully.
The PiCamera can now be connected to the spectrometer. Fold back the top taped edge of the spectrometer entrance past the diffraction grating and rest it down, as on photo 4.
Then place the PiCamera onto the 4 pins of the spectrometer mount and secure with a small bit of Blue tack as on photo 5. Try to keep the camera as flat as possible as to be pointing into the spectrometer.
Now, fold back over the entrance of the spectrometer and tape the two side edges down. Photo 6
Lastly, attach all your bits and bobs (Monitor, Keyboard, mouse, case etc.) and there you have it, a Raspberry Pi based spectrometer.
If you are having any trouble so far, check the Raspberry Pi website or contact NUIG as we are happy to help.
Now we need to boot up the Raspberry Pi and check everything is working correctly. To boot up the Pi, insert the power cable and it should start flashing. You will now see Raspbian booting on your monitor and will shortly be greeted with the Raspbian Desktop. We now need to enable the PiCamera as per the Raspberry Pi website, photo 7.
In Raspberry Pi Configuration, enable the PiCamera, if not already enabled. Photo 8
Now we can test the Spectrometer and PiCamera. Place a light source at the entrance slit of the spectrometer and open up the ‘Run’ application (circled in red in photo 9) on the Raspberry Pi.
Then enter the following Command into the Prompt:
raspistill -o cam.jpg
This command will take a still image from the PiCamera, and save it at the directory /home/pi/cam.jpg. Check that the image has saved properly as to make sure the PiCamera is operating correctly.
Next we need to check that the correct python libraries (numpy and matplotlib) are installed as these are needed for the python code to work. Open up the terminal from the raspbian desktop (circled in red in photo 10).
The Terminal Window will then pop up, it is here from which we will install numpy and matplotlib. Firstly, type the following command into the terminal and press enter:
sudo apt-get install python3-numpy
Numpy may already be installed, and if so, the terminal will tell you that the newest version is already there when you enter the above command. If it is not installed, the terminal will install it for you, just enter the command and wait for the terminal to finish the install.
Now we will do the same for matplotlib. In the terminal window, enter the following command:
sudo apt-get install python3-matplotlib
As before, the terminal may tell you it is already installed when you enter the above command, if not let it install.
If these do not work, you may have to connect the Raspberry Pi to the internet. This is done similarly to any other computer. There is a network connections application in the top right hand corner of the desktop, click this and connect to your preferred network as with any other computer.
Advanced: Python and Imaging of Different Light Sources


Now we can download the python program that will operate the PiCamera and obtain spectra from different light sources. Download a copy of the python file (Spectrometer_Python_Code.py, see attached) onto a USB flash disk. Then transfer this file onto the desktop of the RaspberryPi. Once the file has been transferred to the RaspberryPi, we can run the programme. Open the Python 3 (IDLE) from the applications menu (see photo 1).
Once this opens, click File > Open and then navigate to the desktop, where you have put the Spectrometer_Python_Code.py file. You should be seeing something similar to photo 2 once opened.
To run the programme click Run>Run Module. When you run the program, it will begin by showing a full screen preview of what the PiCamera is ‘Seeing’. Point the spectrometer at a light source and use the preview to align the PiCamera with the spectrum from the light source in the middle of the preview. Do not point away from the light source when the preview has ended, hold it there till the full python script has executed. Once the script has fully executed, you should be greeted by something similar to photo 3 (make sure to hit fullscreen if the figures are too small).
Note: light is escaping from the slit to the camera, this is due to misalignment of the spectrometer when constructed.
Notice the white line on the PiCamera image (circled in red) in photo 3, it is along this line of pixels in the image that the spectra on the right is taken from. It is for this reason that the preview should be aligned so that the spectrum is in the centre of the image, otherwise, something similar to photo 4 will happen, and you won't get much of a spectrum.
If you are having trouble getting a spectrum in the centre of the image, then you can change the position of this line. In the python script edit the following line of code:
Spectrum_Line_Height = 540
This value is just how high up the line is on the image in pixels. Changing the 540 to something like 300 and running the program again would yield similar to photo 5.
Notice the white line (again circled in red) has shifted down. So if you cannot get a spectrum at the middle of the image, try shifting this line as needed and taking the image again.
One last consideration to take into account when using this program is the spectrum width. Notice in photo 6 that the spectrum on the right only shows pixel values (on the x-axis) from 500 to 1100 (which lie along the white line). This is because we only want to look at the the spectrum rather the dark camera pixels around it, or in the case of the below, the entrance slit as well.
The two small red vertical lines in the PiCamera Image above show the starting and ending pixel on the white line which will determine the amount of pixels in the spectra. If the spectra you are obtaining are skewed significantly to the left or right, you can change these value by editing the following two lines of code in the python script:
Spectrum_Line_Minimum_Horizontal_Pixel = 500
Spectrum_Line_Maximum_Horizontal_Pixel = 1100
Changing the 500 to 100 will shift the first redline to the left and give a wider spectrum and increasing or decreasing the 1100 will shift the second red line to the right or left. Play around with these values if need be.
Once you can obtain a spectrum, you can try using some calibrated sources to make a pixel vs wavelength calibration curve, in excel or otherwise, if time permits of course.
Lastly, feel free to make changes to the workshops or python code and make the workshop your own. And again, if you have any problems, do not hesitate to contact NUIG as we are happy to help.
End Results & Conclusion

 (Small).jpg)

What we learned?
You have learned about the spectral content of different light sources and that we can measure and quantify the wavelengths of light using readily available technology. We learned about how we can use interference and diffraction to create a simple spectrometer and record data from different light sources using our eyes and our phone cameras.
Concluding thoughts
The spirit of Phablabs 4.0 is to integrate photonics with existing technologies to show that light is fascinating and can be used to gain a physical understanding of our world. By leveraging hacker tech that pervades current Fablabs and Maker projects, we can excite interest and inexplicably link the concepts of technological innovation and photonics in our participants minds.
ABOUT PHABLABS 4.0 EUROPEAN PROJECT
PHABLABS 4.0 is a European project where two major trends are combined into one powerful and ambitious innovation pathway for digitization of European industry: On the one hand the growing awareness of photonics as an important innovation driver and a key enabling technology towards a better society, and on the other hand the exploding network of vibrant Fab Labs where next-generation practical skills-based learning using KETs is core but where photonics is currently lacking. www.PHABLABS.eu
This workshop was set up by the 'Tissue optics & microcirculation imgaing group' of the National University of Ireland, Galway in close collaboration with Makerspace NUIG.