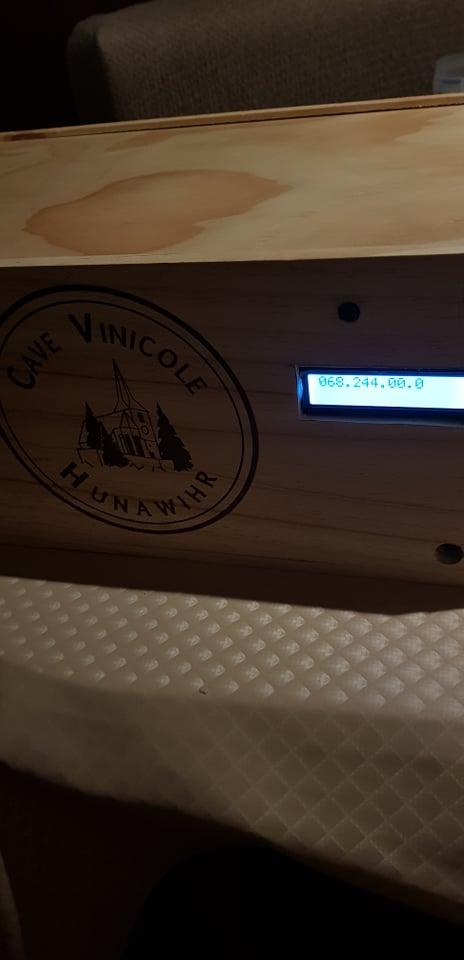
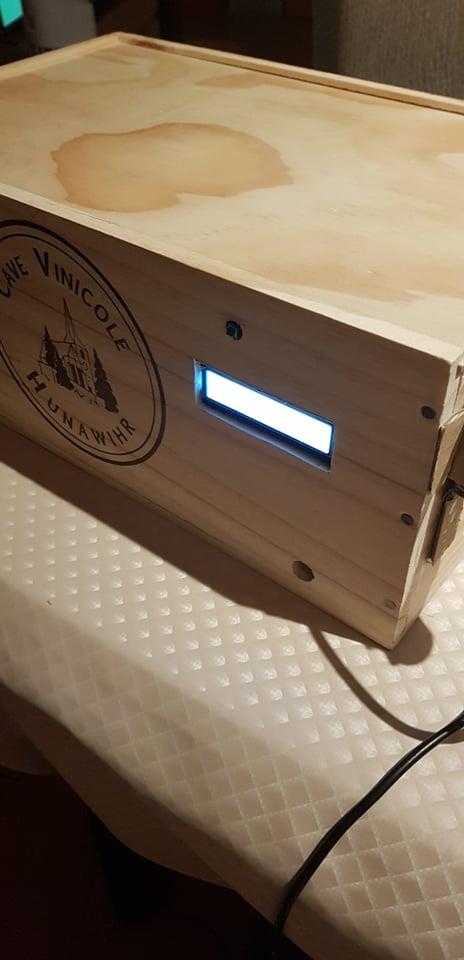
Smart Wine Box
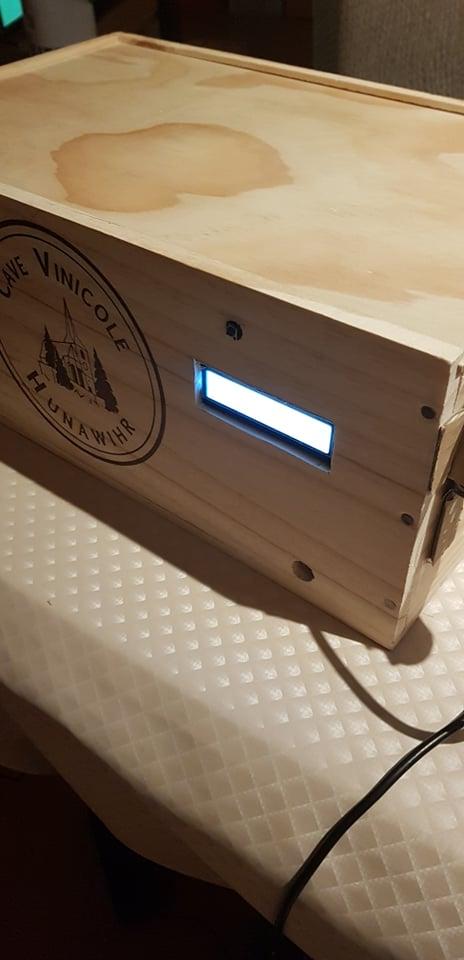
In this instructable I will show you how to make a smart wine box with the raspberry pi.
This is my first Internet Of Things project.
The wine box has a servo motor to control acces while keeping track of incoming data from 3 different sensors.
Data history will be kept in a MYSQL database.
The data will be shown on a (Flask) website hosted by the raspberry Pi.
With an LCD we will show the current IP adress in use.
Full code can be found on my github.
Note: The datahandler file can be left out since I put the same code in script.js
Parts and Material List for Project
Computer/microcontroller:
- Raspberry Pi 4 Model B (with GPIO attachment)
Parts
- MG 996R Servo motor
- DHT11 sensor
- DHT22 sensor
- GL5537 LDR sensor
- (16x2) LCD - display
- Basic (electrolytic) Capacitor
- Potentiometer
- (Tactile) push button
- DuPont Male-Female jumper wires
- Breadboard wires
- 1 x 10k Ω(ohm) resistor
- 1 x 470 Ω(ohm) resistor
Housing
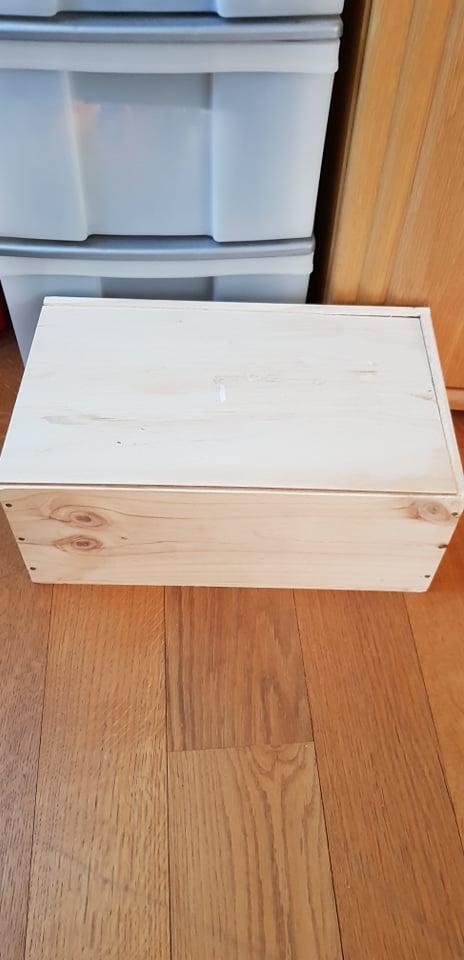
- I used a regular wooden wine box.
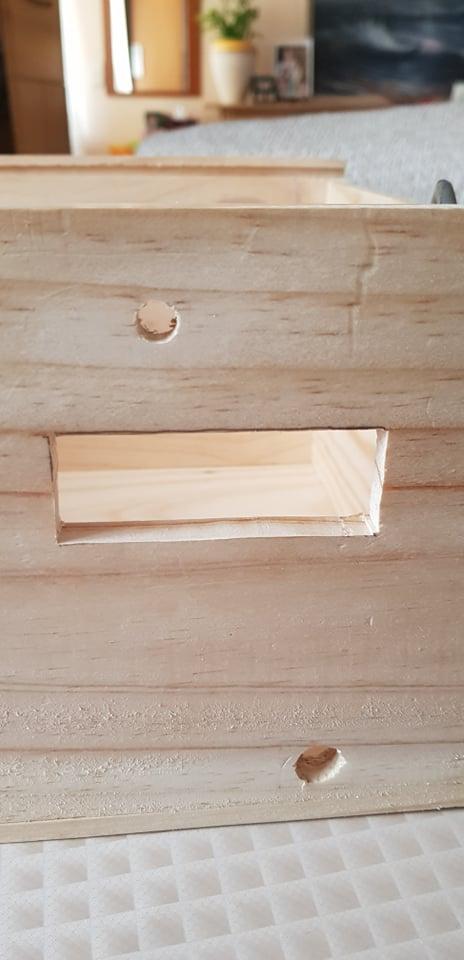
I cut some wood out for cabling and electronics.
Extra
- I made a wooden attachment for the servo motor (optional).
Software
- Visual studio code
- MYSQL workbench
Make sure that you have SSH connection with the Pi
For an estimation of the price, you can check out the BOM (Bill Of Material) file.
Downloads
Breadboard Circuit
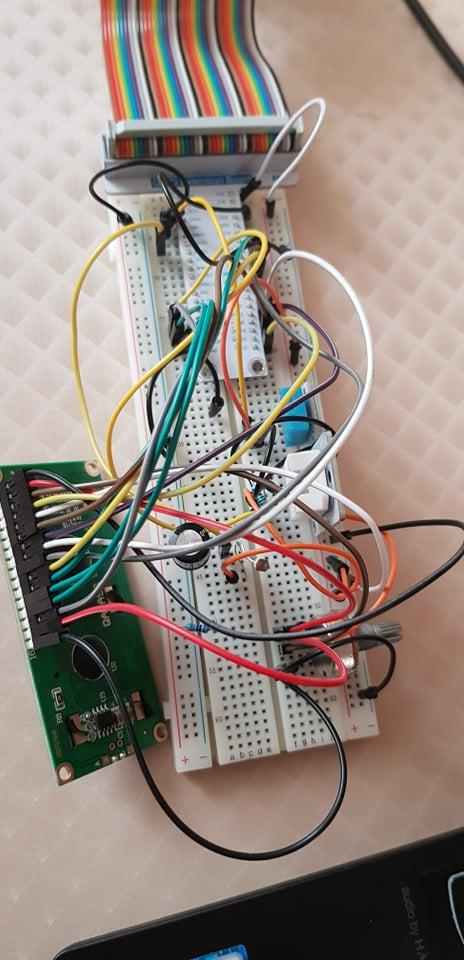
Breadboard and GPIO
- Both sides of the breadboard should be connected to the GPIO Ground(Gnd) of each side.
- One side will be 3.3V and the other 5V. It's recommended to use an external power source.
DHT11:
- Signal --> GPIO(4)
- Vcc(+) --> Breadboard (+) (5V side)
- Gnd(-) --> Breadboard (-) (5V side)
DHT22:
- Signal --> GPIO(26)
- Vcc(+) --> Breadboard (+) (5V side) + 10k Ohm resistor to Signal
- Gnd(-) --> Breadboard (-) (5V side)
LDR and Capacitor:
- LDR(-) + Capacitor(+) --> GPIO(27)
- LDR(+) -- Breadboard(+) (5V side)
- Capacitor(-) --> Breadboard (-) (3.3V side)
LCD display and potentiometer:
- Vss --> Breadboard(-) (5V side)
- Vcc --> potentiometer (+)
- V0 --> potentiometer(signal)
- RS --> GPIO(21)
- R/W --> Breadboard(-) (5V side)
- E --> GPIO(20)
- DB0 --> GPIO(16)
- DB1 --> GPIO(12)
- DB2 --> GPIO(25)
- DB3 --> GPIO(24)
- DB4 --> GPIO(23)
- DB5 --> GPIO(26)
- DB6 --> GPIO(19)
- DB7 --> GPIO(13)
- Led(+) --> potentiometer(+)
- Led(-) --> potentiometer(-)
- potentiometer(+) --> Breadboard(+) (5V side)
- potentiometer (-) --> Breadboard(-) (5V side)
Button:
- Button(+) --> GPIO(18)
- Button (-) --> 470 ohm resistor --> Breadboard(-) (3.3V side)
Servo motor:
- Signal --> GPIO(22)
- Servo (+) --> Breadboard(+) (5V side)
- Servo(-) --> Breadboard(-) (5V side)
Database Setup
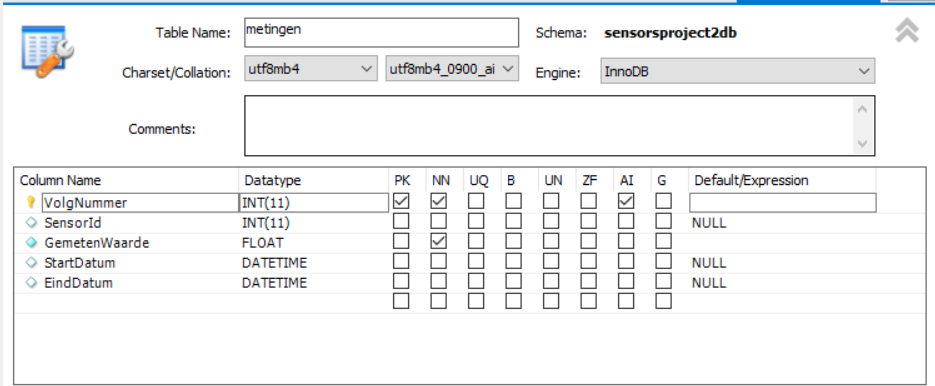
MYSQL table
For the database, make a new table and configure it like this:
- Number as Primary Key(PK) and INT (Also check the Auto Increment box)
- SensorId as INT to know from which sensor the data comes from.
- Measurement/value as FLOAT and Not Null(this ensures that we only insert real vales from the sensors)
- StartDate and EndDate as DATETIME . This is only needed to make charts.
Database in IDE (VsCode): config.py and repositories directory
IMPORTANT: connect in VsCode with SSH first
Make a repository or workspace where you will put all your project files in:
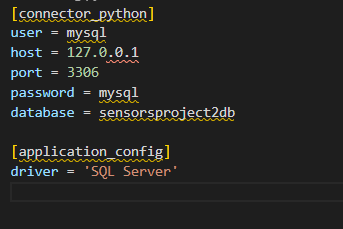
- Make a file named config.py and connect it to your mysql database (change your database name ofcourse).
- Make a directory named repositories.
- In the repostories directory make 1 file named Database.py and DataRepository.py.
Database.py
- Make sure to install the correct packages with pip3 install mysql-connector-python.
- You don't have to change anything in the file.
DataRepository.py
- This file is used to store the received data from the sensors to the database.
- SELECT statements are used to select specific data from sensor x.
- INSERT statements are used to push data from sensor x to the database.
App.py (Flask Setup)

app.py
- Make a file named app.py.
This will be the main file where we use Flask to host our webserver.
- Install the correct packages:
- pip3 install flask-socketio
- pip3 install flask-cors
- pip3 install gevent
- pip3 install gevent-websocket
- If you get an error saying there are packages missing, install the missing packages.
Downloads
App.py (Flask Routes)
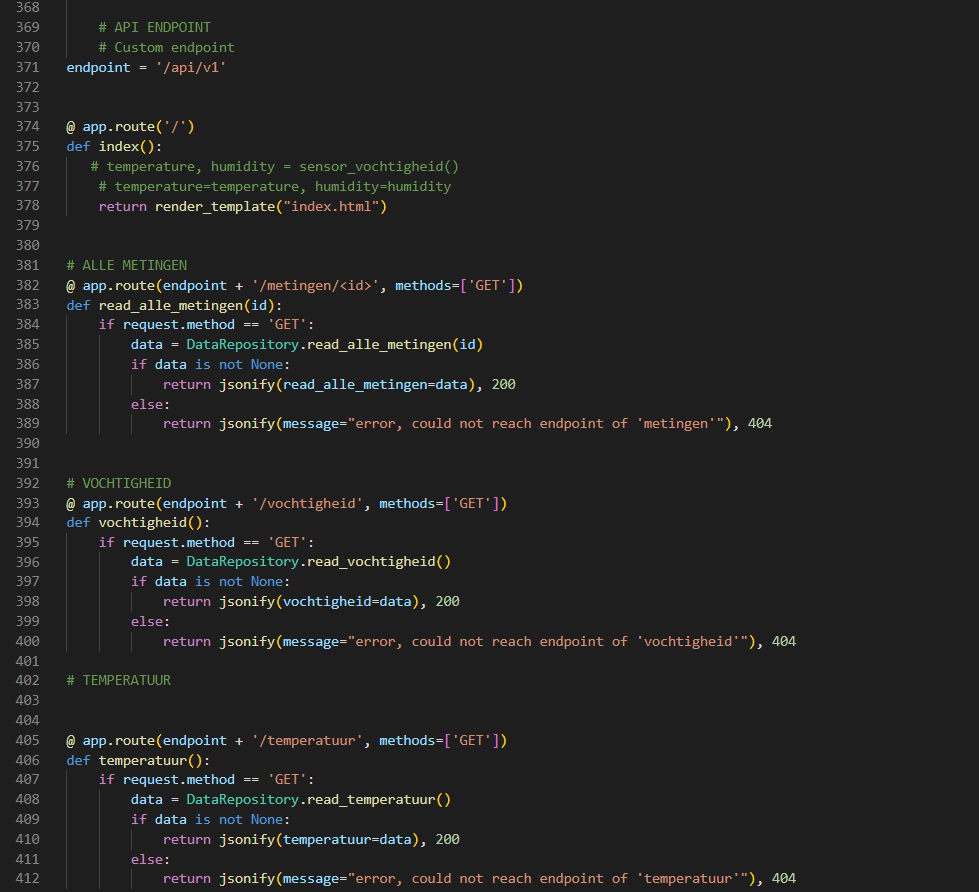
Flask routing in app.py
- We make make use of Flask routes to reach the sensors data (with GET methods).
- Have a look at the code and how it calls the methods from DataRepository.py.
- The first route goes to index.html for our frontend later on.
Sensors Code (DHT11,DHT22)
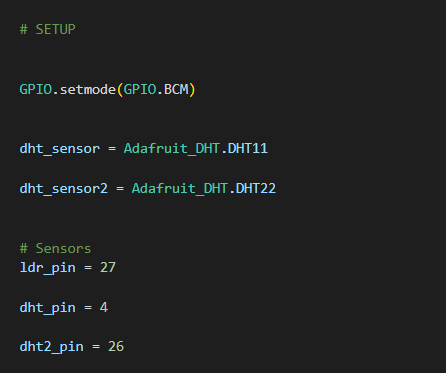
GPIO
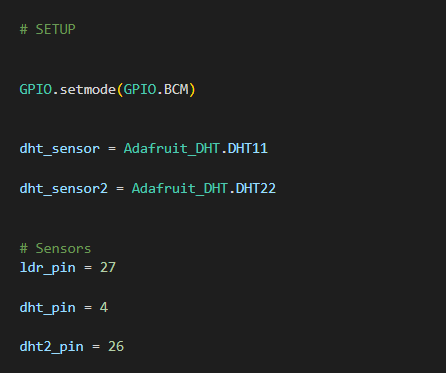
- GPIO.setmode(GPIO.BCM) because BCM numbering is used in the code.
DHT11 and DHT22
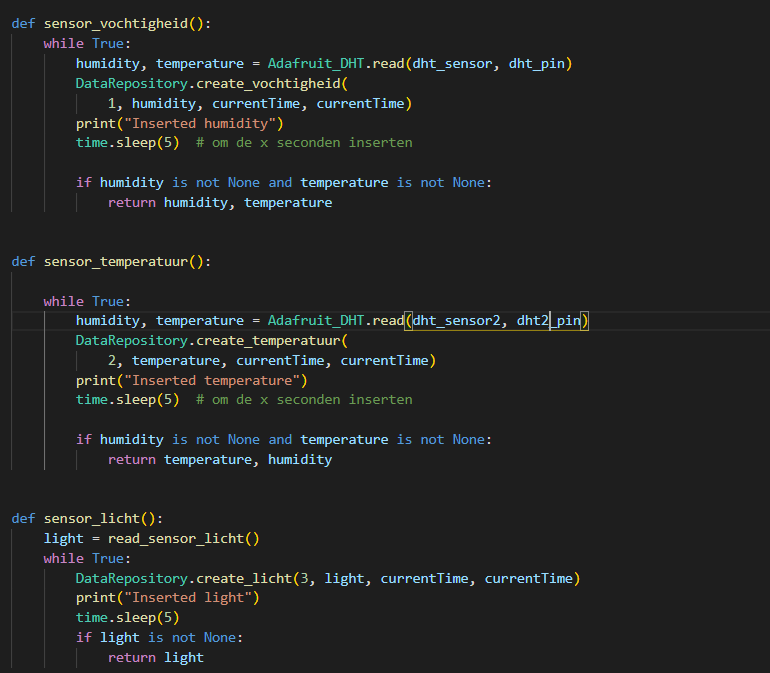
- We use the Adafruit library to help us read the sensors.
- Again in the code we use the methods from DataRepository to insert data this time.
Sensors Code (LDR)
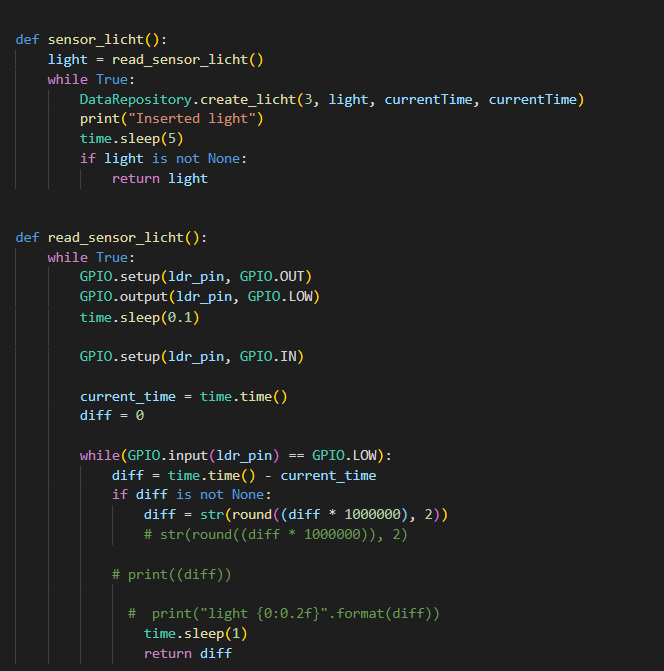
LDR
- First we have the function read_sensor_light which is the
individual code to get the measurement of the LDR. - With sensor_light function we insert the data to the database.
Result of Inserting Data From Sensors to Database

Frontend : Index.html, Style.css
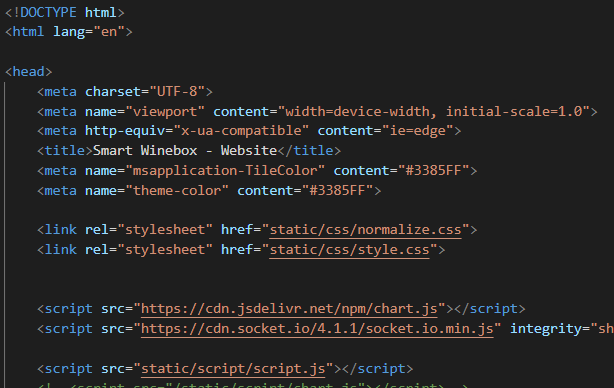
For the frontend webserver we use the standard
- index.html
- style.css
- (normalize.css)
Index.html
- Inside the index.html there will also be references to
- style.css for styling
- script.js for Javascript
- chart.js and chartJS library for our charts
- SocketIO library
Frontend: Script.js

Preparing data for data filling
- Get data from the database (getTemperature)
- Fill the data with a show function (showTemperature)
Filling dynamic data into our index.html
Now to insert dynamic data to our index.html we make use of 'js-classes' which we will fill with the data we have from the sensors in the script.js
Frontend: Result of Data Filling
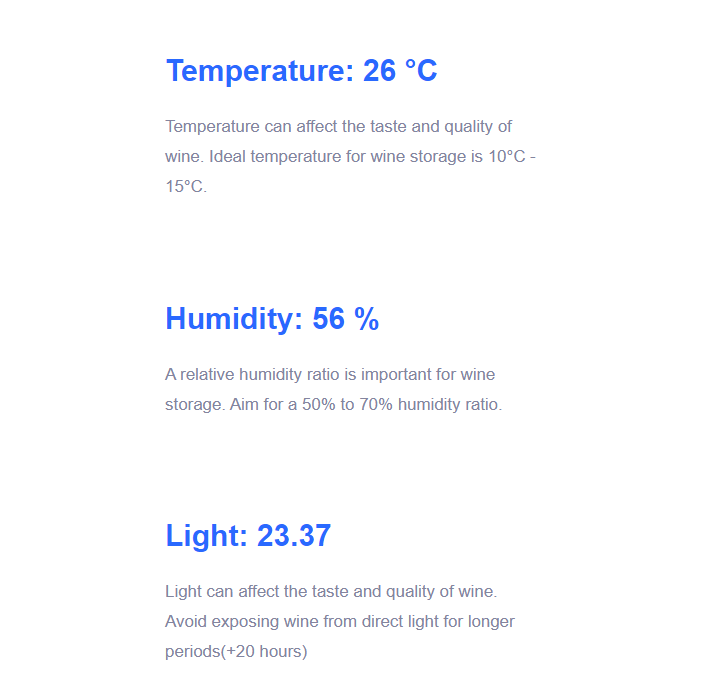
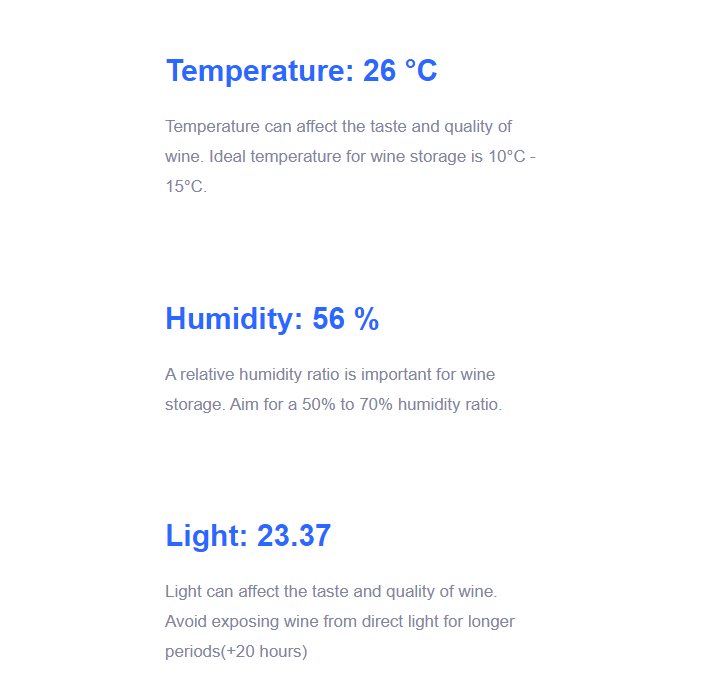
Now the website shows live data that we get from the database.
Frontend: Chart.js

Inserting chart in index.html
- Make sure that the index.html has canvasses for each chart, every chart has it's own class.
Frontend: Chart.js
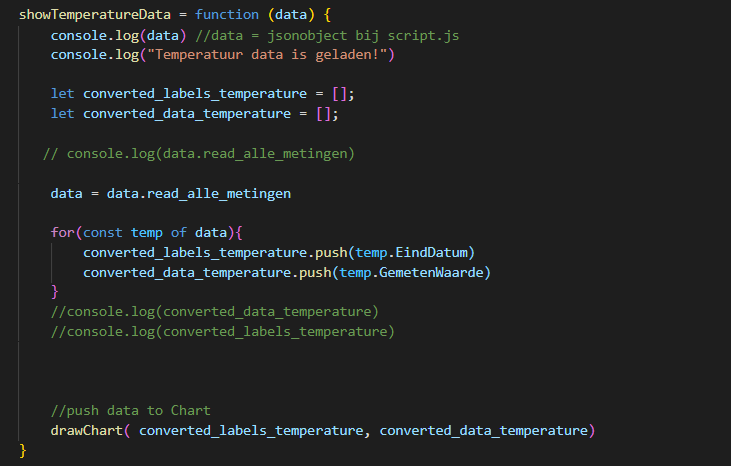
Preparing data for charts in chart.js
- First we have to get the data from the database (getTemperatureData)
- Then we have to create 2 empty lists which we will fill in our data (showTemperatureData)
- Push the data inside the drawchart function to create the chart
Creating /drawing the charts in chart.js
- Reference the js-class from index.html
- Make a drawchart function to create the chart.
Frontend: Result of Creating a Chart
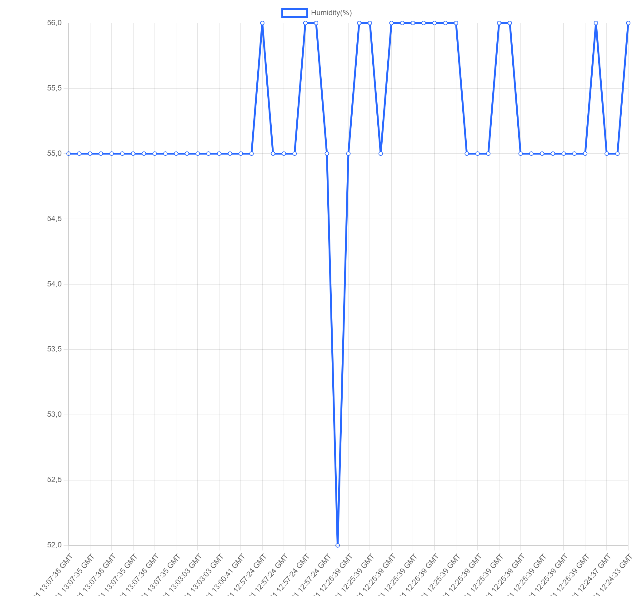
SocketIO in Script (to Control Servo Motor From Web)
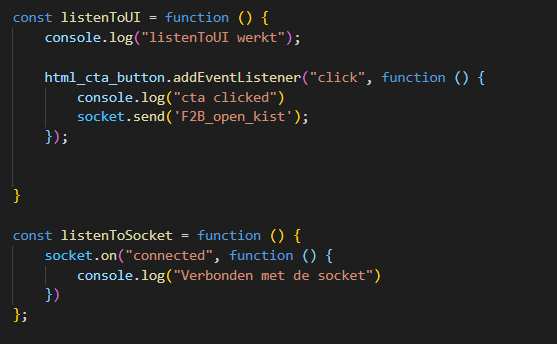
The script.js file also has
- listenToSocket function checks the socket connection in the webserver.
- listenToUI function that has a click function inside of it and sends
a socket send (with message F2B) to app.py.
SocketIO in App.py (to Control Servo Motor From Web)
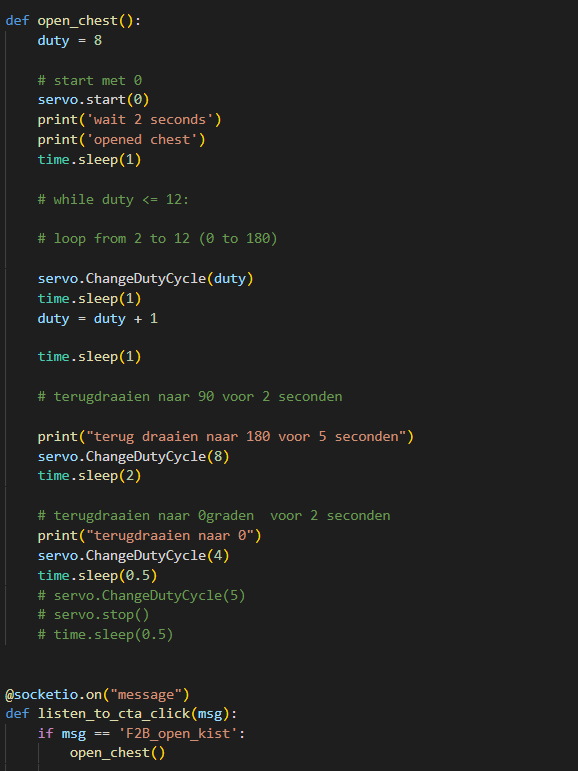
In the app.py
- listen_to_cta_click listens to the 'F2B' message which will then call the open_chest function.
- open_chest function contains the servomotor control code.
Downloads
Motor Control Through the Website (with SocketIO)
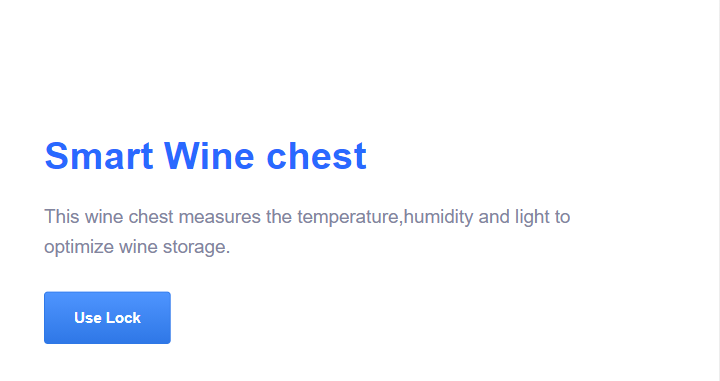
When the button is clicked on the website, the servomotor will unlock the wine box temporary.
LCD
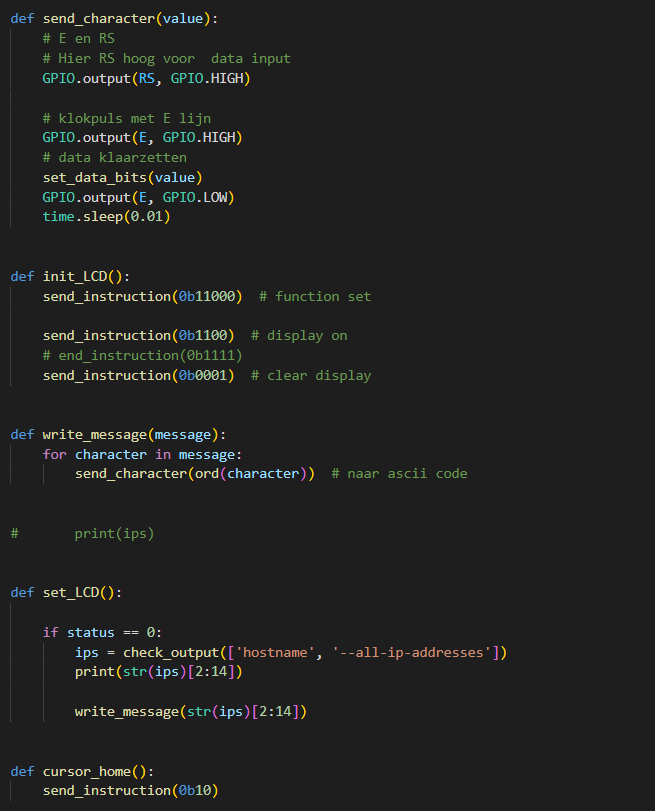
For this project I also have an LCD that shows the IP adress.
The code is in app.py
- set_data_bits()
- send_instruction(value)
- send_character()
- init_LCD() to initialize the LCD, have a look at the datasheet for the functionalities of the LCD.
- write_message()
- set_LCD() prints the IP adress
- cursor_home()
Downloads
Final Result
