Simple Example: Arduino+ESP8266+DS18B20
by chrwei in Circuits > Arduino
68903 Views, 79 Favorites, 0 Comments
Simple Example: Arduino+ESP8266+DS18B20

One of the coolest things about OneWire and DS18B20 temperature sensors is that each sensor has its own embedded address so you can have many of them on 1 data wire. However, due the conversion delay required for DS18B20 readings this can introduce quite a delay in your Arduino sketch if you use the delay() function like most examples do. The solution is to emulate an asynchronous system by using the Arduino millis() function and a variable.
Prerequisite:
- Arduino IDE installed with the ESP8266 board profile installed (I recommend Adafruit's Huzzah guide, which can easily be applied to any ESP8266 based board)
- A basic understanding of how to upload programs your ESP8266 module
- A basic understanding of programming in the Arduino IDE
Parts needed:
- ESP8266 based board
- USB-Serial device if your board doesn't have one built in
- If using an ESP-01, supporting circuit for programming and running it (not included in the drawings here)
- one or more DS18B20 sensors
- a 4.7K Ohm resistor
- breadboard and jumper wires as needed.
The DS18B20 specific code in this example is based on the code at elec-cafe.com which I did not write. My improvements, in addition to asynchronous-like operation, include being able to request a sensors by index and making the bulk of the work into reusable functions
Wire Up the Sensors

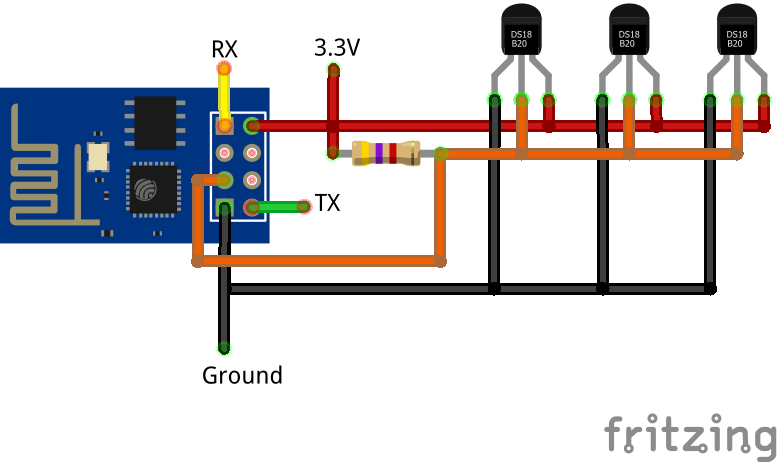
Wire the sensors as shown in the image. Put the 4.7K resistor between 3.3V and the data wire on GPIO2. You can add as many or as few DS18B20 sensors as you like, I show 3 here. They peak at about 1.5mA, idle at less than 0.001mA, and only 1 will ever be active at once, so you can add a whole bunch with very little power usage.
Upload the Code
Attached is the Arduino sketch. This example is bare bones and doesn't use the wifi. We'll use this sketch with the Serial Monitor only to discover your sensor's ROM addresses and to test them out.
Go ahead and upload the sketch and open the Serial Monitor. We'll discuss the output and the code in the next steps.
Downloads
Serial Output

Because we haven't programmed in our sensors ROM addresses yet you'll get some bogus temperature readings and some likes like:
ROM = 28 E7 B 63 4 0 0 44 Sensor not found in array
Copy out all these ROM lines, one for each sensor, so we can put them in the sketch. It helps to uncheck "Autoscroll" on the serial monitor to do this. Paste them into a text editor, or temporarily into the IDE on new lines, doesn't matter where as we'll remove them after some editing.
Now edit your lines into hexadecimal format, separated by commas, and wrapped in curly braces to make an Arduino Array notation. The ROM line above would look like:
{ 0x28, 0xE7, 0x0B, 0x63, 0x04, 0x00, 0x00, 0x44 }Now to put them in the code. First, find const int nsensors and replace the 2 with how many sensors you have. Next, find the line that starts with byte sensors, we'll be editing the lines between this and the }; line. If you have only 1 sensor, replace the first line of the example with your line, then delete the second line. Make sure you also remove the comma at the end of the first line. If you have 2, replace both preserving the comma. If you have more than 2, add more lines, placing a comma at the end of each one. The rest of the variables we can leave as is.
Examples: 1 sensor would look like:
const int nsensors = 1;
byte sensors[][8] = {
  { 0x28, 0xC1, 0x02, 0x64, 0x04, 0x00, 0x00, 0x35 }
};
4 sensors would look like:
const int nsensors = 4;byte sensors[][8] = {
  { 0x28, 0xC1, 0x02, 0x64, 0x04, 0x00, 0x00, 0x35 },
  { 0x28, 0xB1, 0x0F, 0x65, 0x04, 0x00, 0x00, 0x25 },
  { 0x28, 0xD1, 0x05, 0x34, 0x04, 0x00, 0x00, 0x55 },
  { 0x28, 0xE7, 0x0B, 0x63, 0x04, 0x00, 0x00, 0x44 }
};
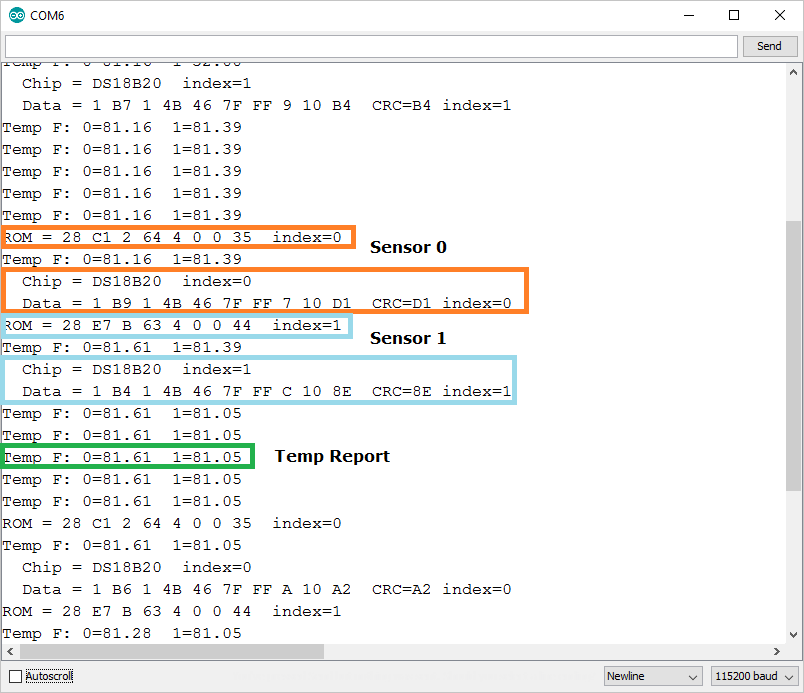
Upload again and now the serial output should look more like the image. If you get compile errors, double check the commas!
How to Use the Code
In the output you should see a Temp F line about once a second. The code for this is in the loop() function and will run whether or not the sensors are actually working. I picked 1 second as it helps show how querying the sensors works in an asynchronous-like manner with the temp printed in the middle of a read. You can change the interval by changing the "1000" in the line:
nextprint = millis() + 1000; //print once a second
You can change the output to Celsius by changing the 1 to a 0 in the ds18temp() function call.
The asynchronous-like magic happens in the ds18process() function, which we call from loop() every time. Ideally any code you add will not take very long to run and will return to loop() quickly using a similar technique.
To use these functions in a useful sketch, you'll want to remove all the Serial prints (and removing any loops that now have their contents commented out), and instead of having the temp print on an interval, call ds18temp() only as needed, such as when generating a web page.
There should be enough code comments to get an idea how the ds18process() function works, if there's any questions will try to cover them in the comments and update the guide as needed.
Using a Library
Attached is an example using the DallasTemperature library which can be found in the library manager. It didn't used to support asynchronous, but does now.
This version also simplifies address matching using the CRC and reduces the match process at the cost of an extra array in global ram.