Oscilloscope Display of PWM
by R Jordan Kreindler in Circuits > Electronics
24591 Views, 16 Favorites, 0 Comments
Oscilloscope Display of PWM
I believe I have made this Instructable easy to understand. However, if after reading this you have any questions, please feel free to get in touch with me directly. You can contact me at transiintbox@gmail.com. (Please replace the second 'i' with an 'e' to contact me. Thank you.)
If you do find this article helpful, even if it is relative to when you see it some months or years old, please be kind enough to mouse click "Favorited" at the top of this Instructable. Your support is appreciated.
In this Instructable, we see how to show Pulse Width Modulation (PWM) on an oscilloscope. In the process of doing this, we identify some ways to calibrate our oscilloscope probe(s), and our oscilloscope.
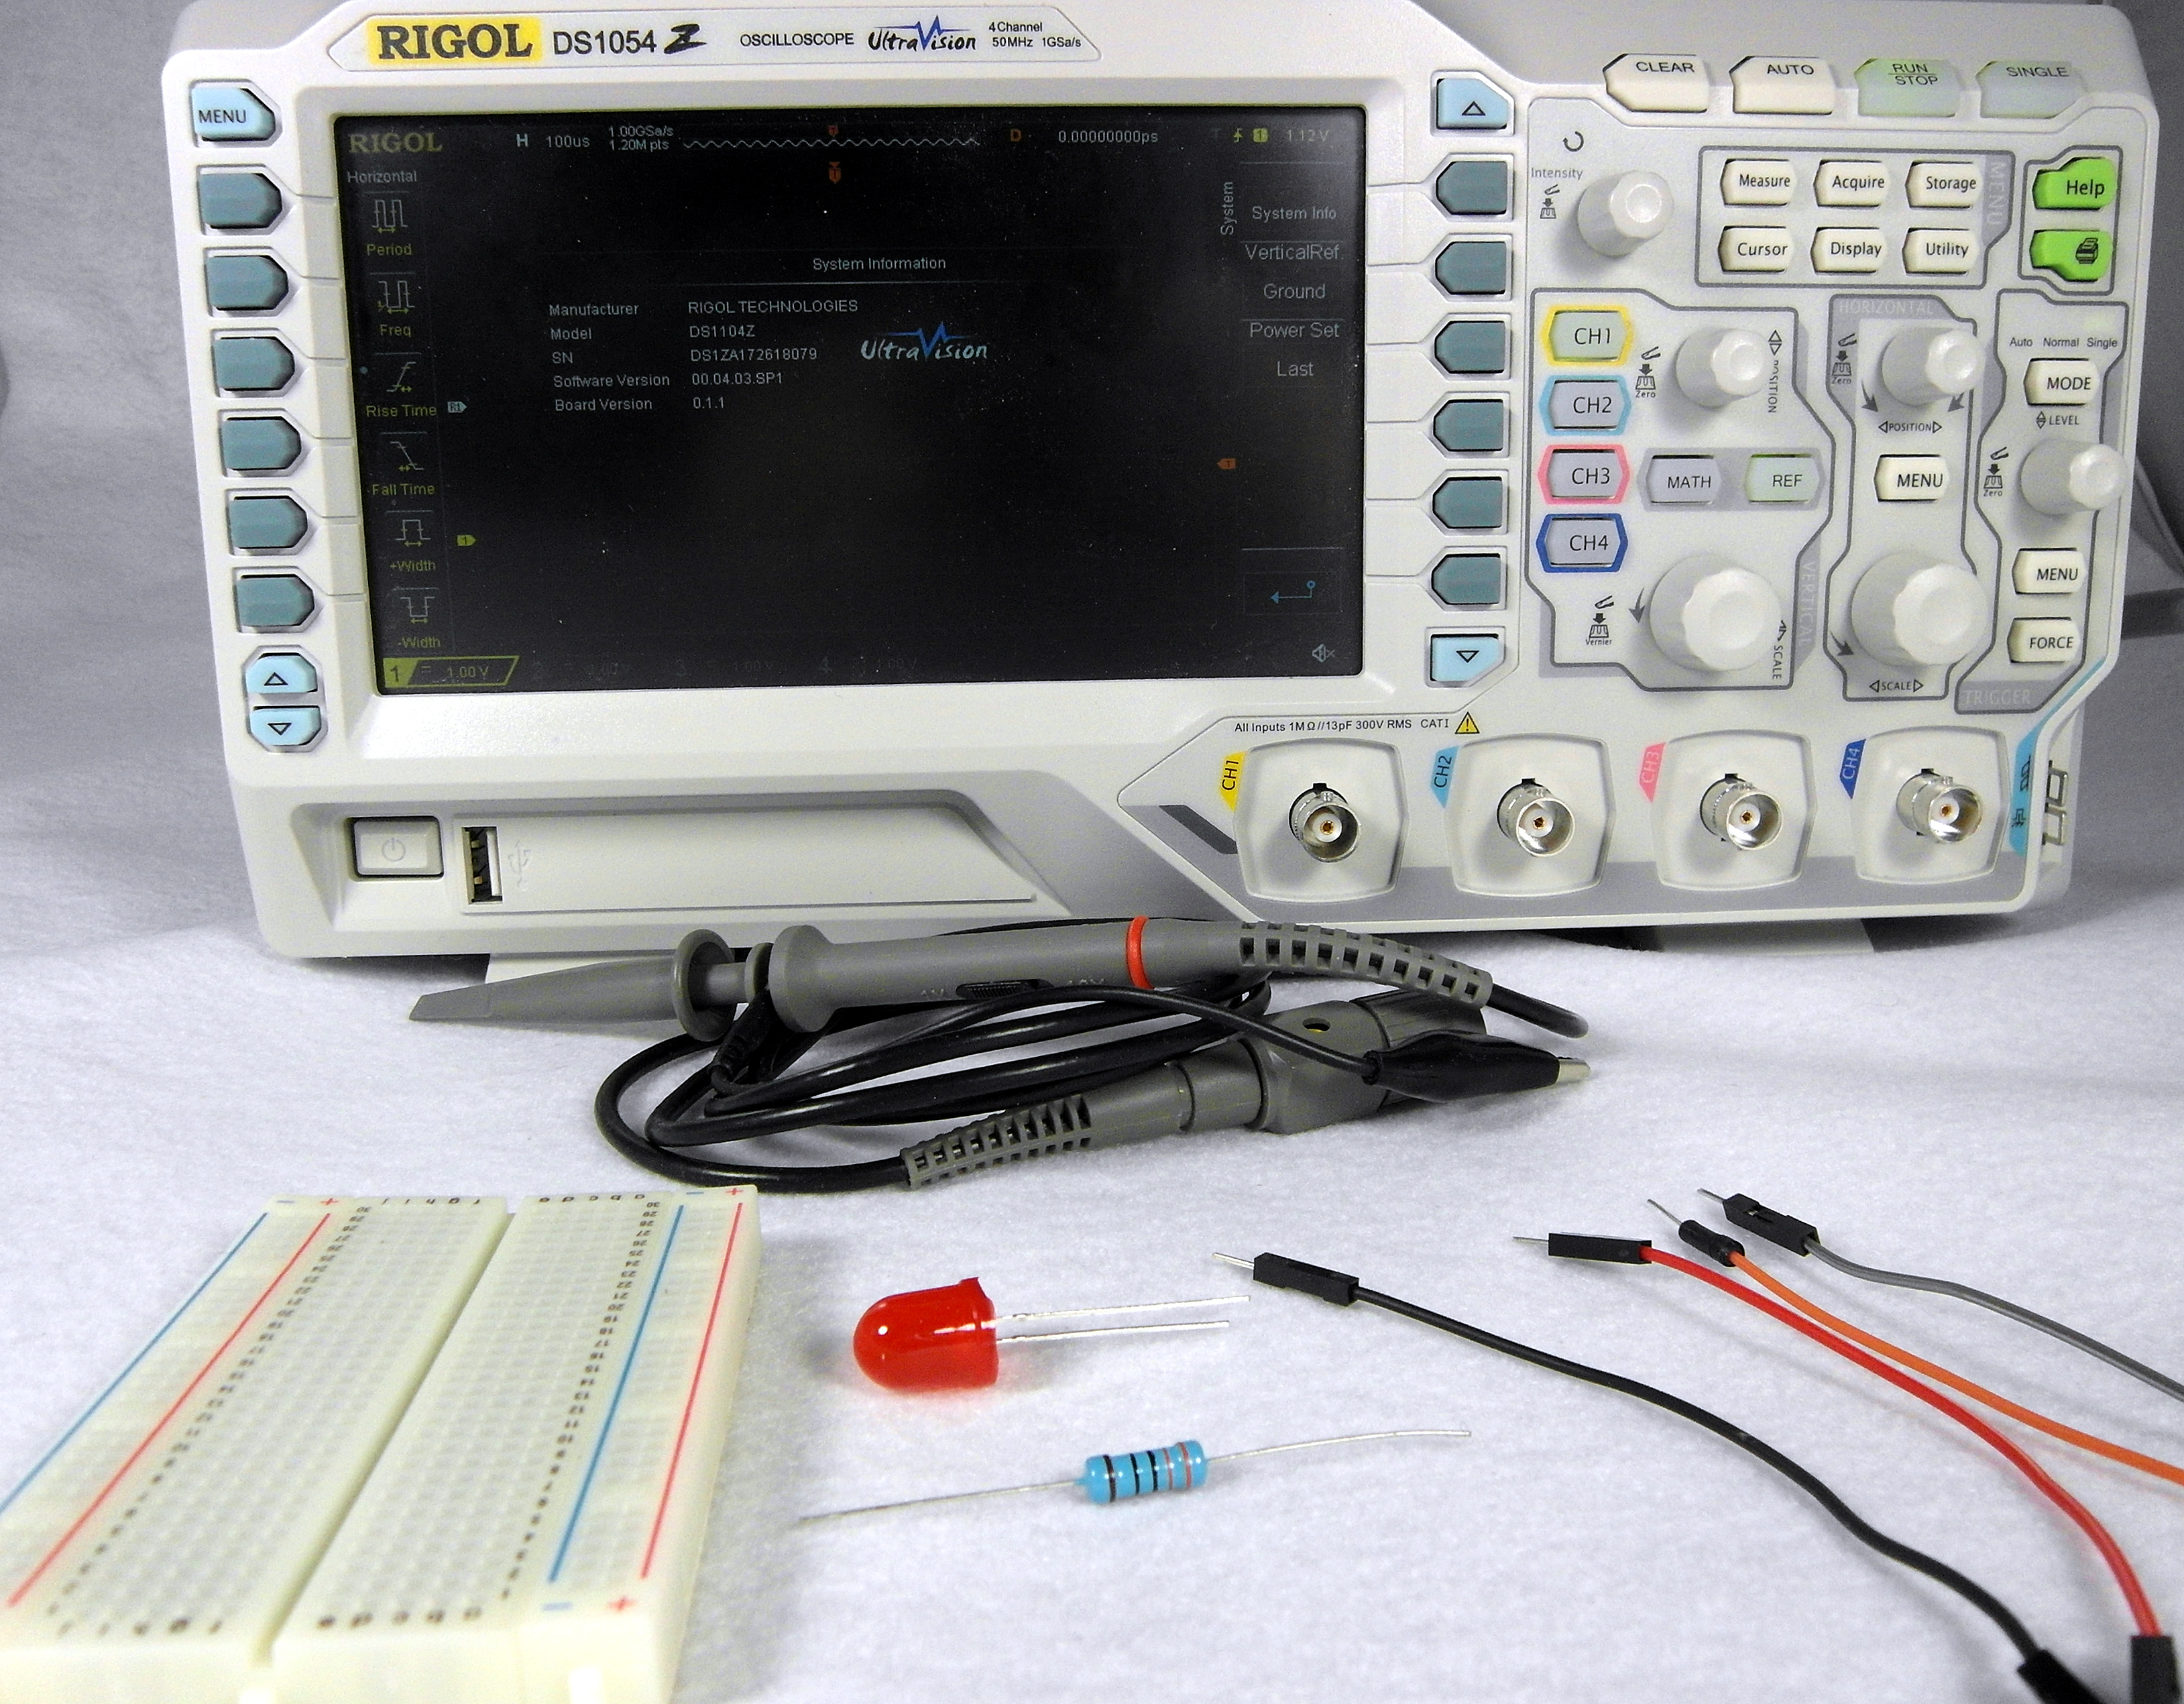
I use a Rigol DS1054Z benchtop oscilloscope upgraded with software to a Rigol DS1104Z. However, almost any digital benchtop oscilloscope should work as well.
The Rigol DS1104Z is a four channel oscilloscope. Alternatively, a single or dual channel oscilloscope will also work to display PWM.
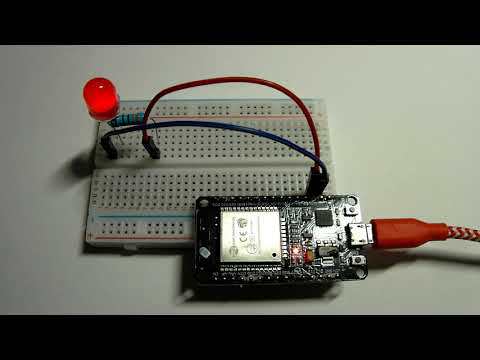
In the examples below, we use PWM to brighten and darken an LED using an ESP32 (an Arduino UNO will also work).
Two examples are used, one with increased step size and delay to provide visible changes in brightness that can be compared to the oscilloscope images.
Supplies
- An oscilloscope (As noted, I used a Rigol DS1054Z upgraded by software to a 1104Z in this Instructable). However, any benchtop oscilloscope will work.
- An oscilloscope probe.
- A 400 hole breadboard
- An LED (I used a 10mm red LED). However, a 3mm, 5mm, 8mm, LED of any color, will also work. Note: the voltage specifications change with size and color. For a 10mm LED, such as I used, the voltage values are shown below for different colors:
Yellow: 1.8 - 2.2 (VDC)
Red: 1.8 - 2.2 (VDC)
Blue: 2.8 - 3.0 (VDC)
Green: 2.8 - 3.0 (VDC)
White: 3.0 - 3.2 (VDC)
Although the actual current depends on the value of the resistor, the current is approximately 20ma.
- A 220 ohm (I used a 1 watt) resistor. Almost any wattage resistor, 1/4 watt or greater, and any resistance from 220 ohm to 560 ohm will work.
- An ESP32 development board (Almost any ESP32 development board will work, as will an Arduino UNO).
- Four male to male Dupont jumper wires (any size 10 cm in length or longer will work.).
Calibrating Our Oscilloscope Probe
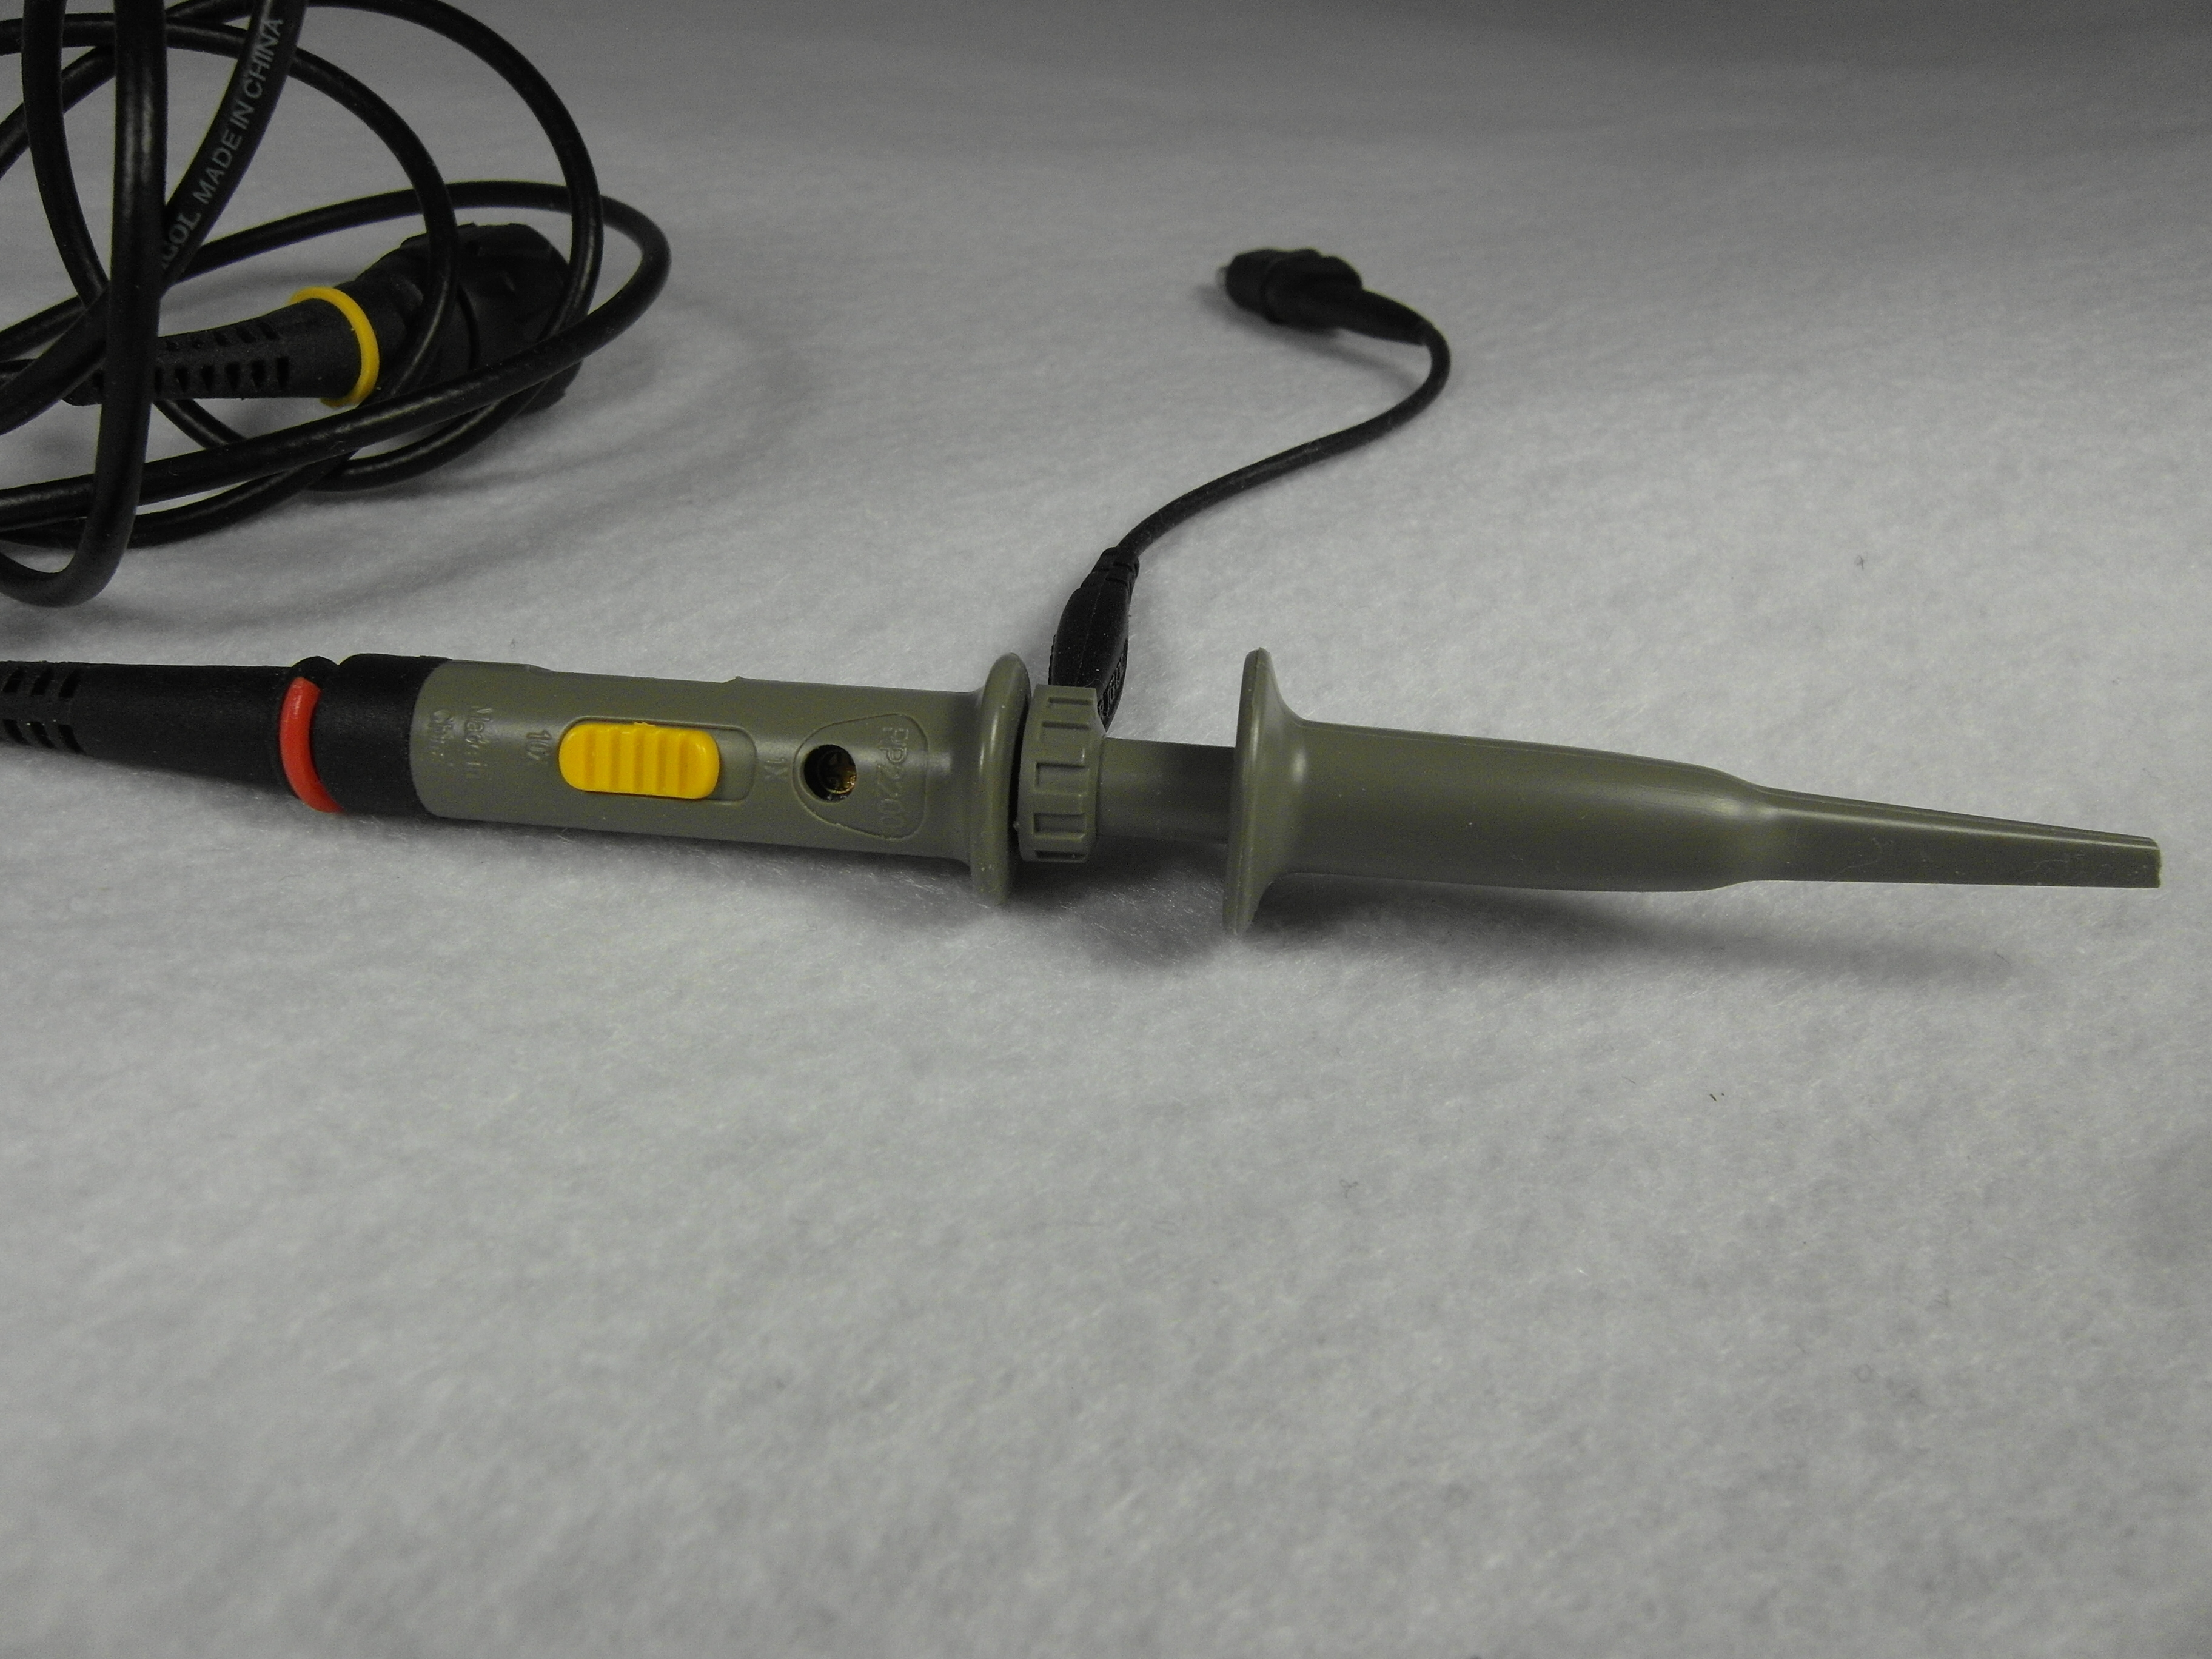
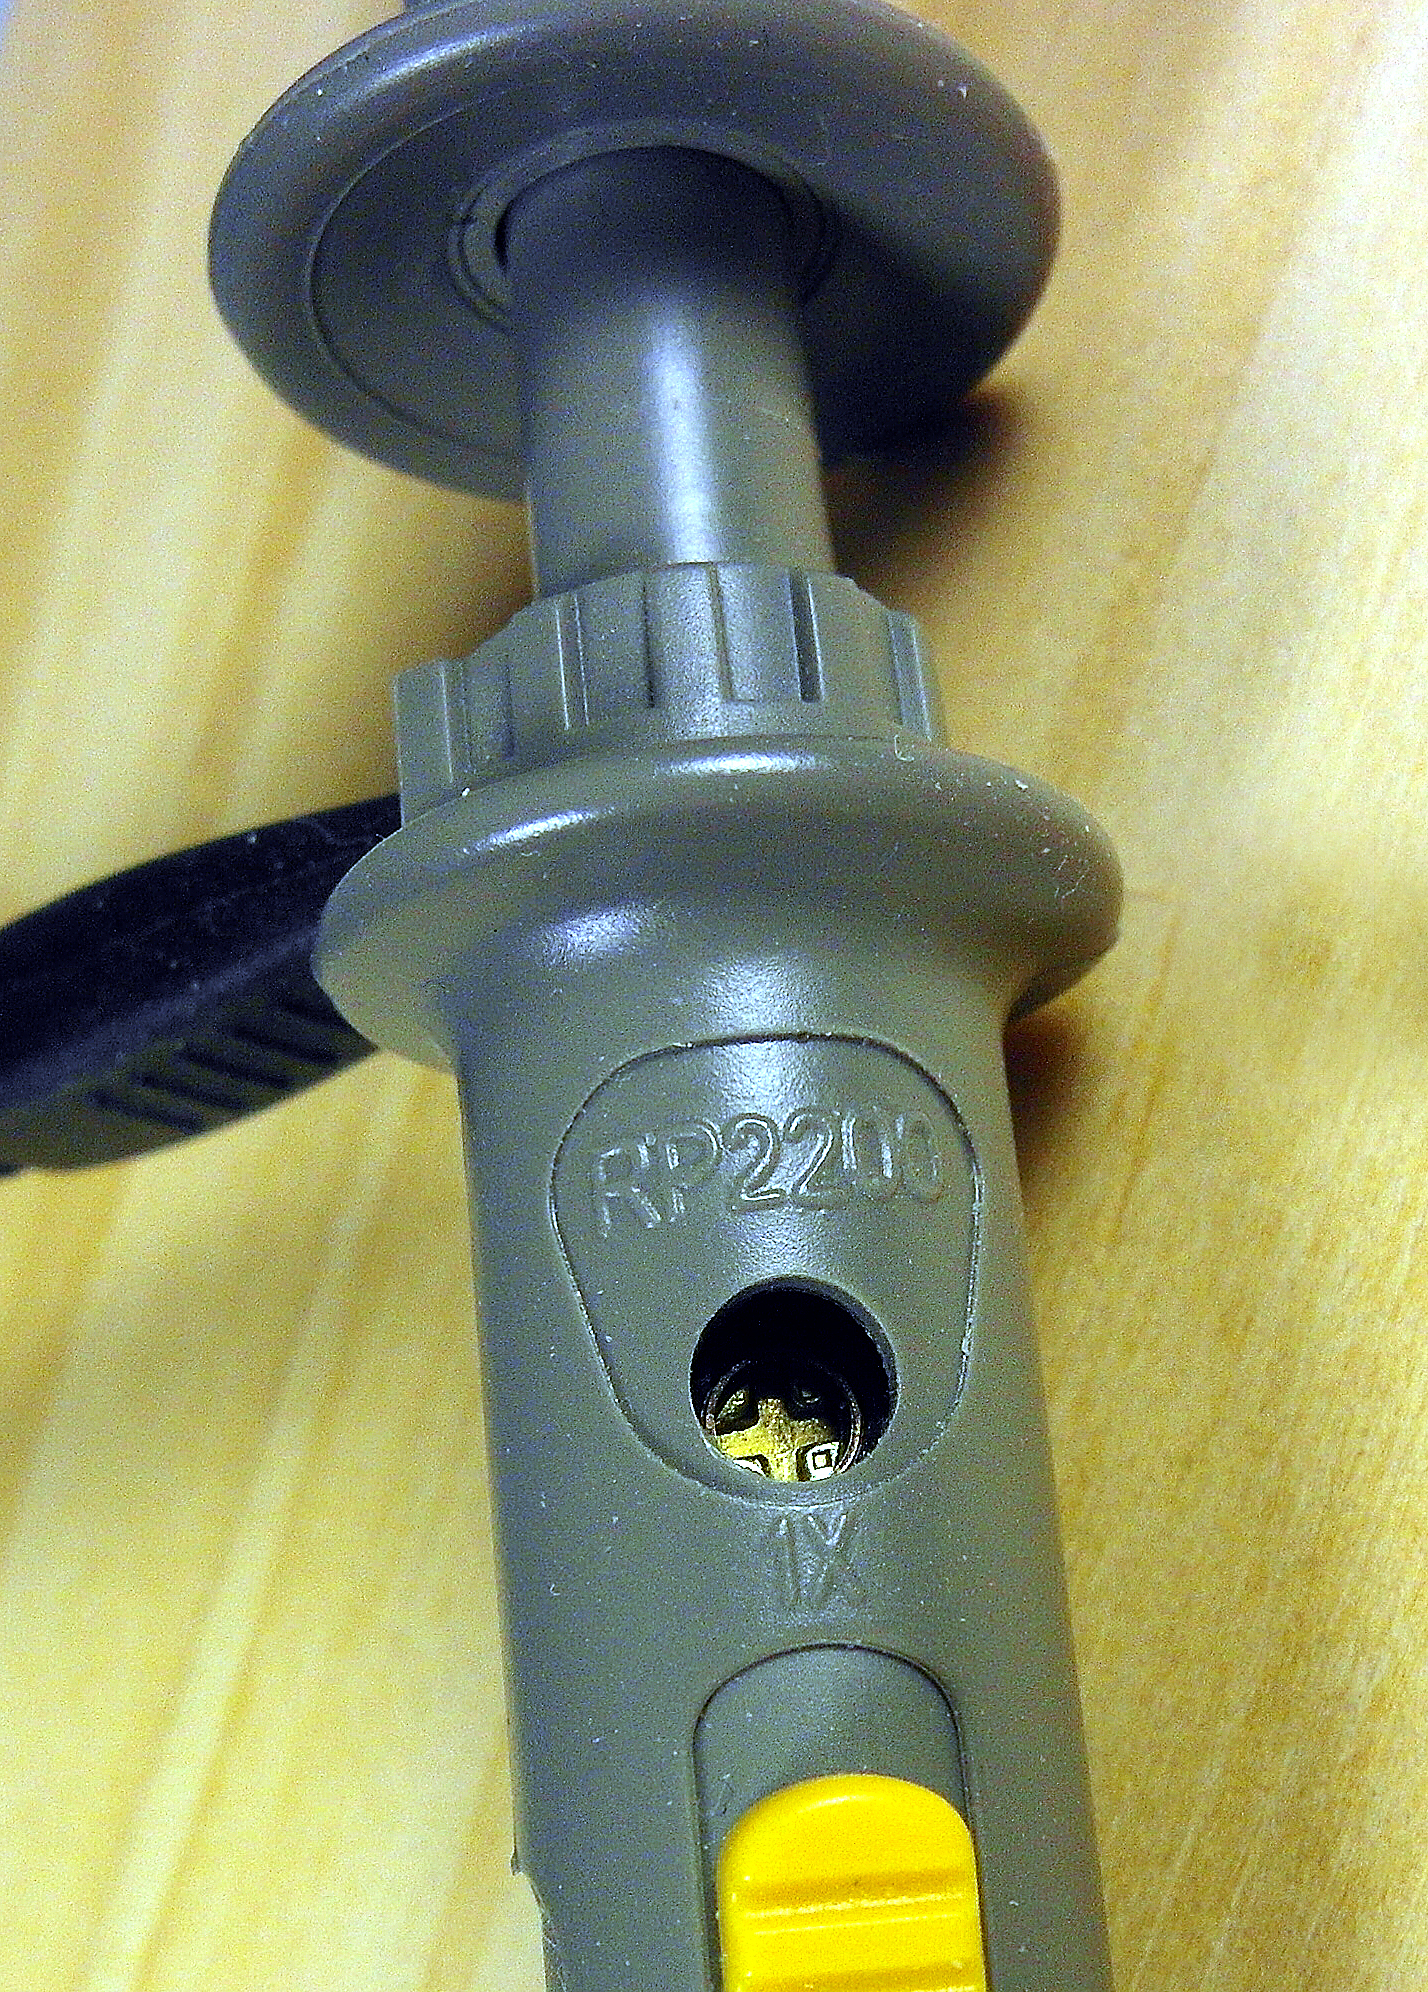
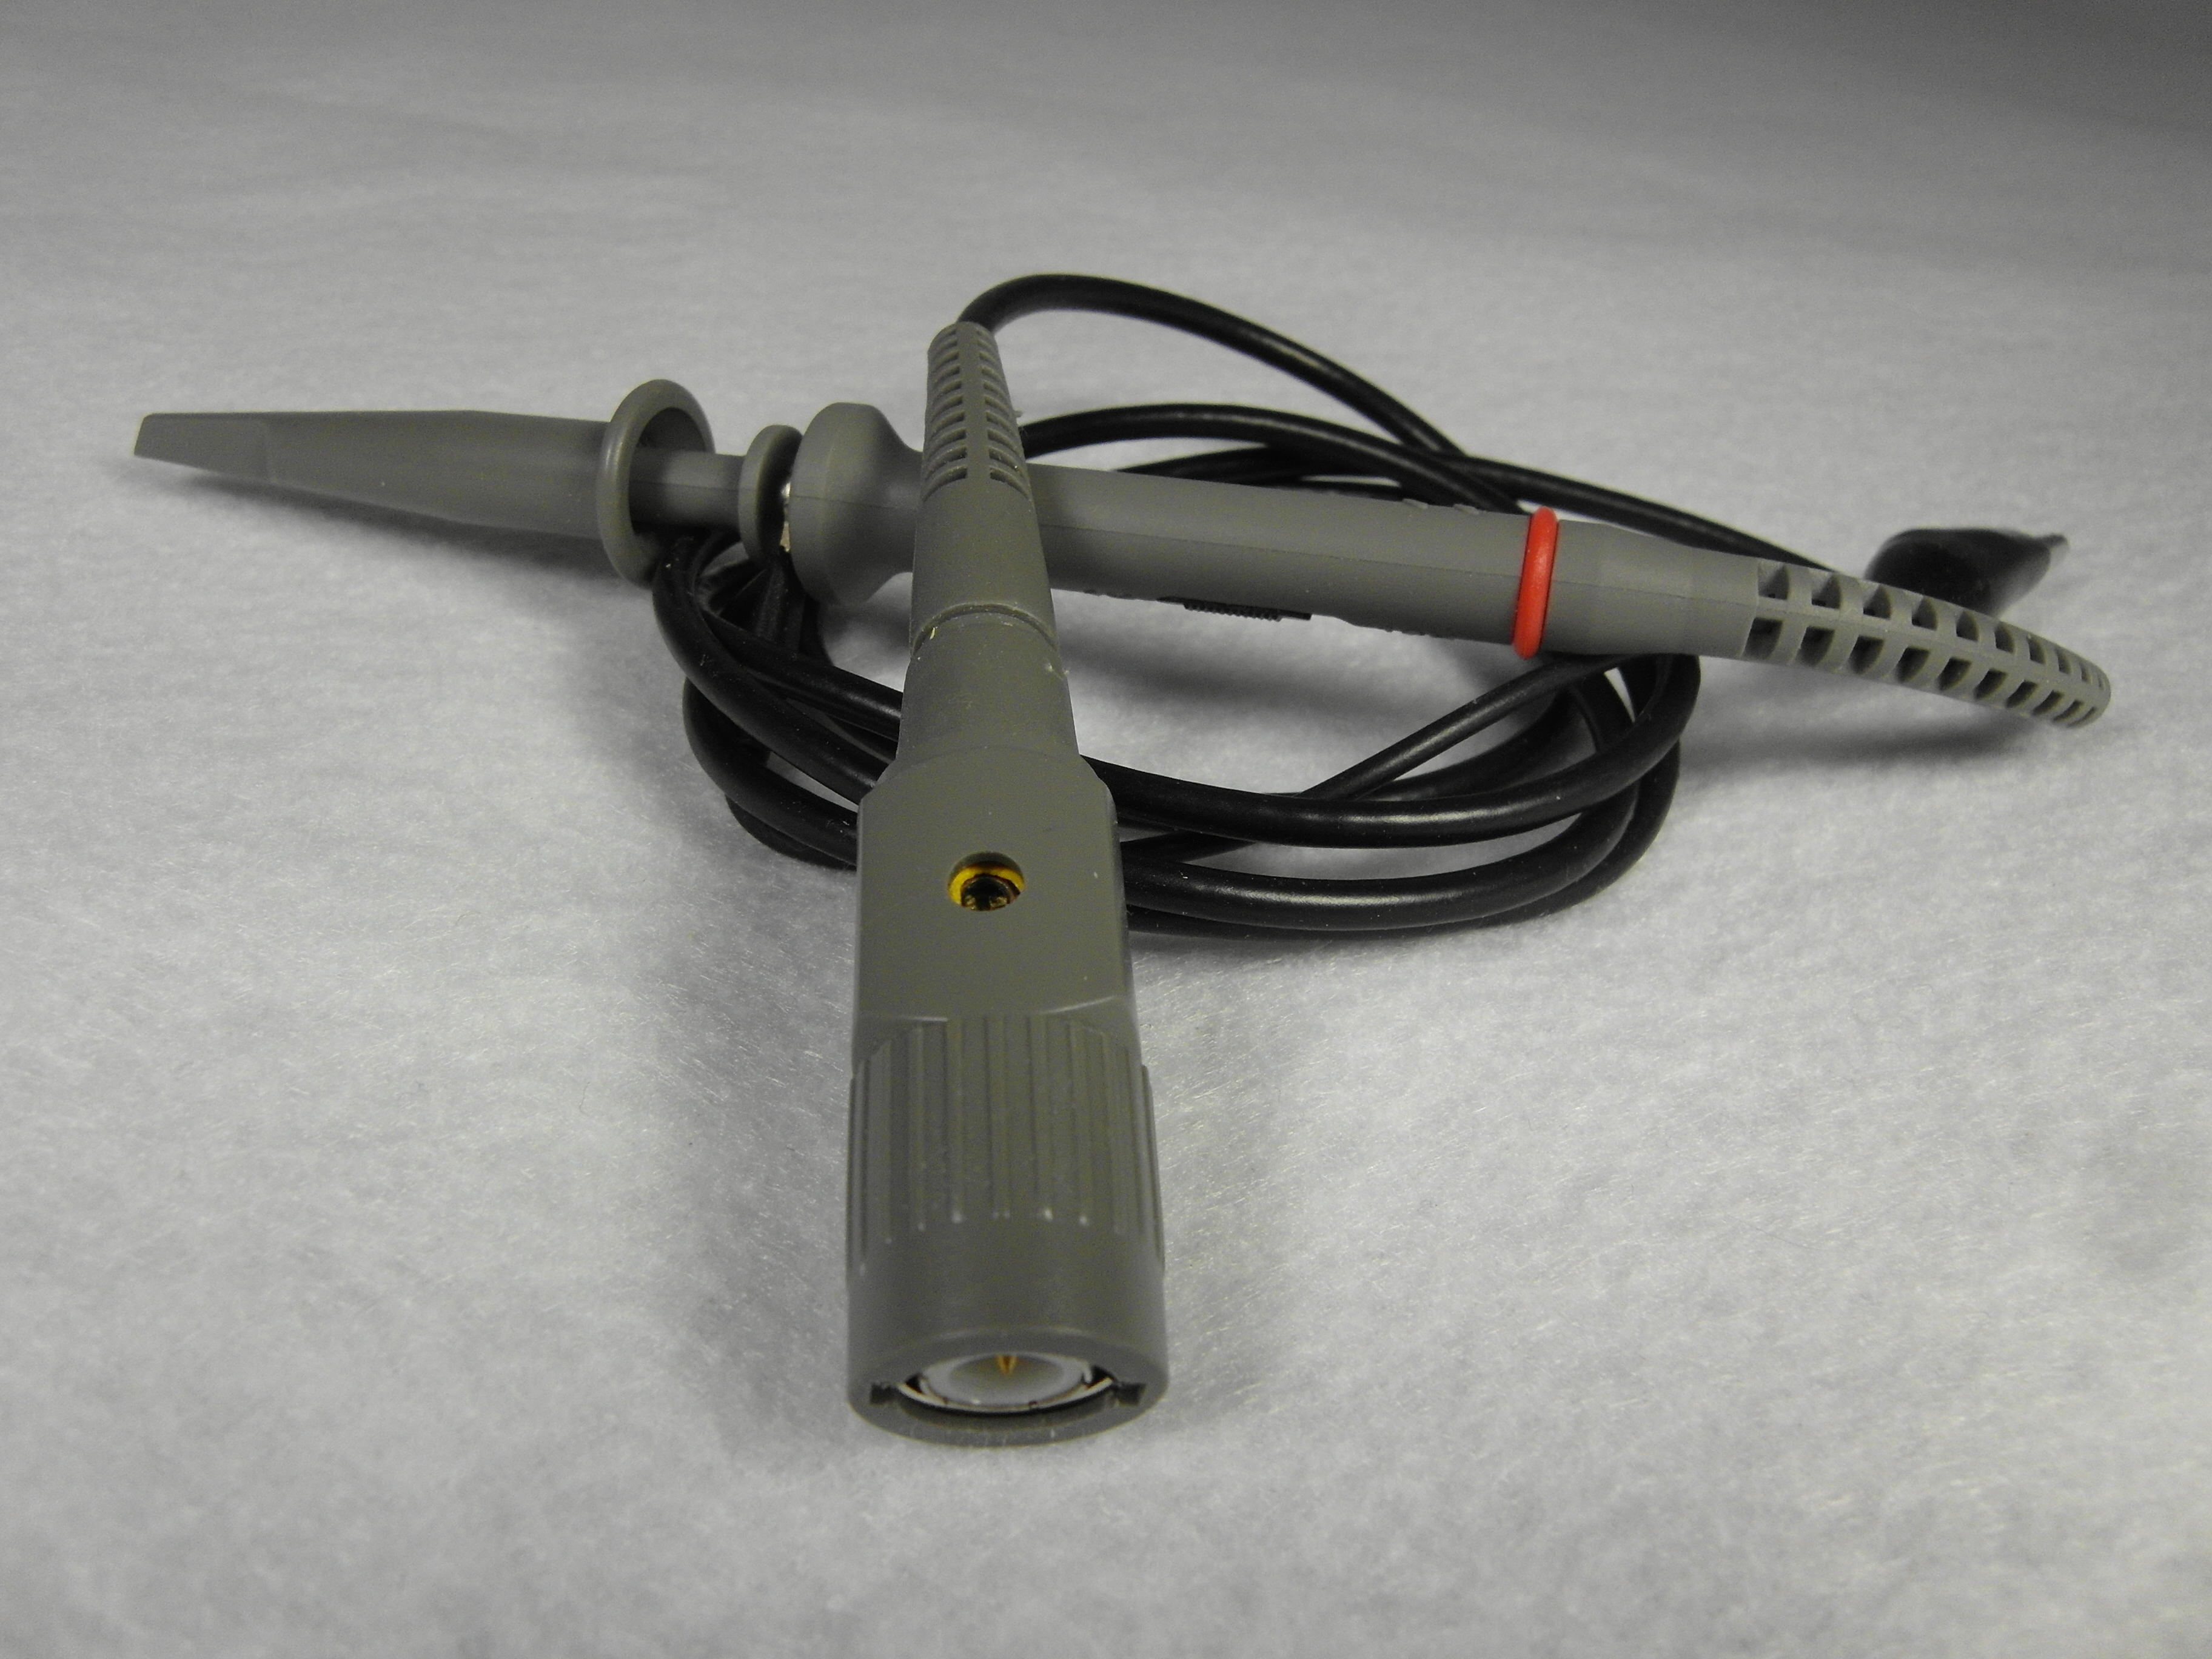
Before we start we need to calibrate our oscilloscope probe(s).
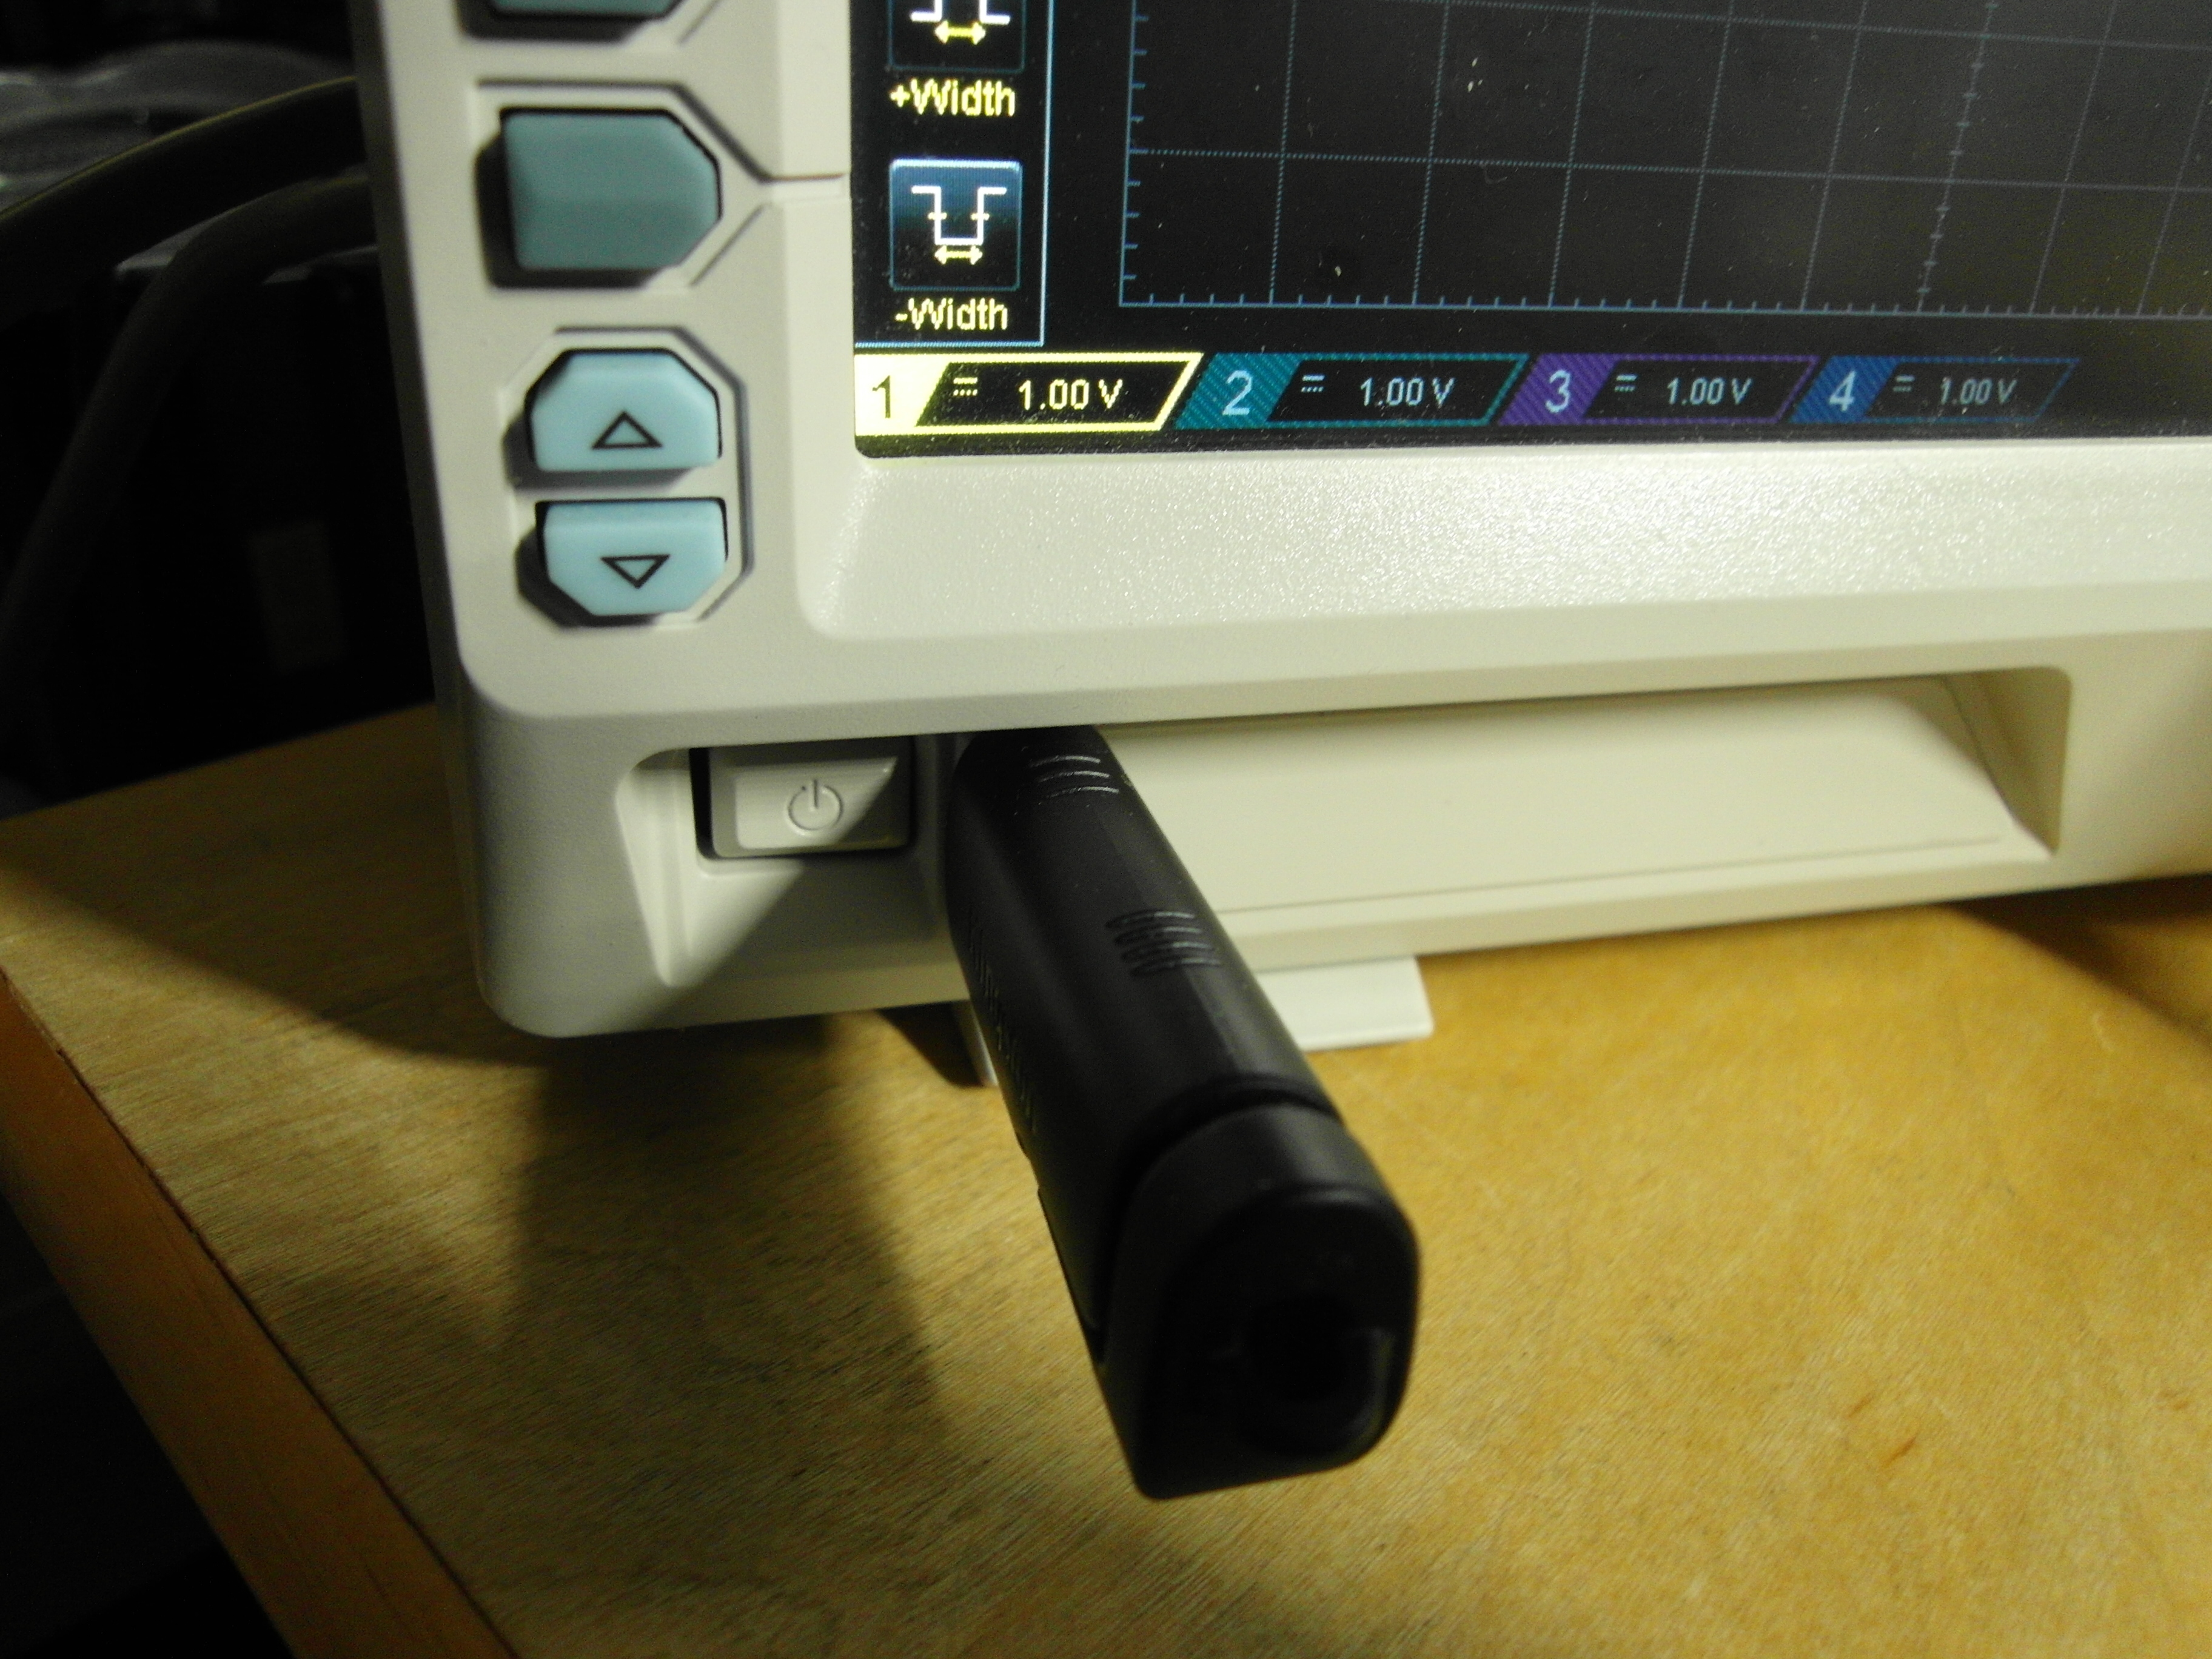
This is done using the calibration screw on the probe. This screw is usually located either on the distal end of the probe itself or at the proximal end, near it's BNC connector, i.e., the attachment to the oscilloscope (see attached photographs).
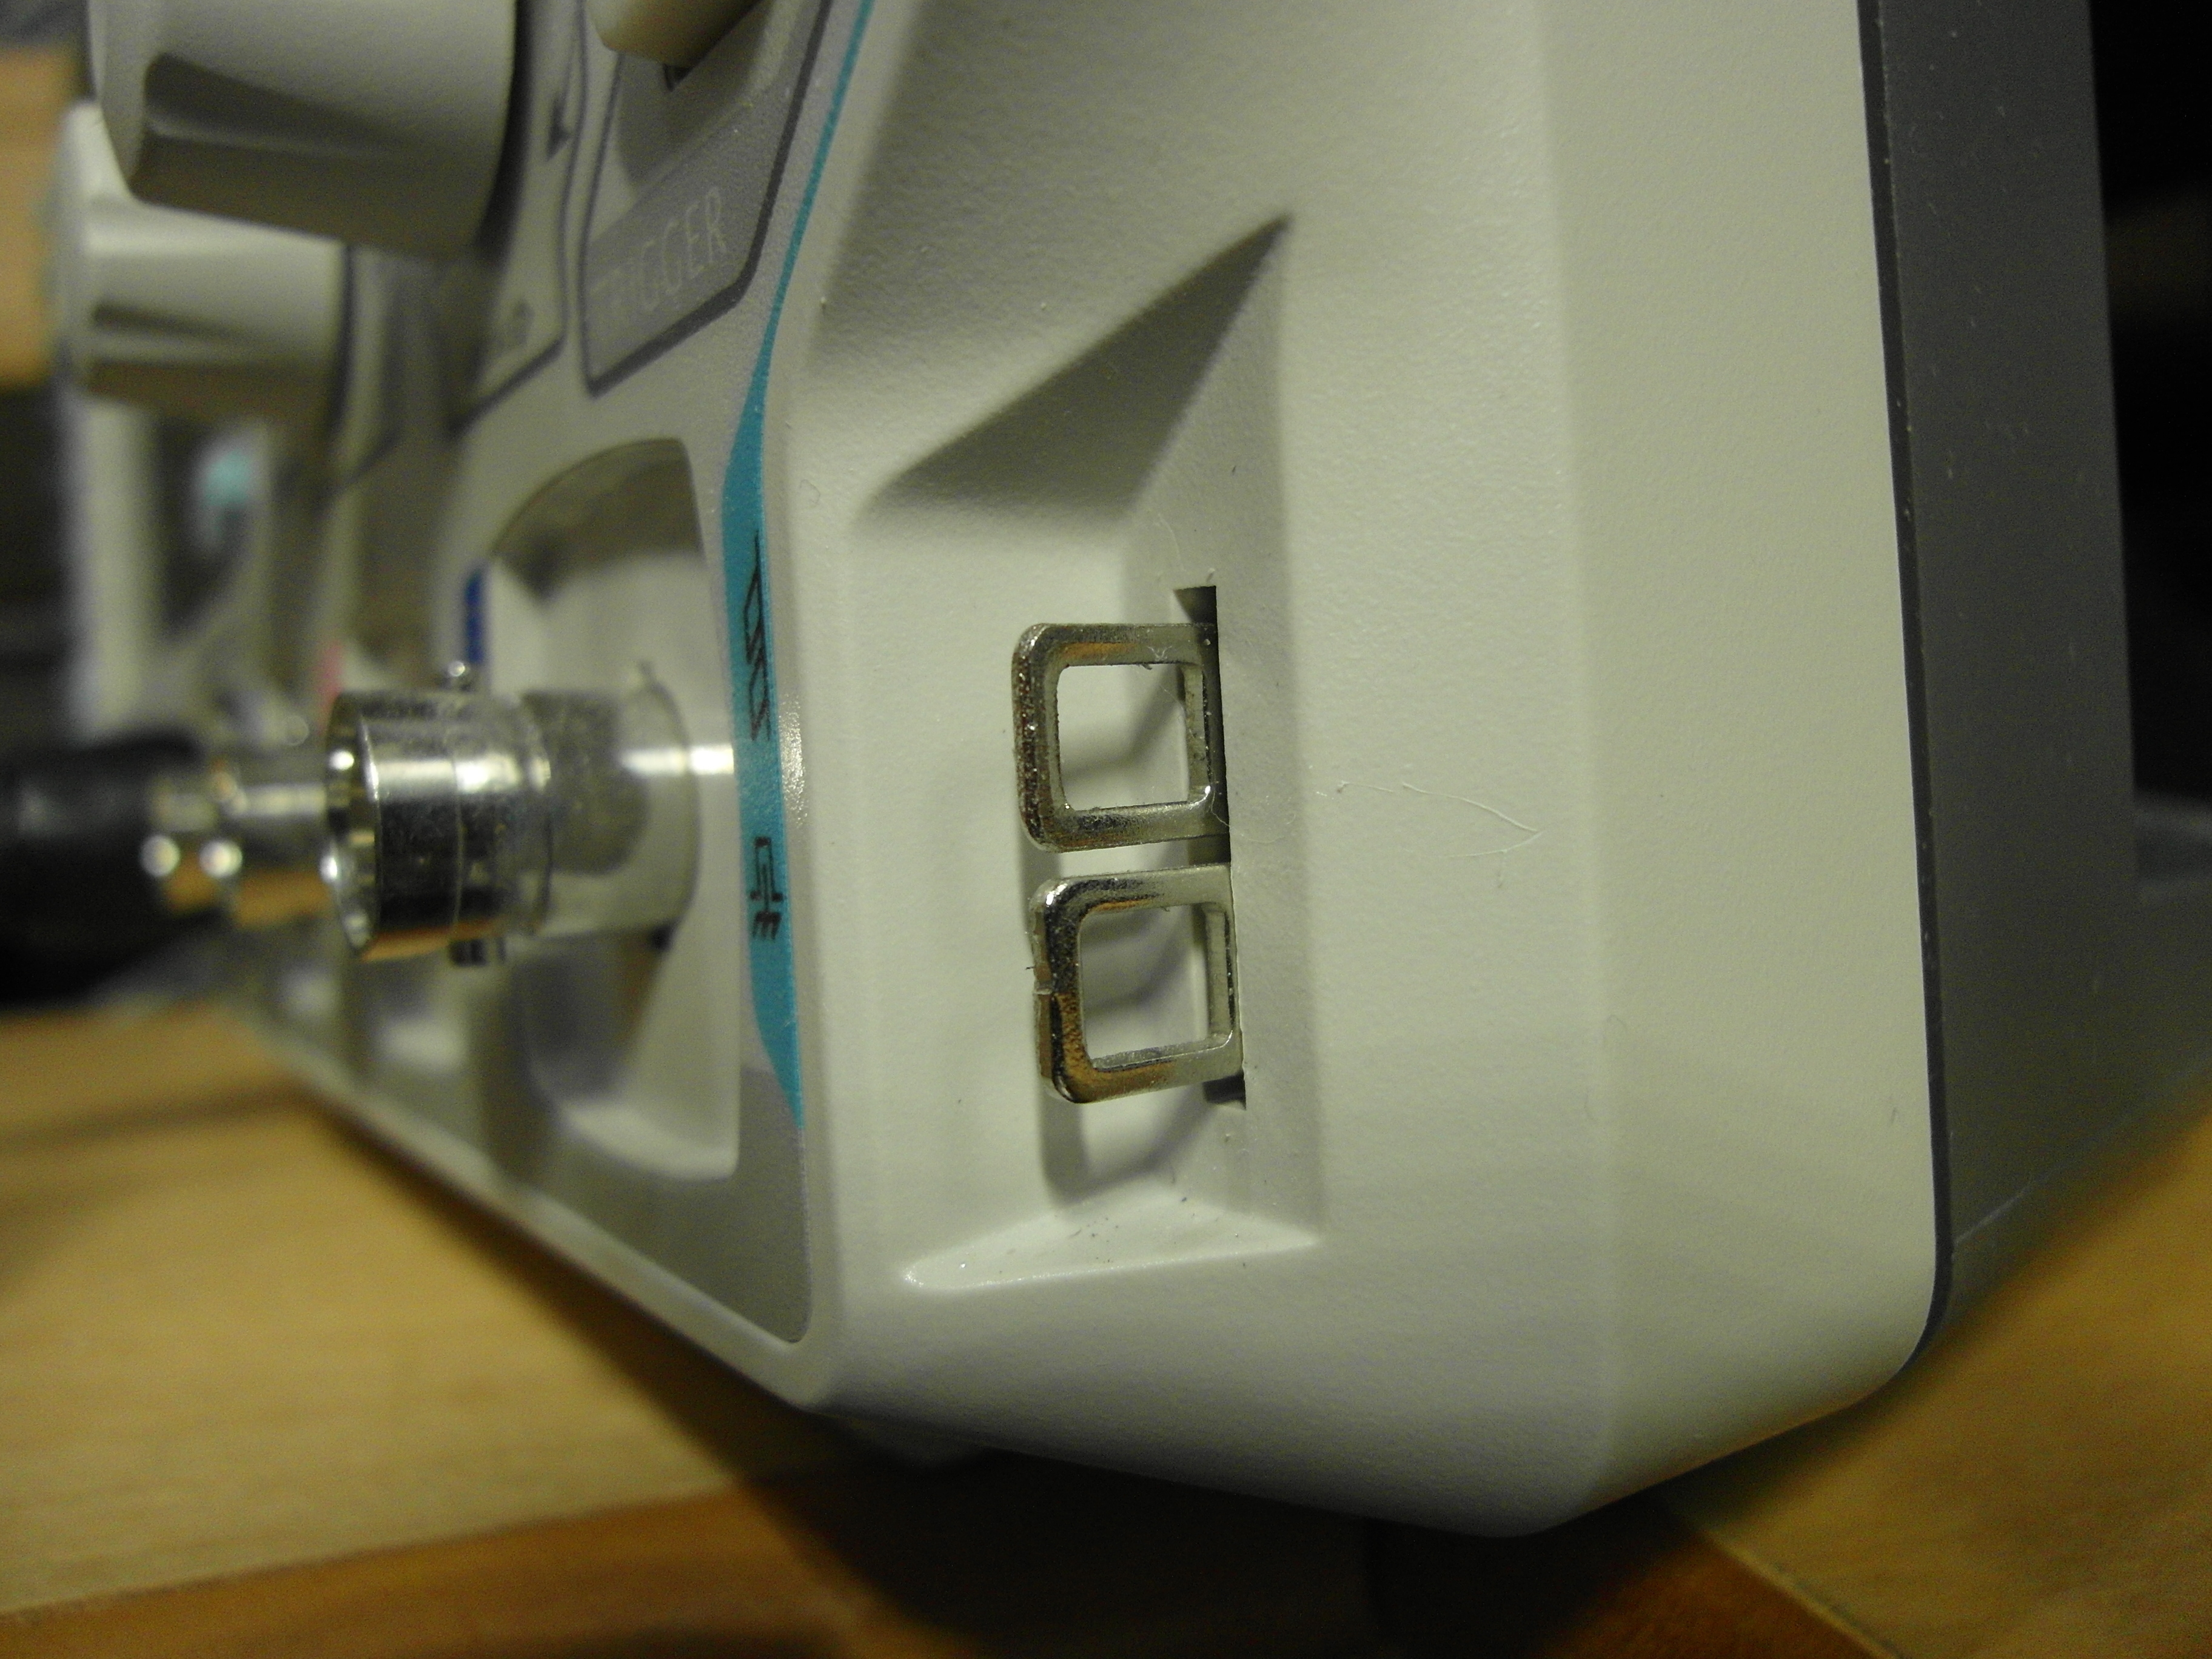
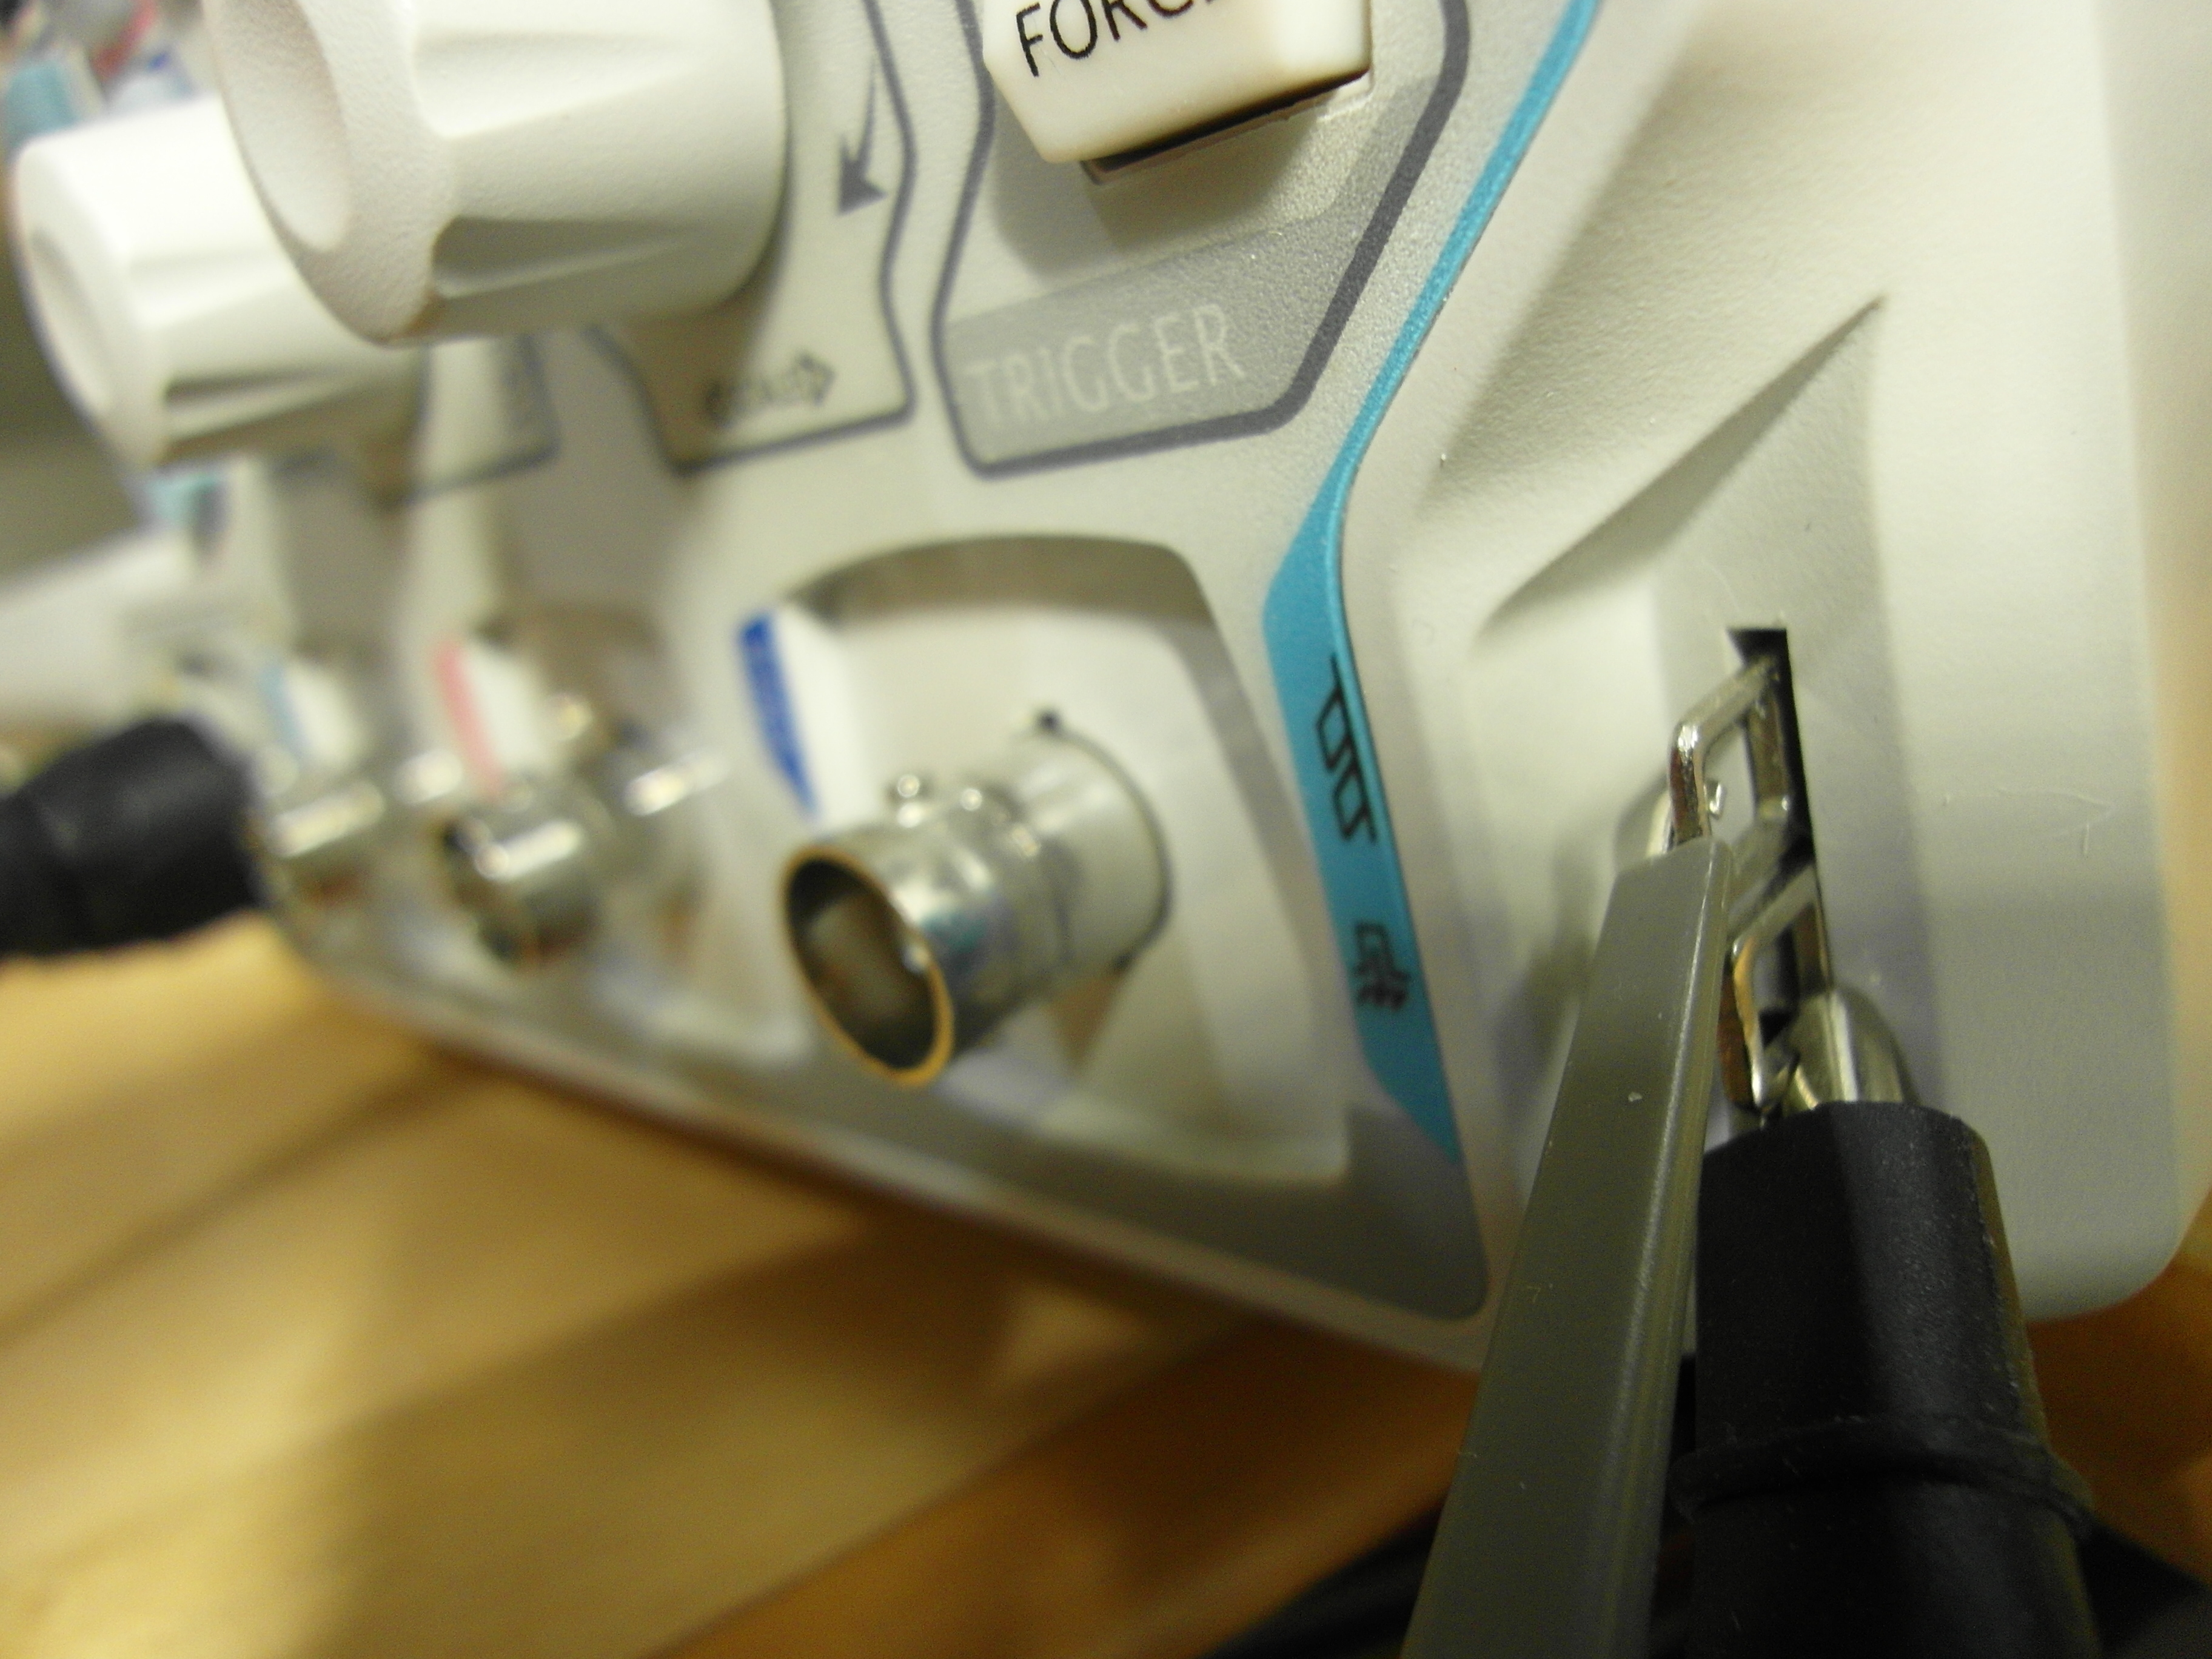
A sawtooth reference generator can be found at the bottom right (two flat metal connectors with central square holes) on the Rigol oscilloscope used in this Instructable.
A test calibration generator is usually included with all benchtop oscilloscopes, and may appear in a slightly different form, i.e., not as metal plates, than the one used in this Instructable. However, there is almost always a sawtooth reference signal generator on benchtop oscilloscopes.
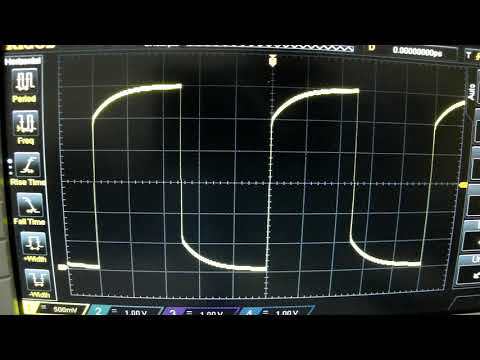
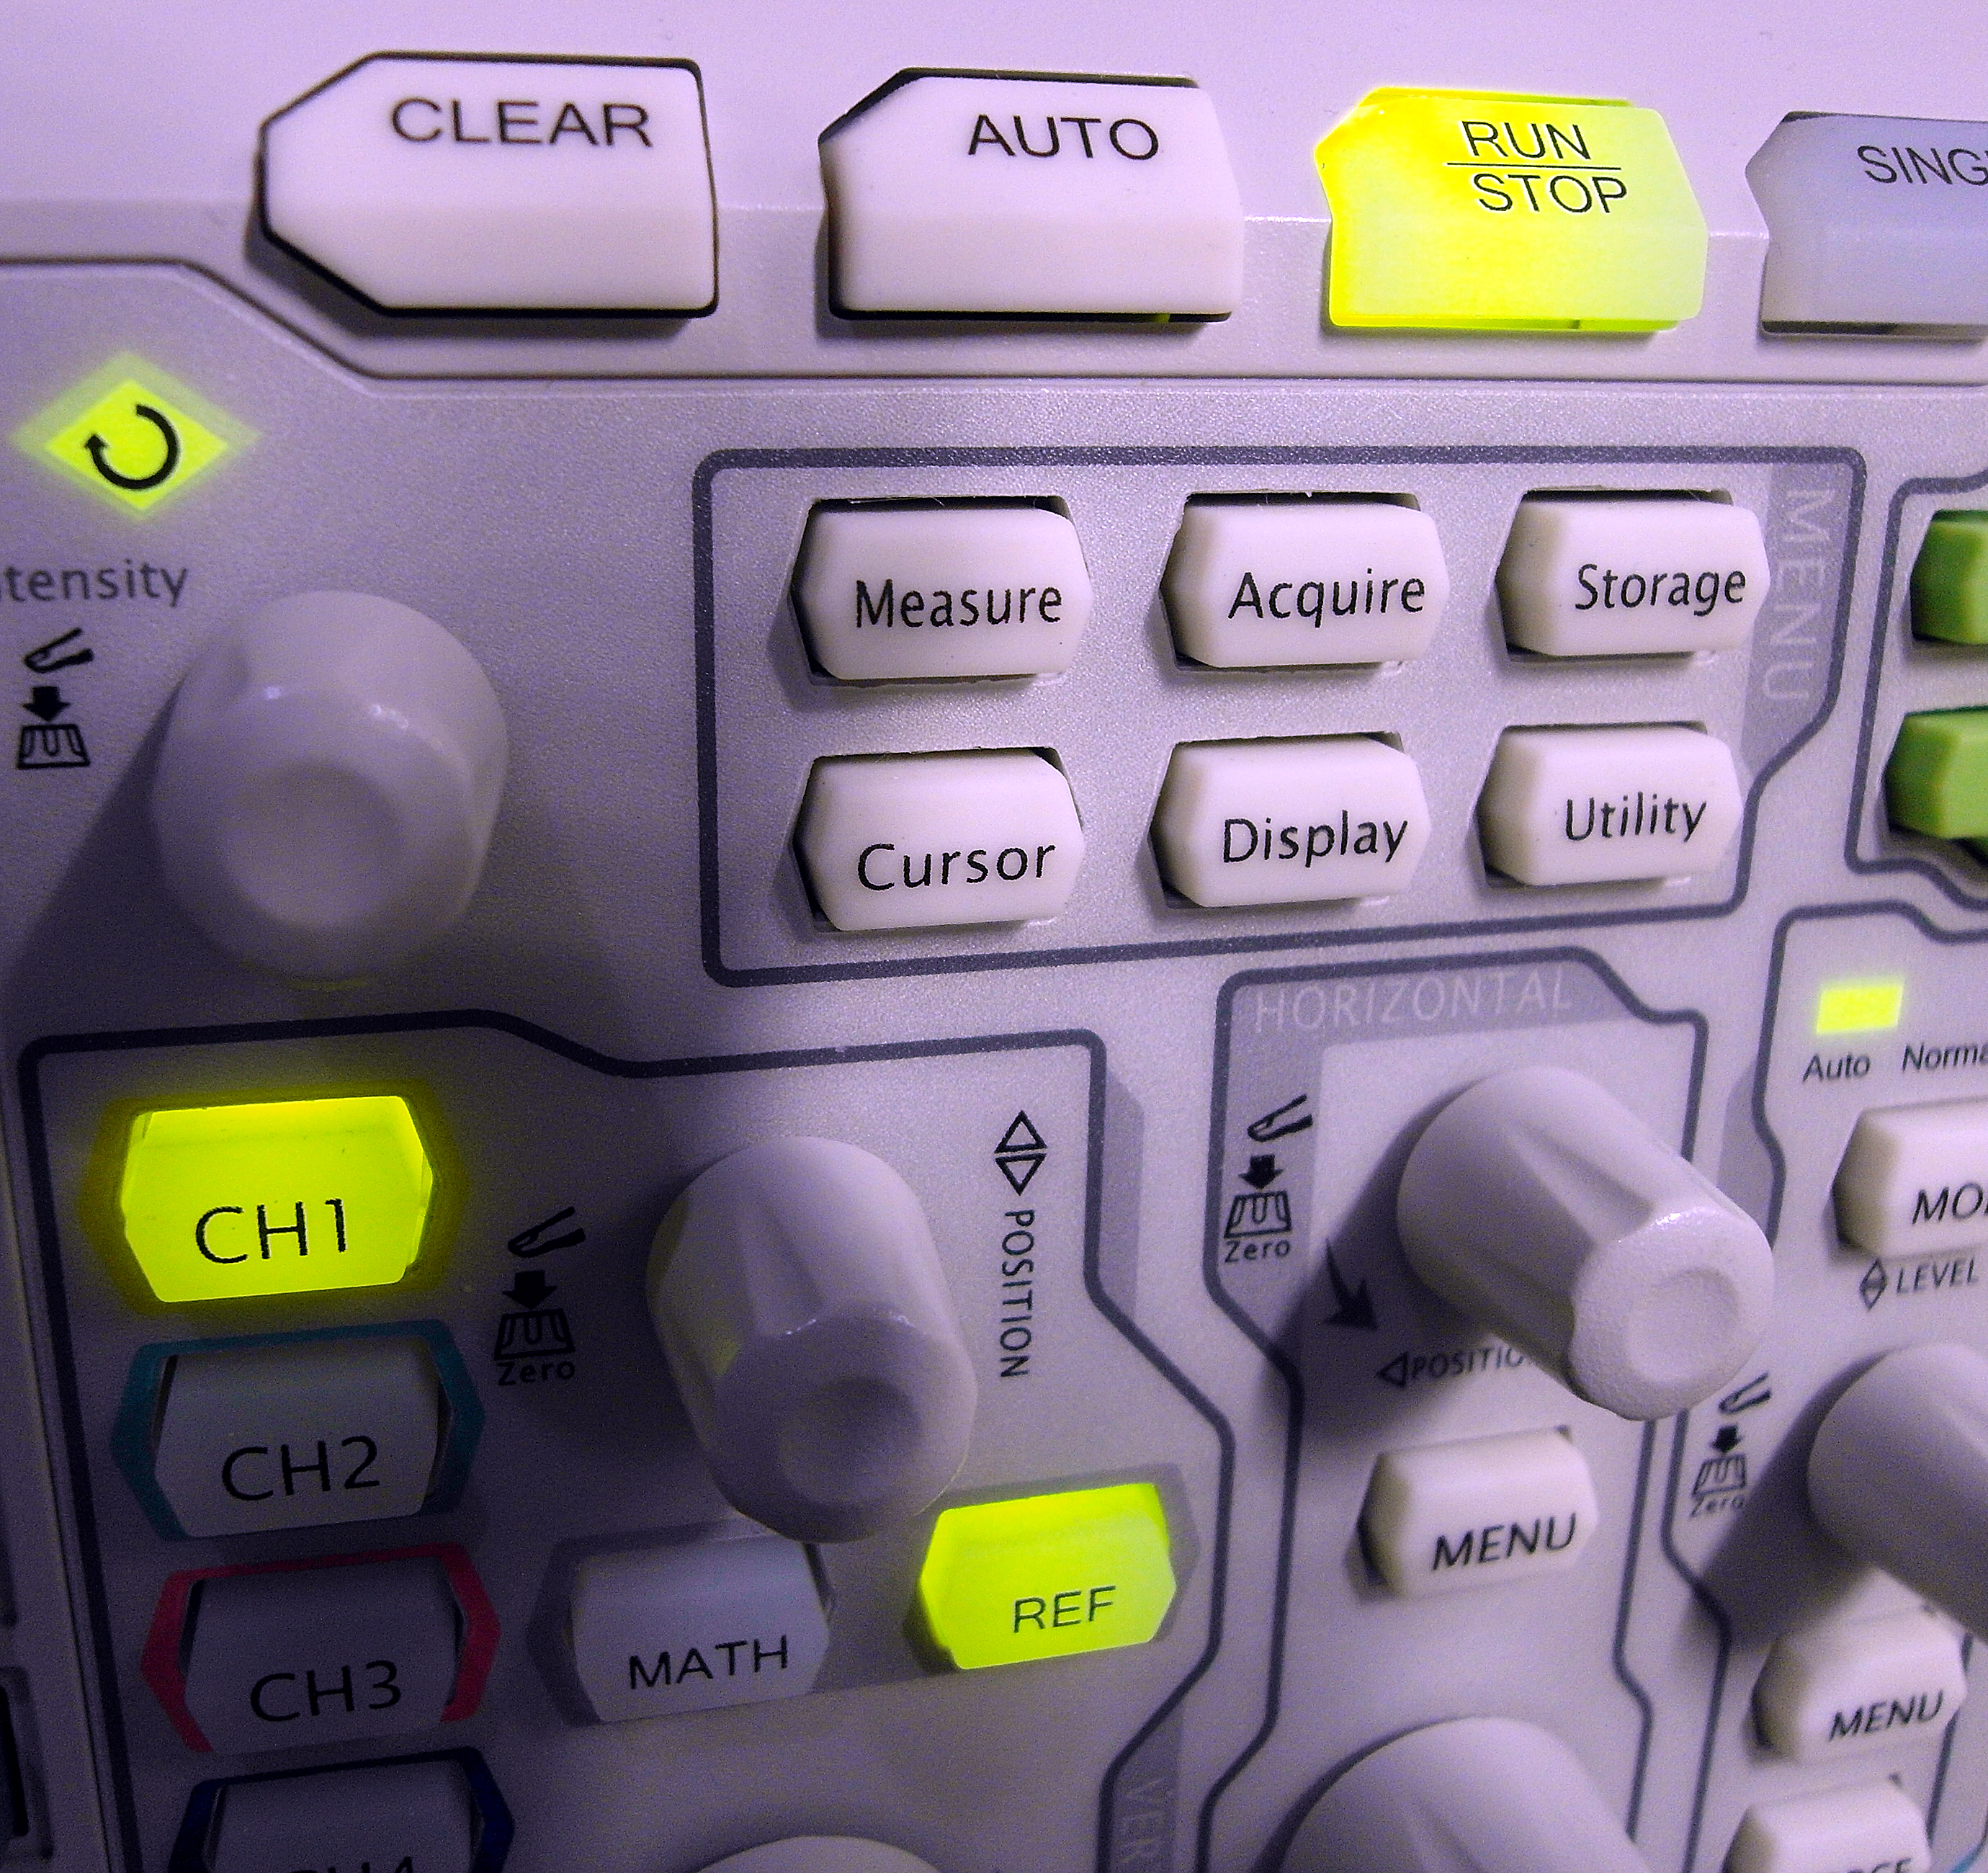
One may want to press "Auto" on your oscilloscope if the square wave does not show, or is shown only partially.
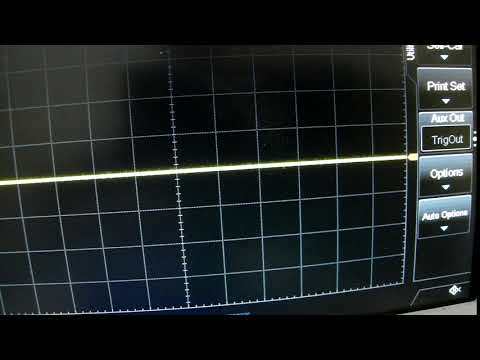
The goal is to use the built in square wave generator to get the sawtooth wave shown as "flat" as possible without any curves up or down (see attached video).
When this is completed, the adjusted/calibrated probe is ready to use.
However, we should calibrate the oscilloscope itself, before it is used (see next step).
Calibrating Our Oscilloscope
Before we use the oscilloscope it it an excellent idea to calibrate it, with its own internal calibrator.
Before we use the calibrator we should leave the oscilloscope on for 30 minutes or so to insure that all components are adequately "warmed" up.
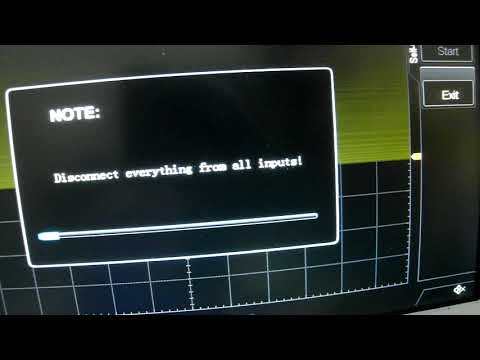
We should also disconnect all inputs to the oscilloscope.
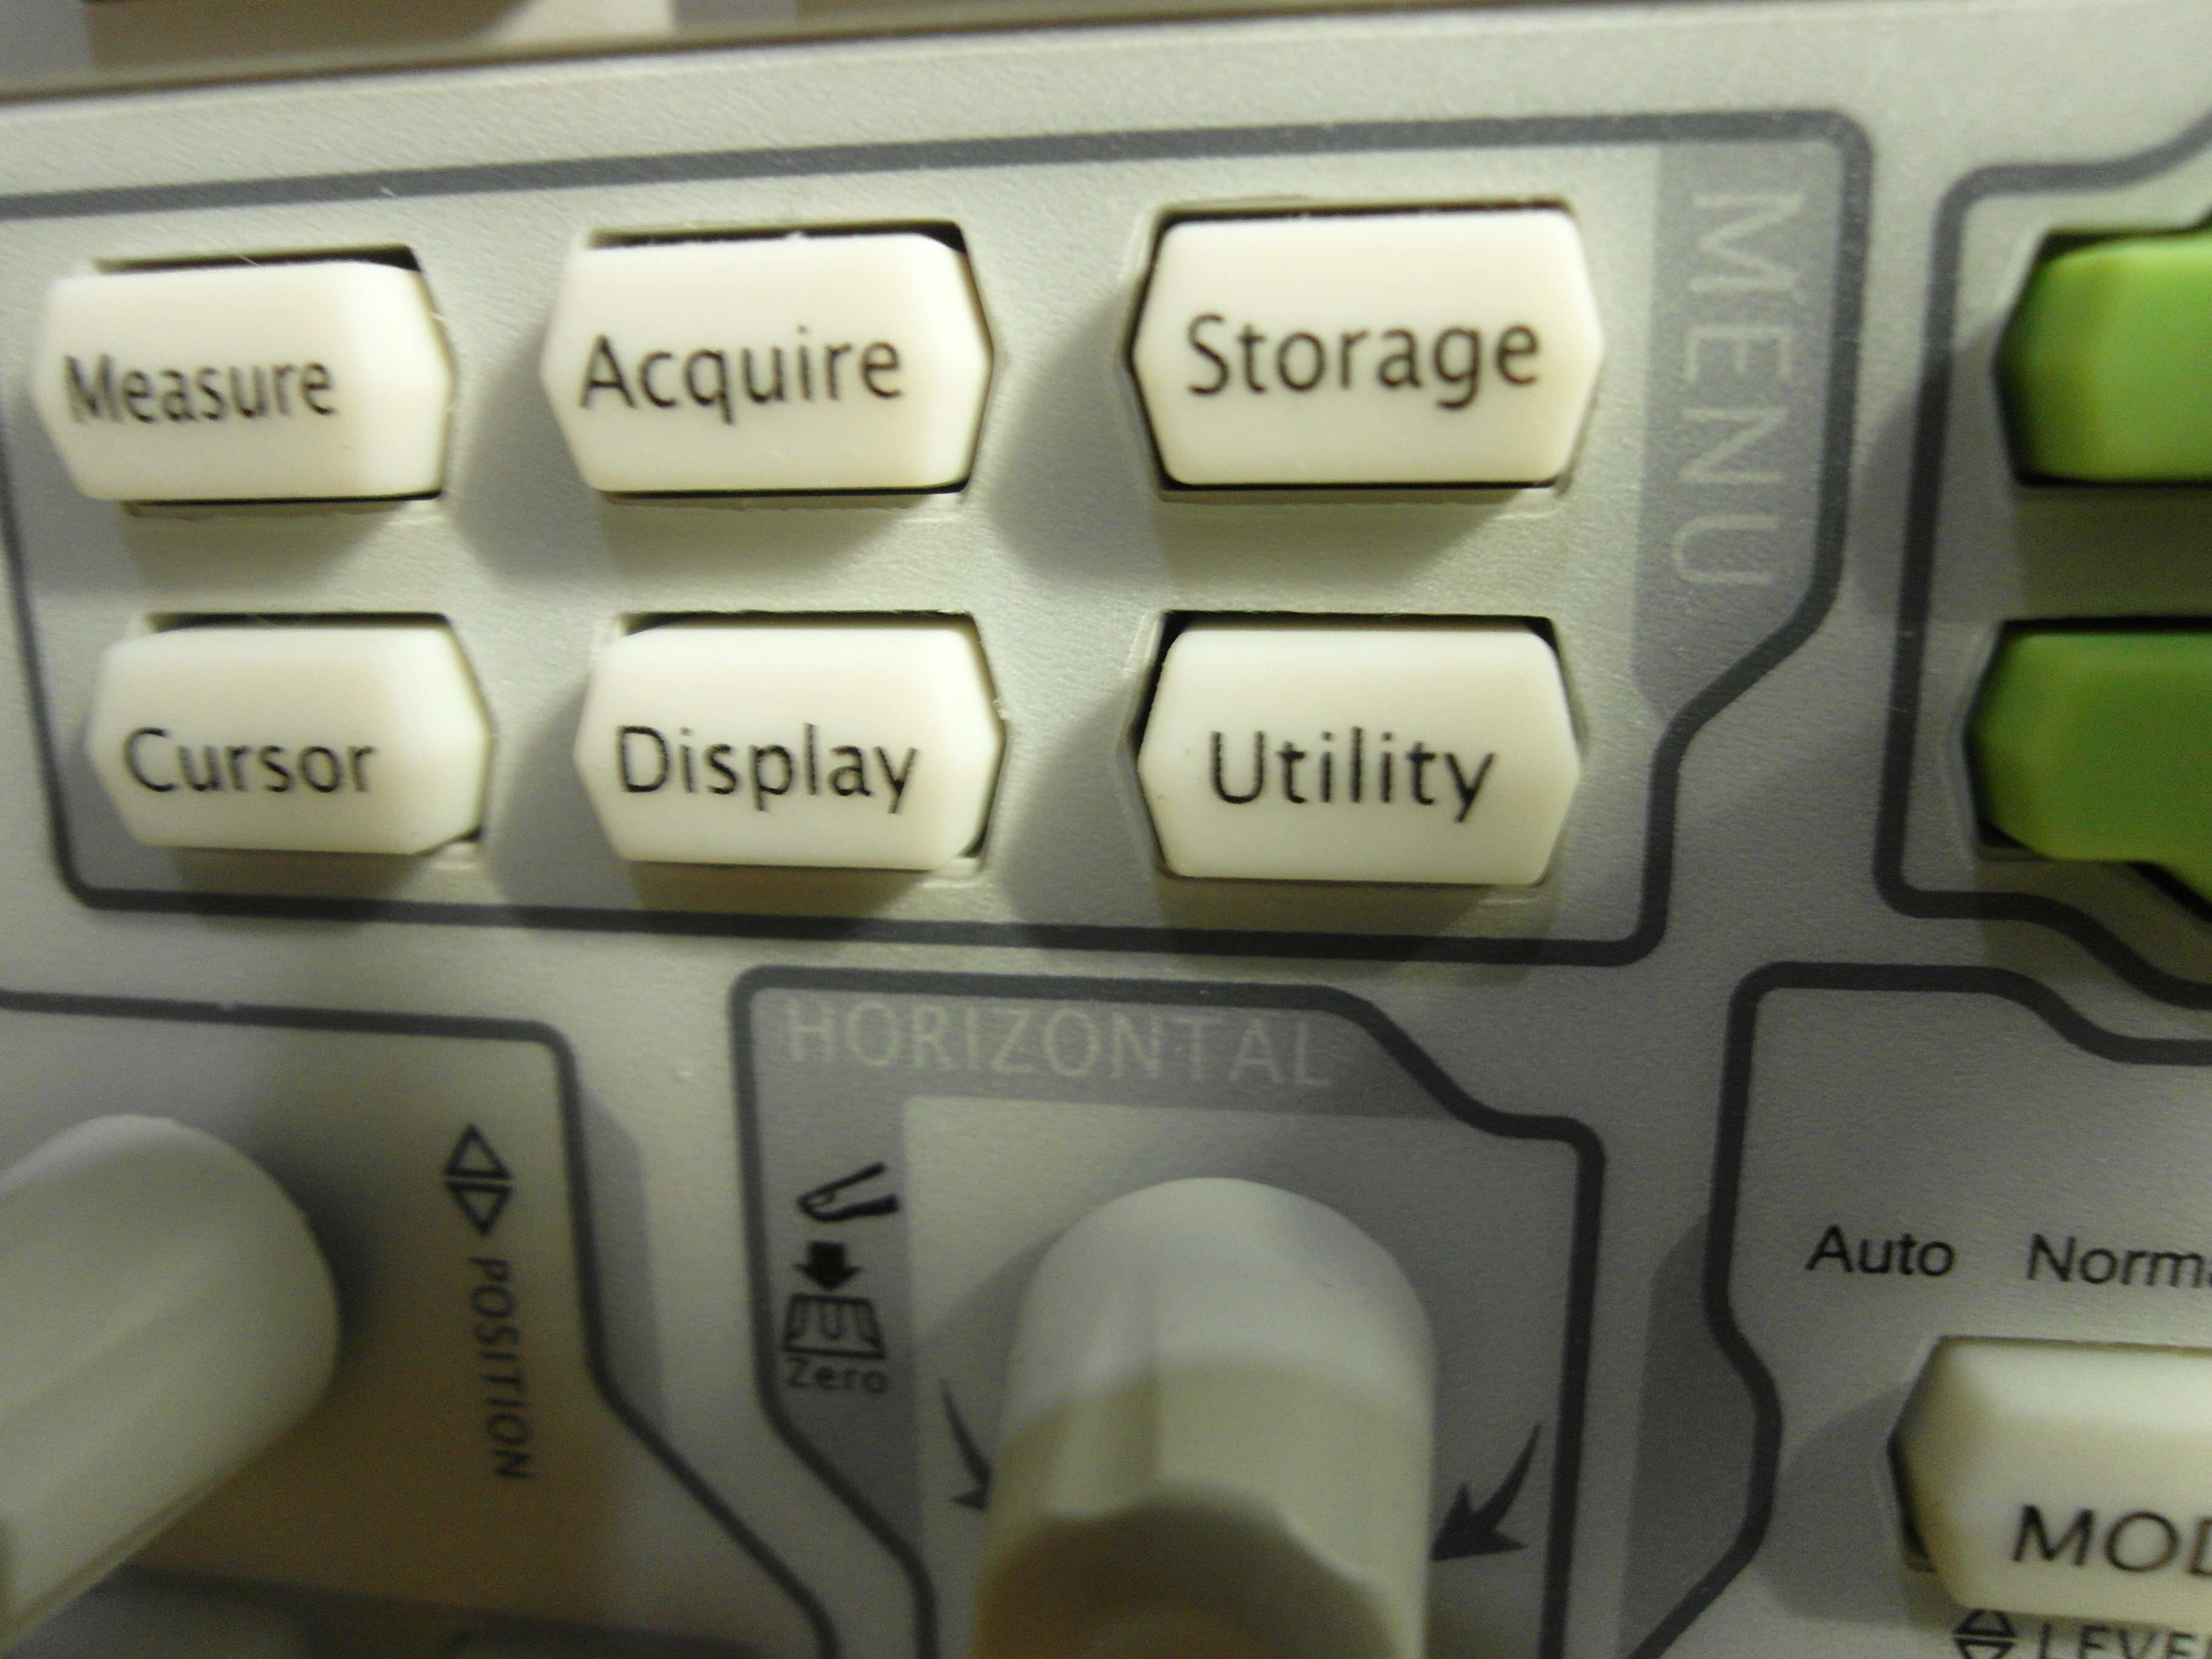
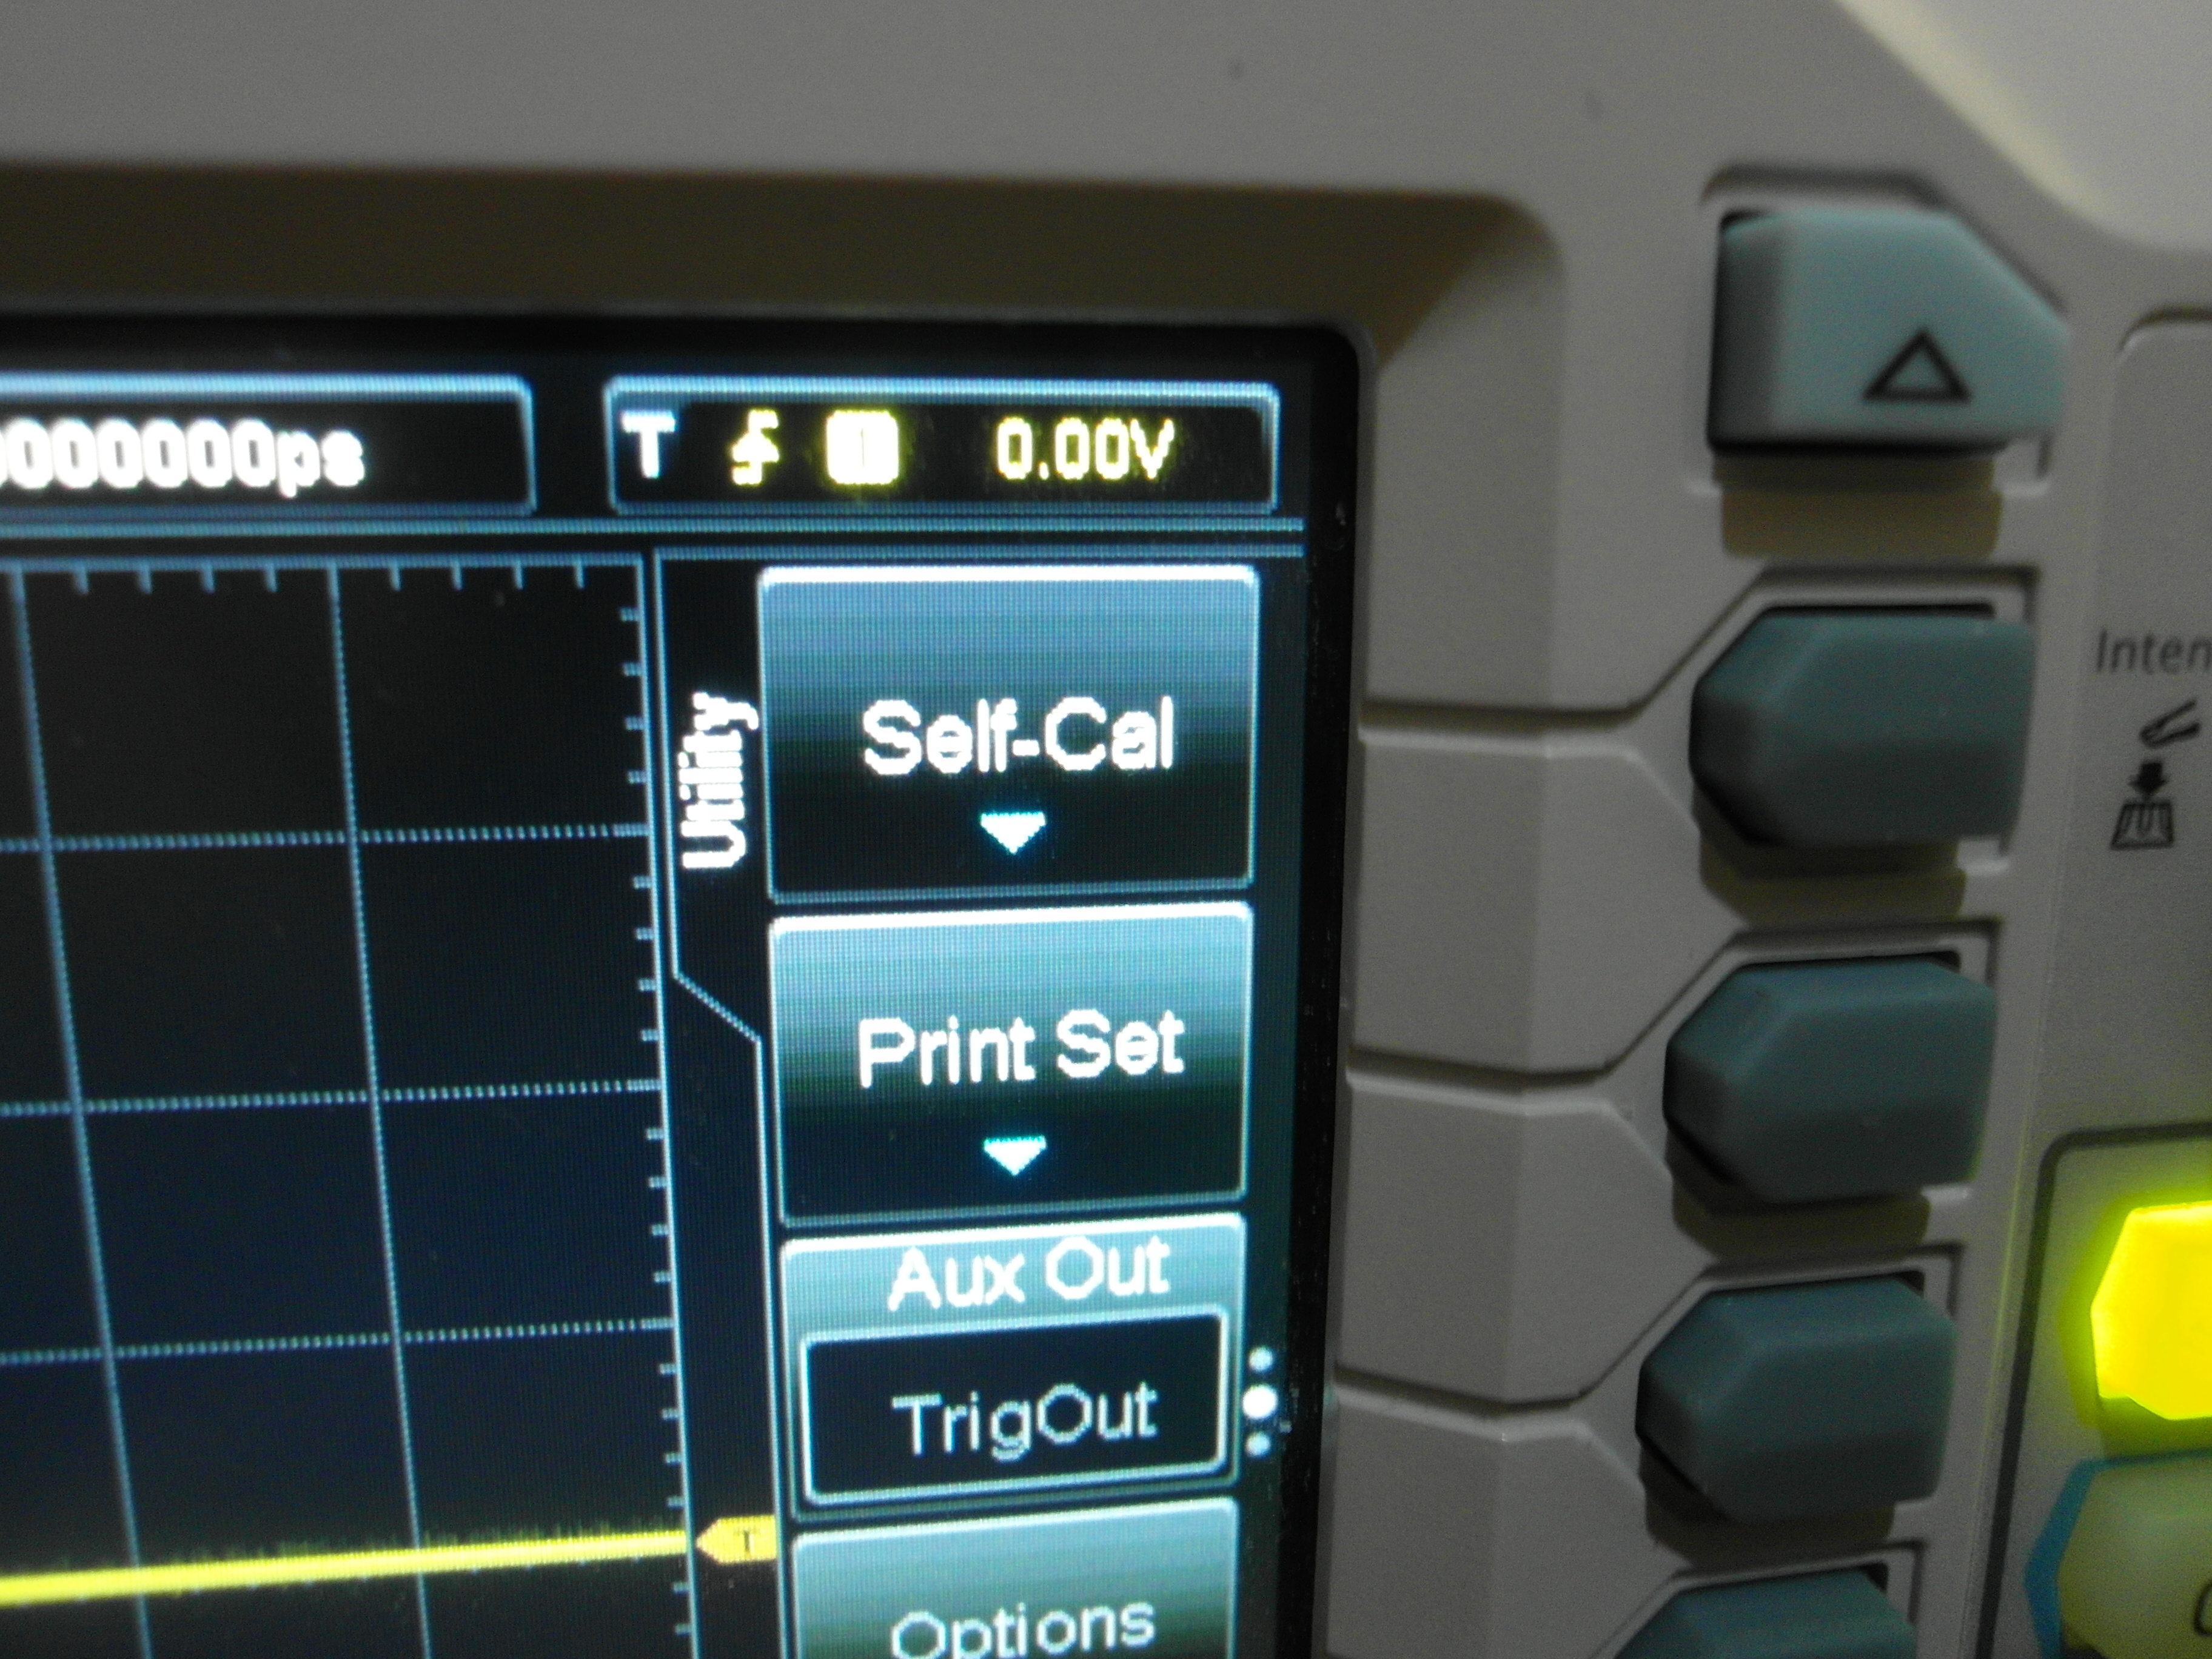
The menu to do this is often found through a button such as "Utility", on the Rigol, or on some other oscilloscopes something similar.
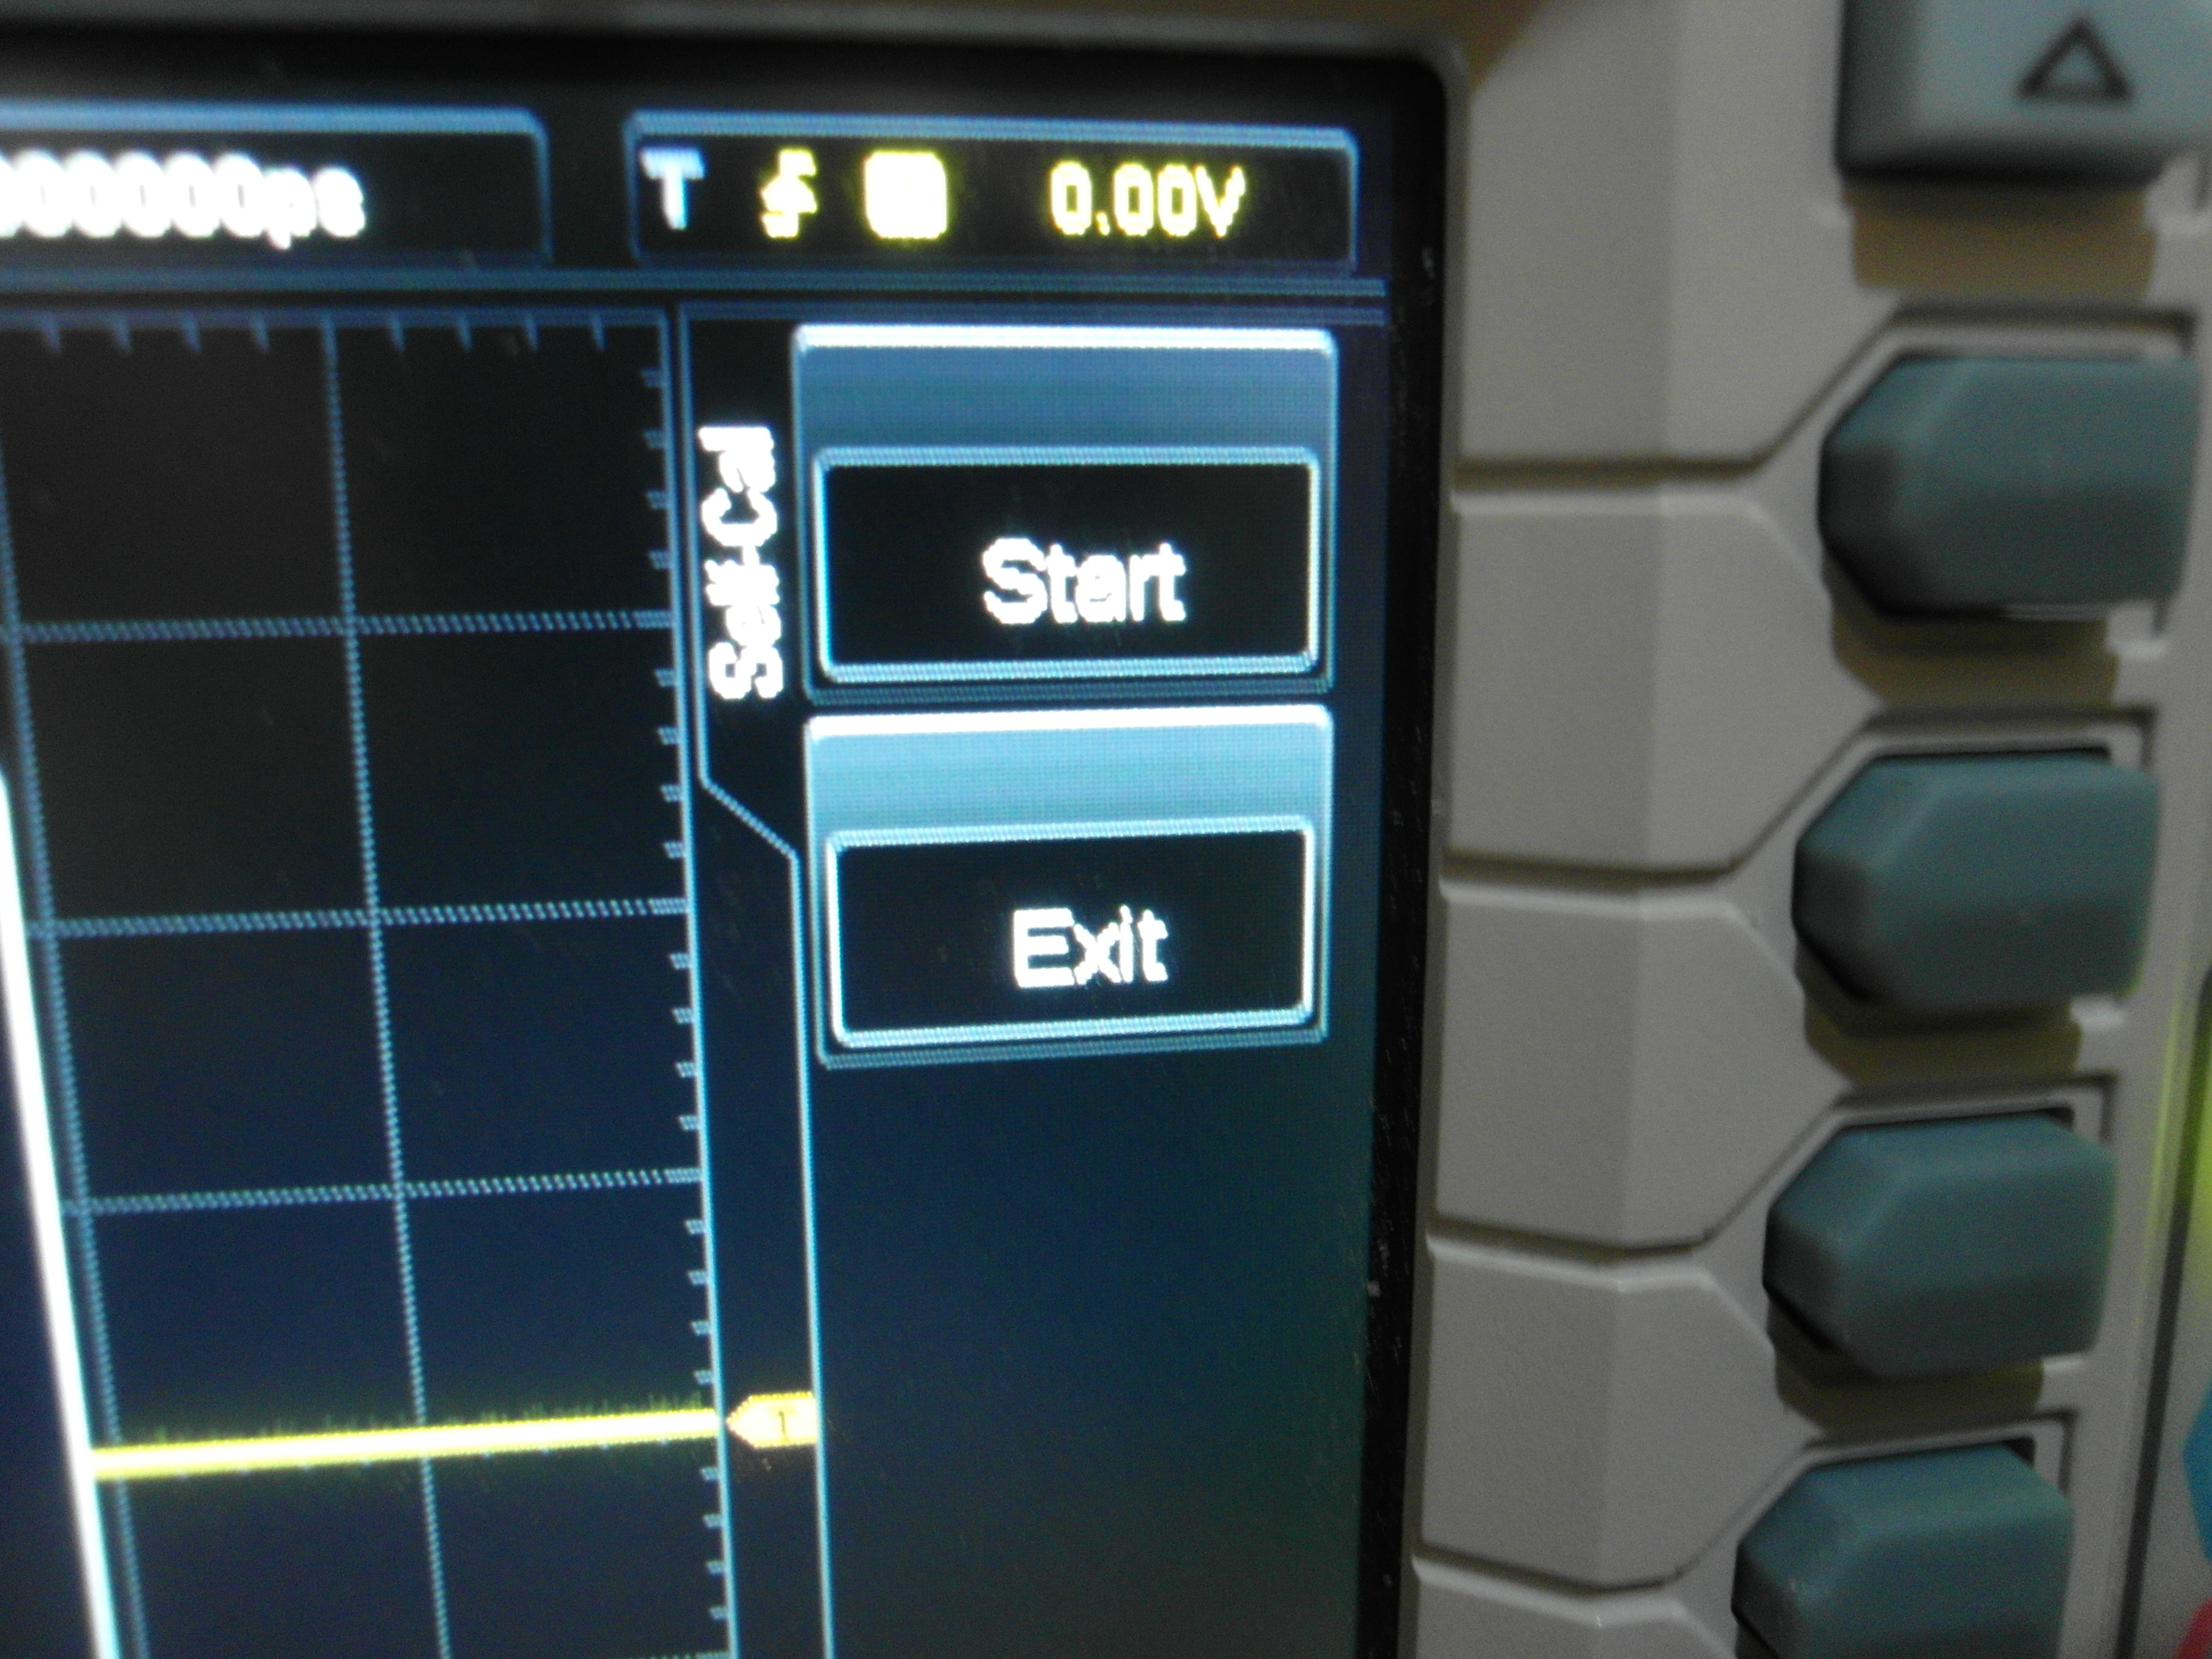
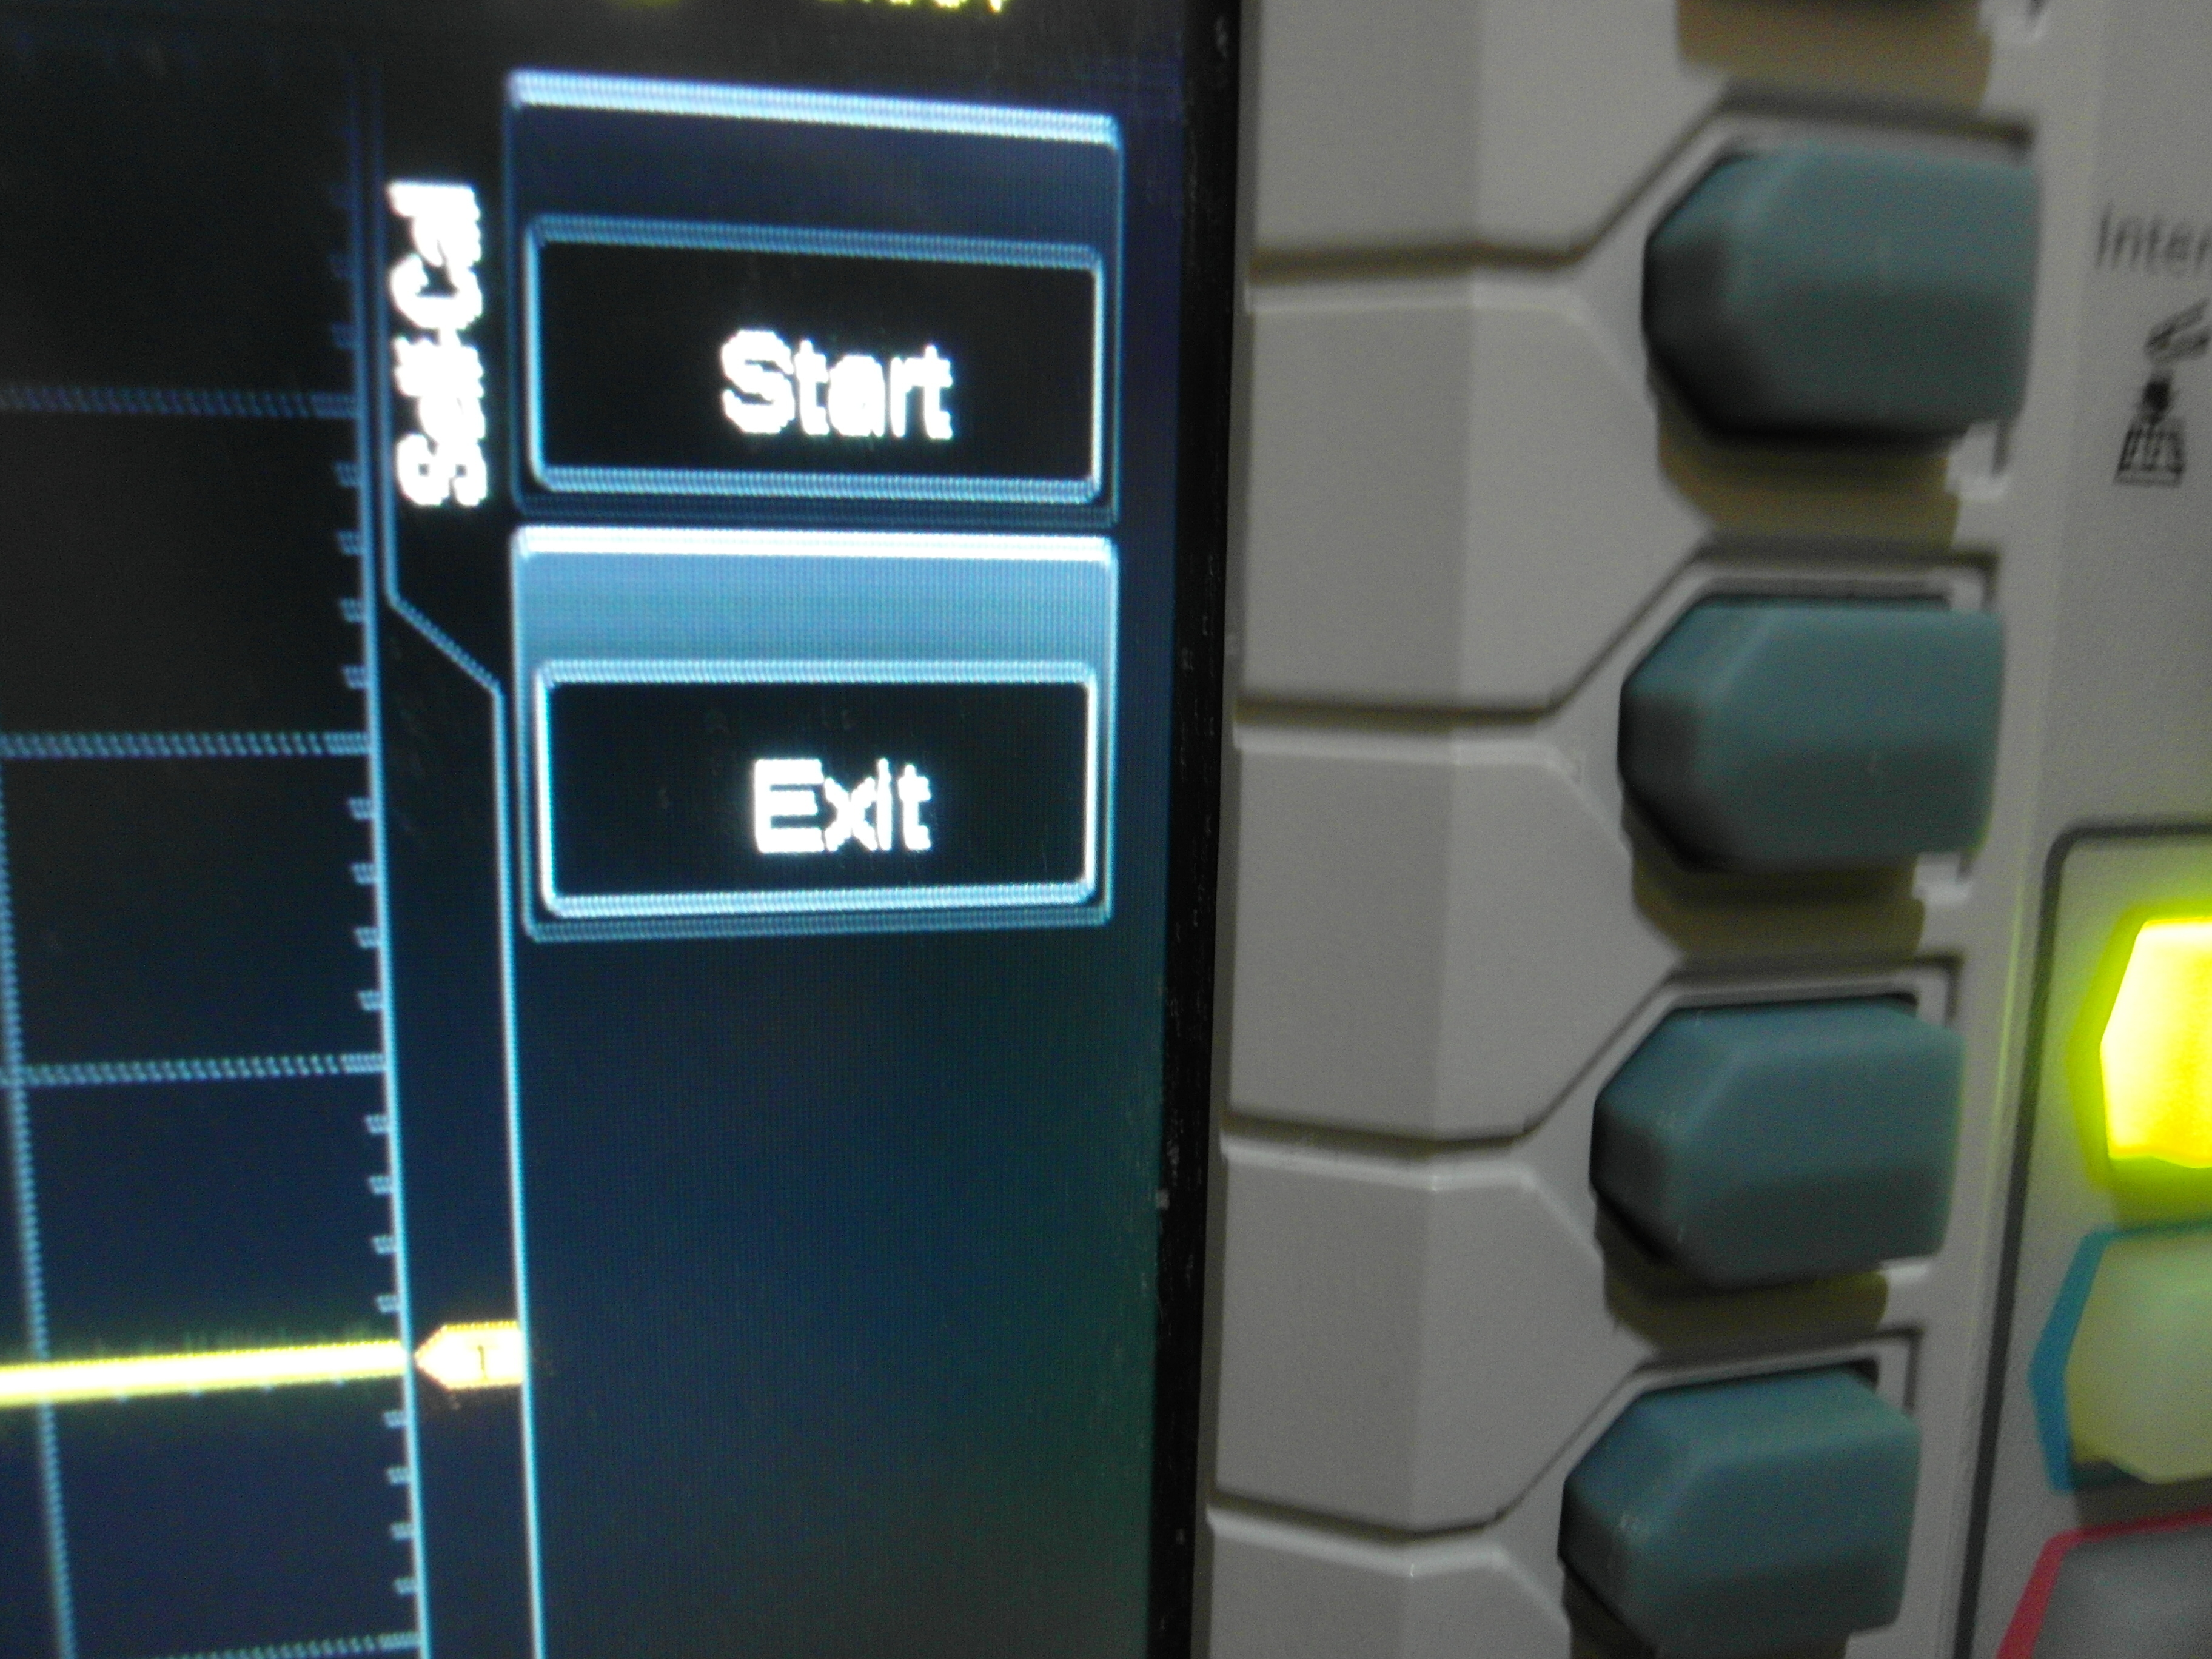
We then select "Self-Cal", or its equivalent, and after selecting it, we are presented with some options, on the Rigol and similar oscilloscopes, these are "Start" and "Exit".
We choice "Start" to begin the self-calibration process (see attached video). When the self-calibration is completed we select "Exit" to end the process (see attached video).
This process is quite long and can take several minutes. So, please be patient. Sadly, this process cannot be rushed.
After the self-calibration process for the oscilloscope is completed, and assuming we have calibrated a probe(s) as well, we are ready to start using the oscilloscope and probe.
Pulse Width Modulation (PWM) Working Example
This is the example of PWM from my previous Instructable "ESP32 Tutorial:Touch, Hall, I2C, PWM, ADC, & DAC". It will be the configuration we use with our oscilloscope in the next Step to see a PWM signal.
I repeat this example here to eliminate the need to change to an earlier Instructable, and to provide us with a working example of PWM in action.
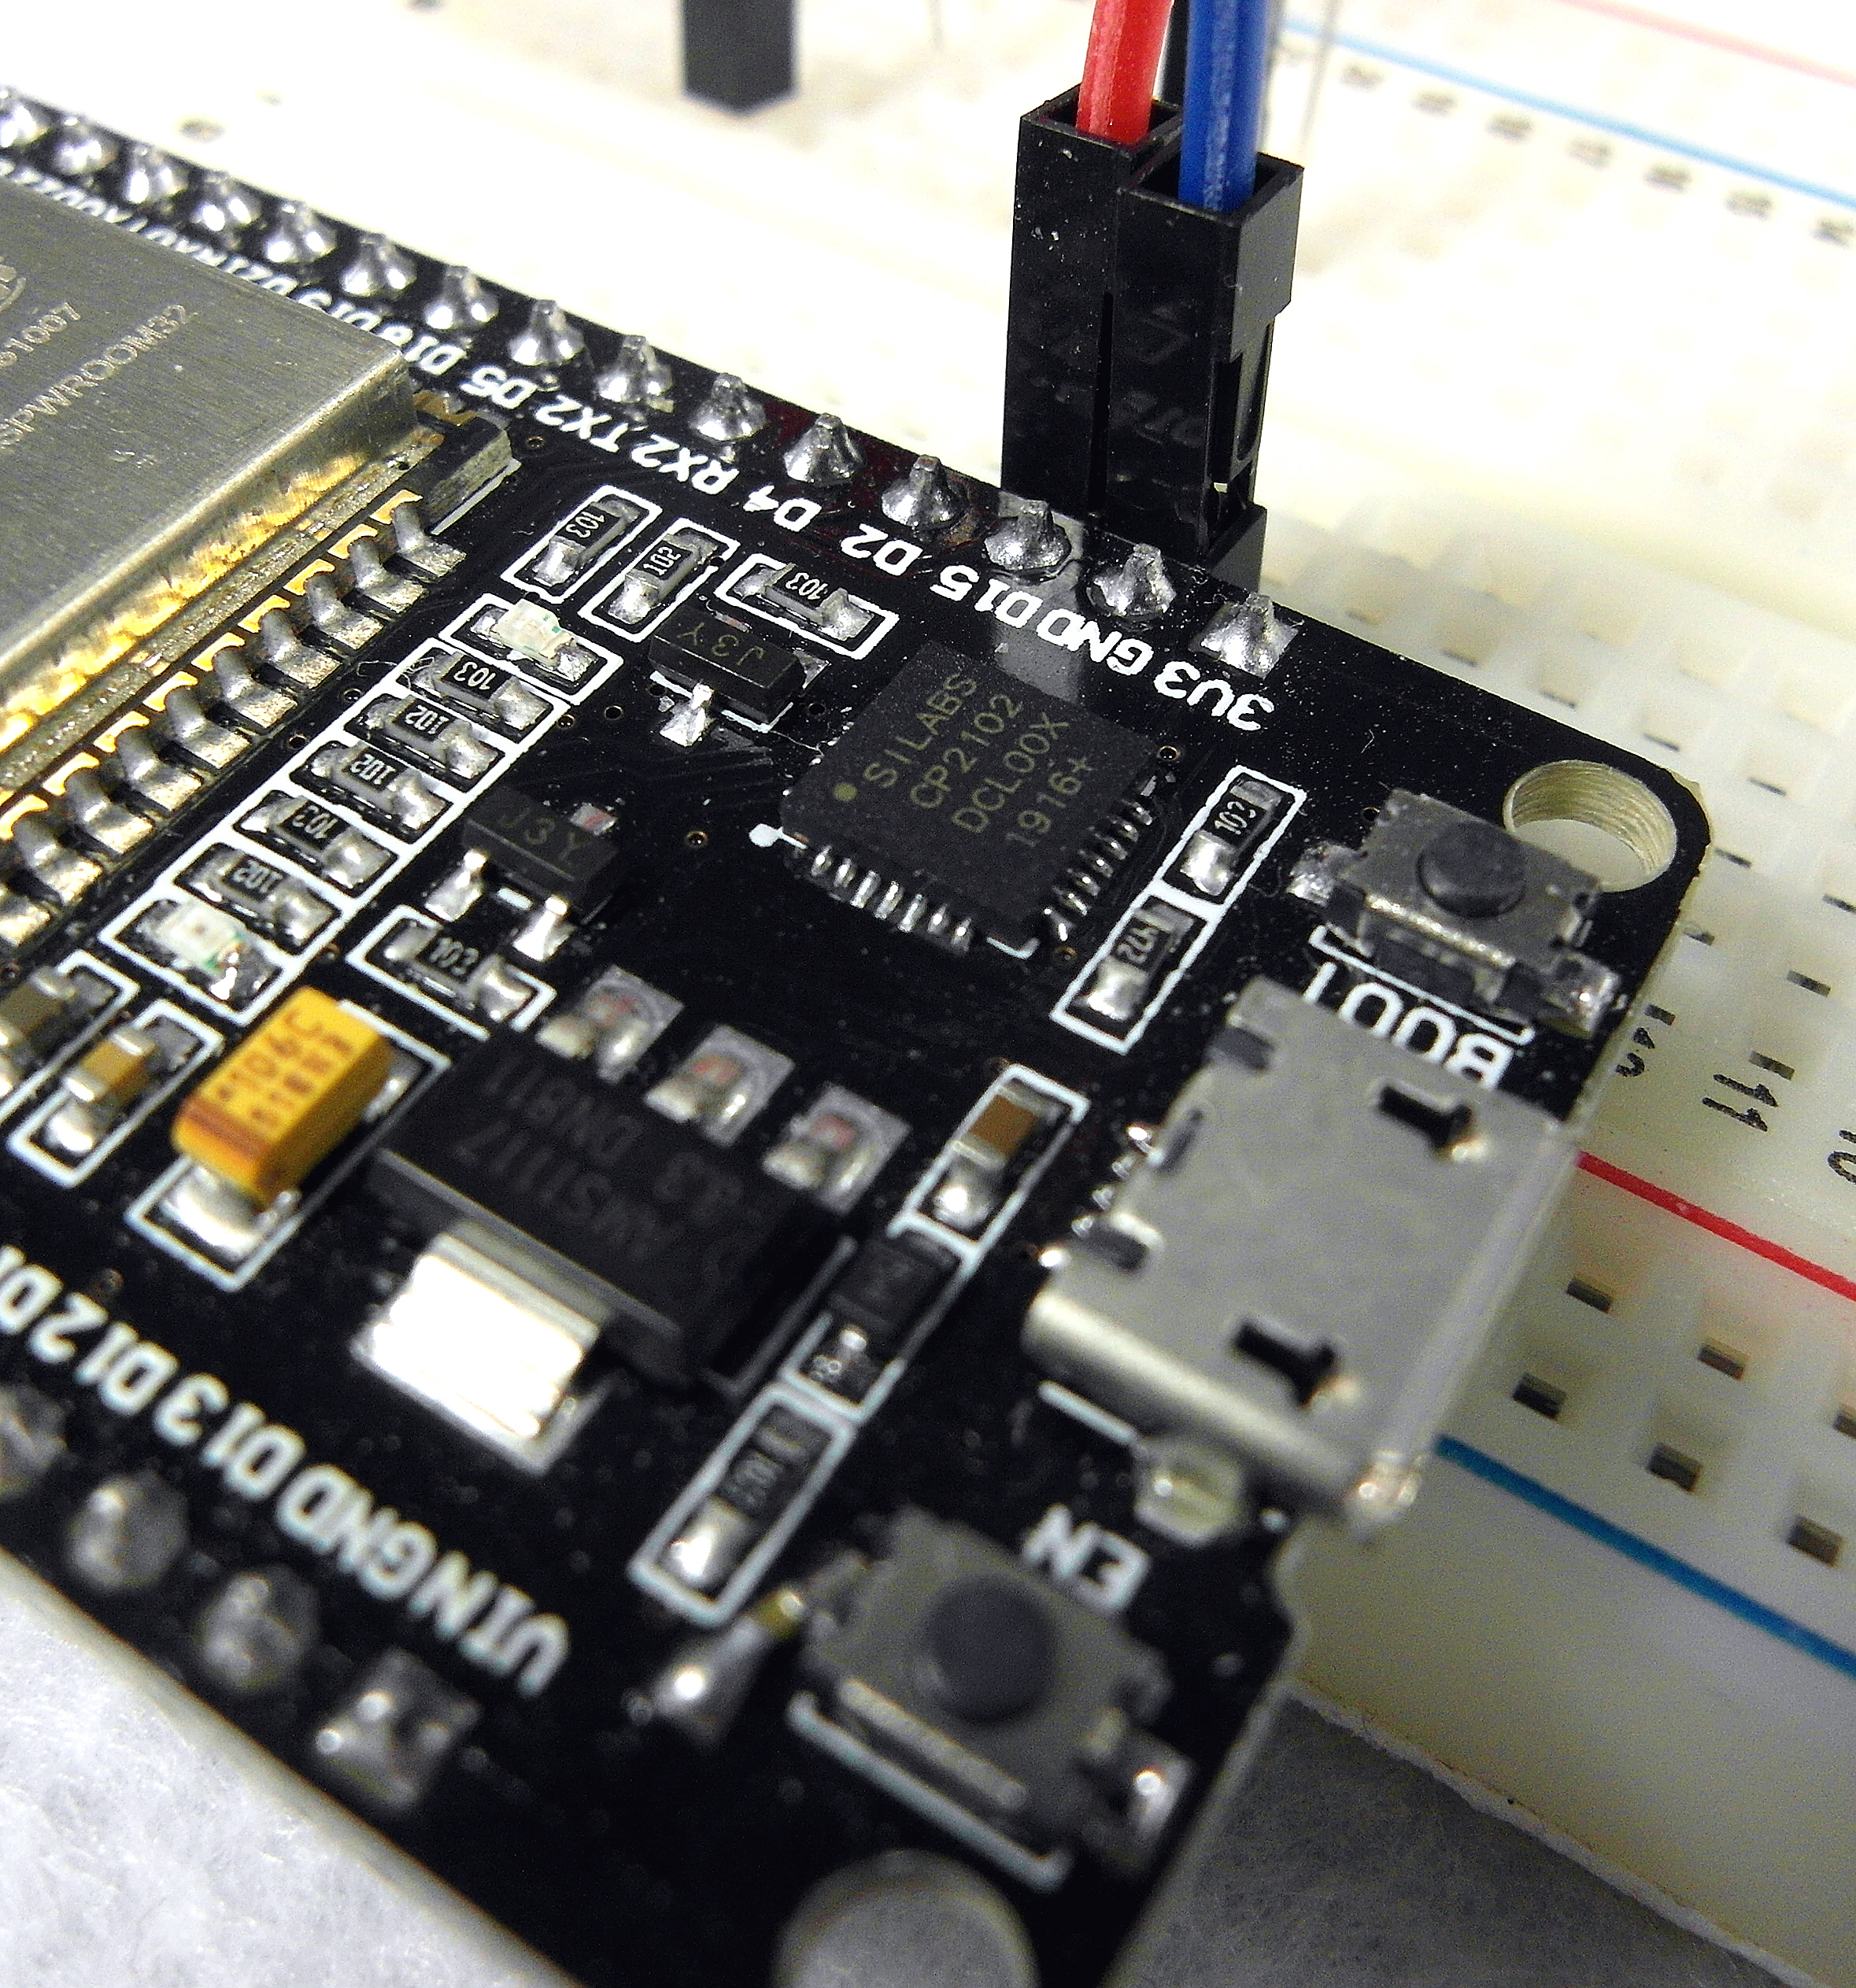
Almost every pin on the ESP32 development board, used here, accommodates PWM, except for the bottom two pins on both the left and right-side, and the top pin on the left side. This is with the development board face up, and the USB connector oriented down.
PWM allows us to simulate analog voltages using digital means. It is often used to fade an LED up and down, or control a motor.
In the example that follows, we will use PWM in conjunction with an ESP32 development board to fade an LED up and down. We use more resolution for PWM than is available on the Arduino UNO which defaults to 8-bits, i.e., 0-255.
Here we use 15-bits, so the range is from 0 to not quite 33,000.
/*
* Program by R. Jordan Kreindler
* showing the use of the PWM capabilities
* of an ESP32 Development board.
*/
#define ledChannel 0 // Channel 0 chosen, from 0-15 choices
#define resolution 15 // Resolution is chosen as 15 bits
#define frequency 5000 // 5,000 Hz frequency
#define LED 15 // LED connected via 330 ohm
// resistor to pin 15
// Other end of LED
// to GND
int delay1 = 20; // Delay in milliseconds
void setup() {
ledcSetup(ledChannel, frequency, resolution); // Set-up a channel
ledcAttachPin(LED, ledChannel); // Attach a channel to a pin
}
void loop() {
// In the for() loops, adding and subtracting
// two hundred (200) is necessary owing to the greater
// resolution provided by 15 bits, compared to the UNO
for (int i = 0; i < 32768; i = i + 200) { //loop to fade up
ledcWrite(ledChannel, i);
delay(delay1);
}
for (int i = 32767; i > -1; i = i - 200) { //loop to fade down
ledcWrite(ledChannel, i);
delay(delay1);
}
}
Downloads
Showing Pulse Width Modulation (PWM) on the Oscilloscope.
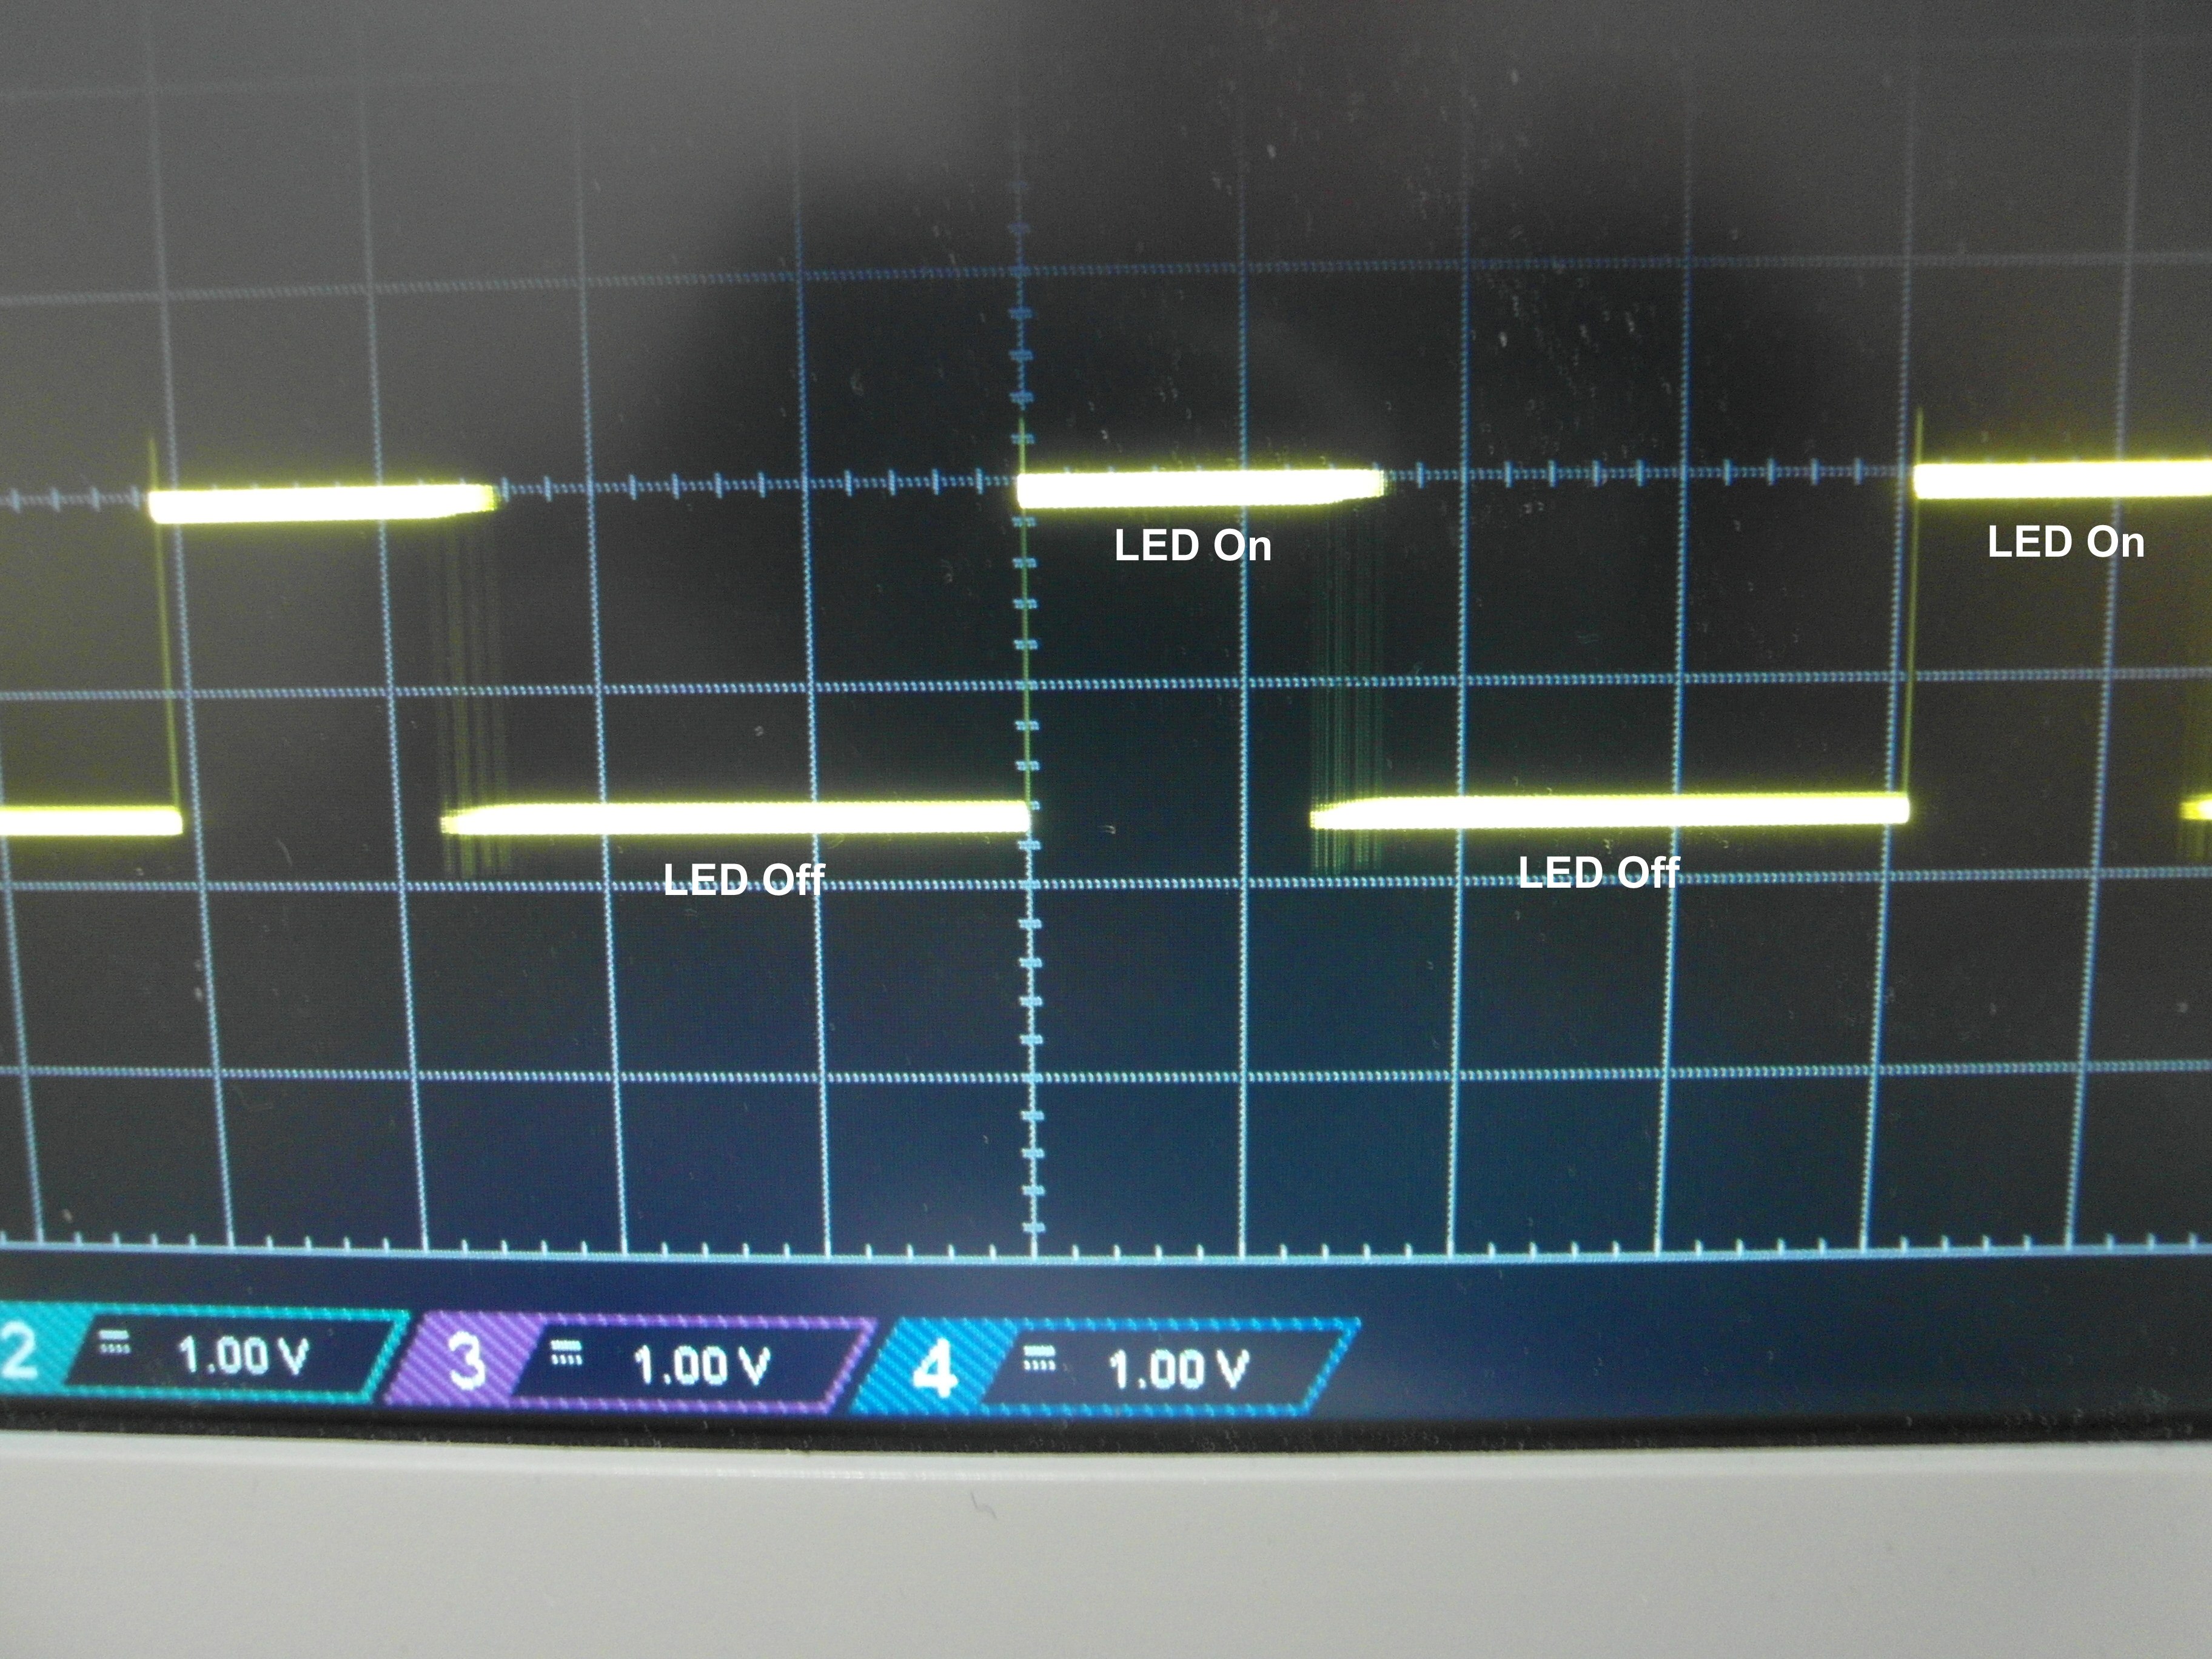


PWM works by pulsing DC current, and varying the amount of time that each pulse stays On and Off. Thereby controlling the amount of "brightness" we perceive. PWM signals are typically square/rectangular waves.
Dimming an LED with PWM depends on the ability of the eye to average the amount of time the LED is turned On and the amount of time it is turned Off.
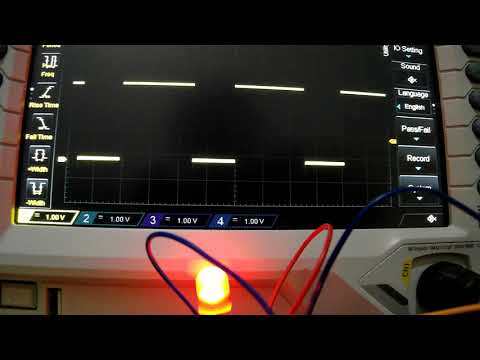
We can see PWM in action with the oscilloscope.
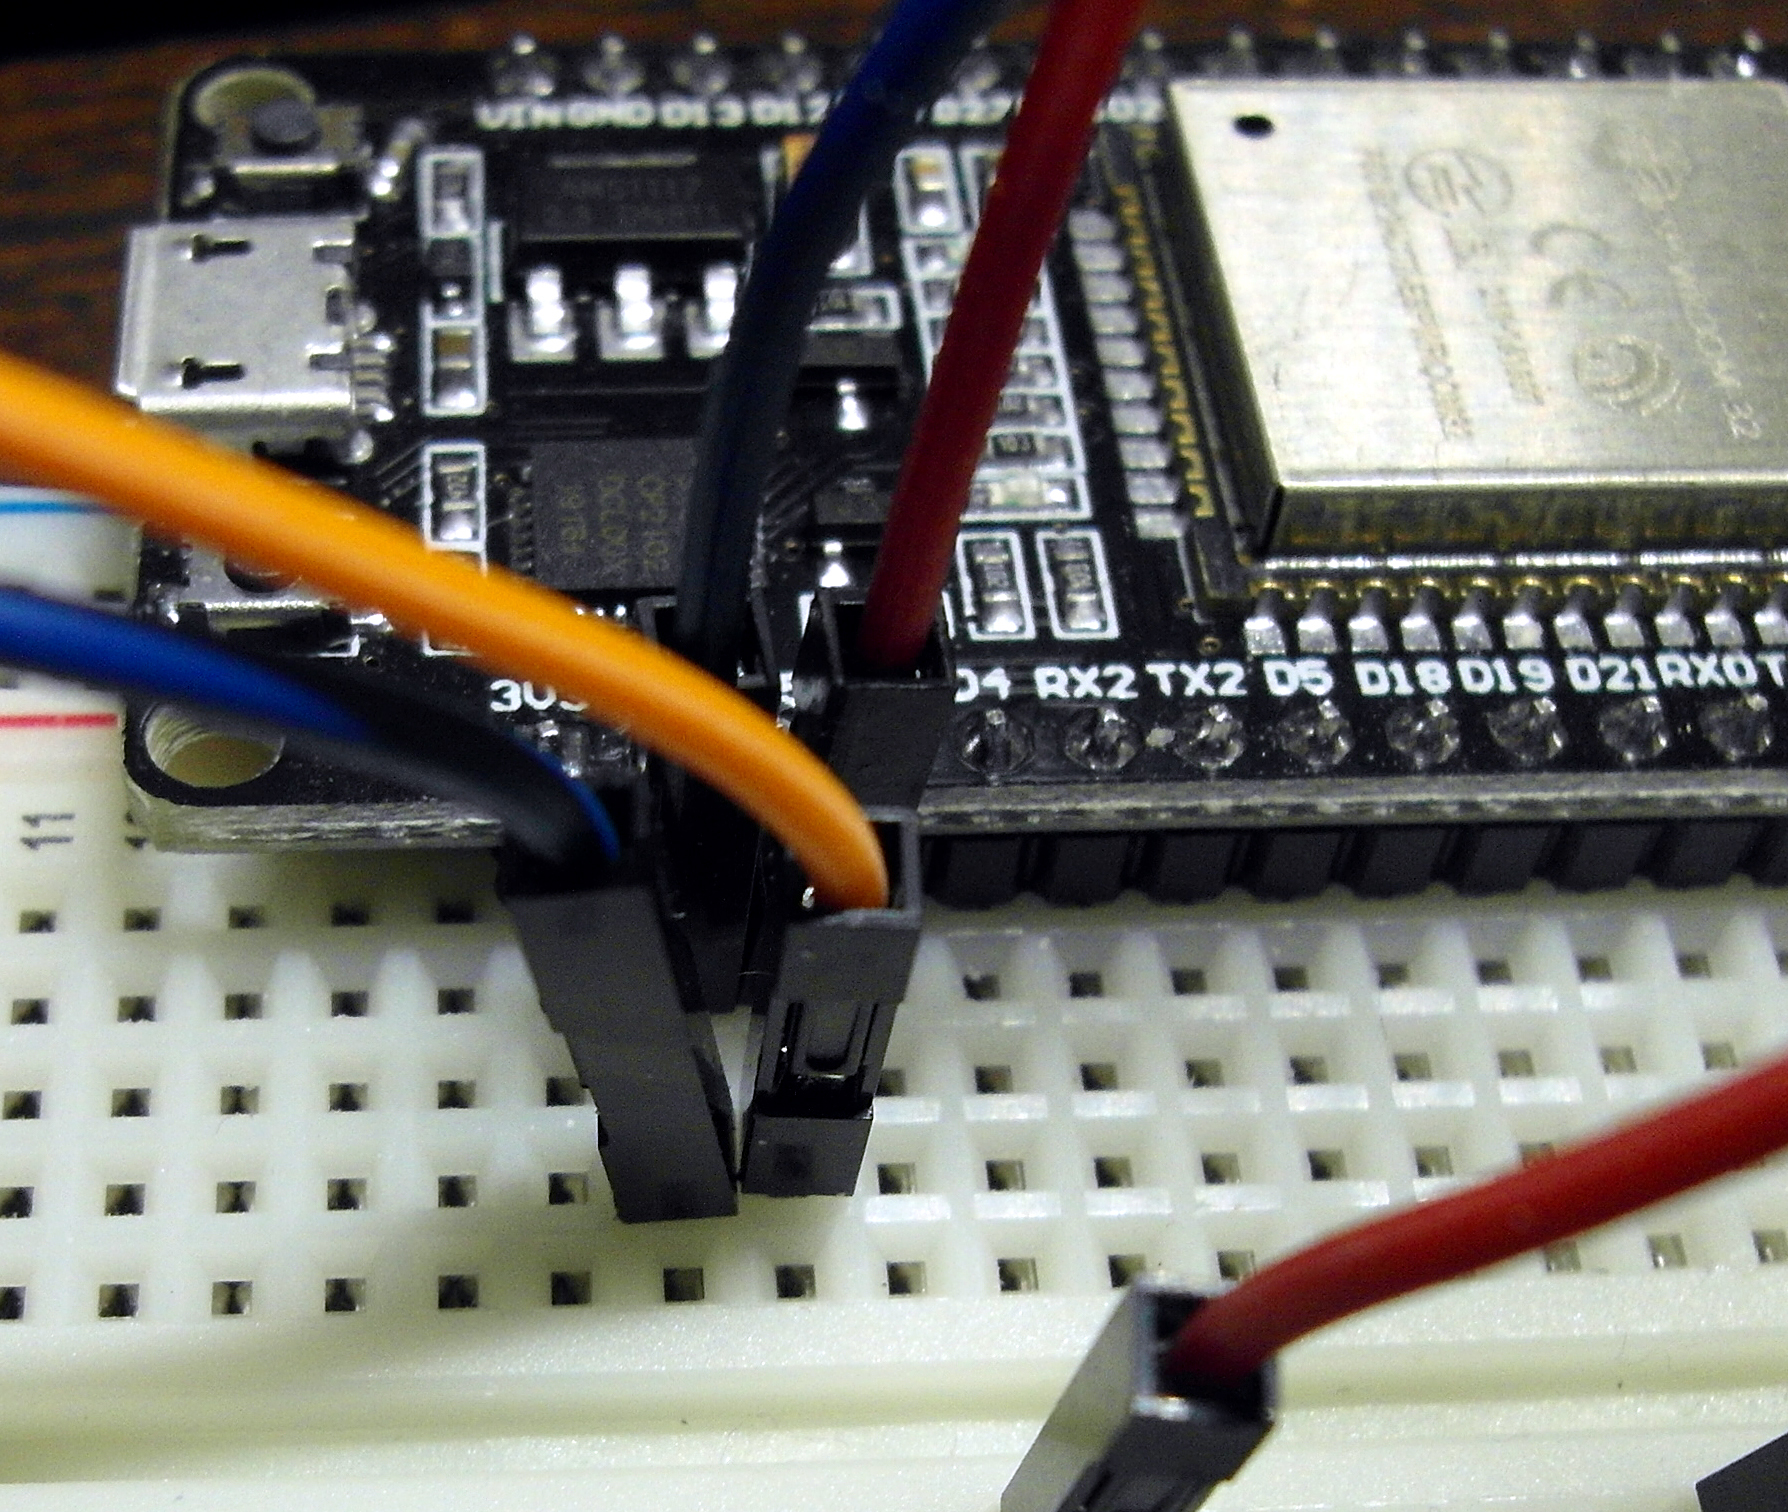
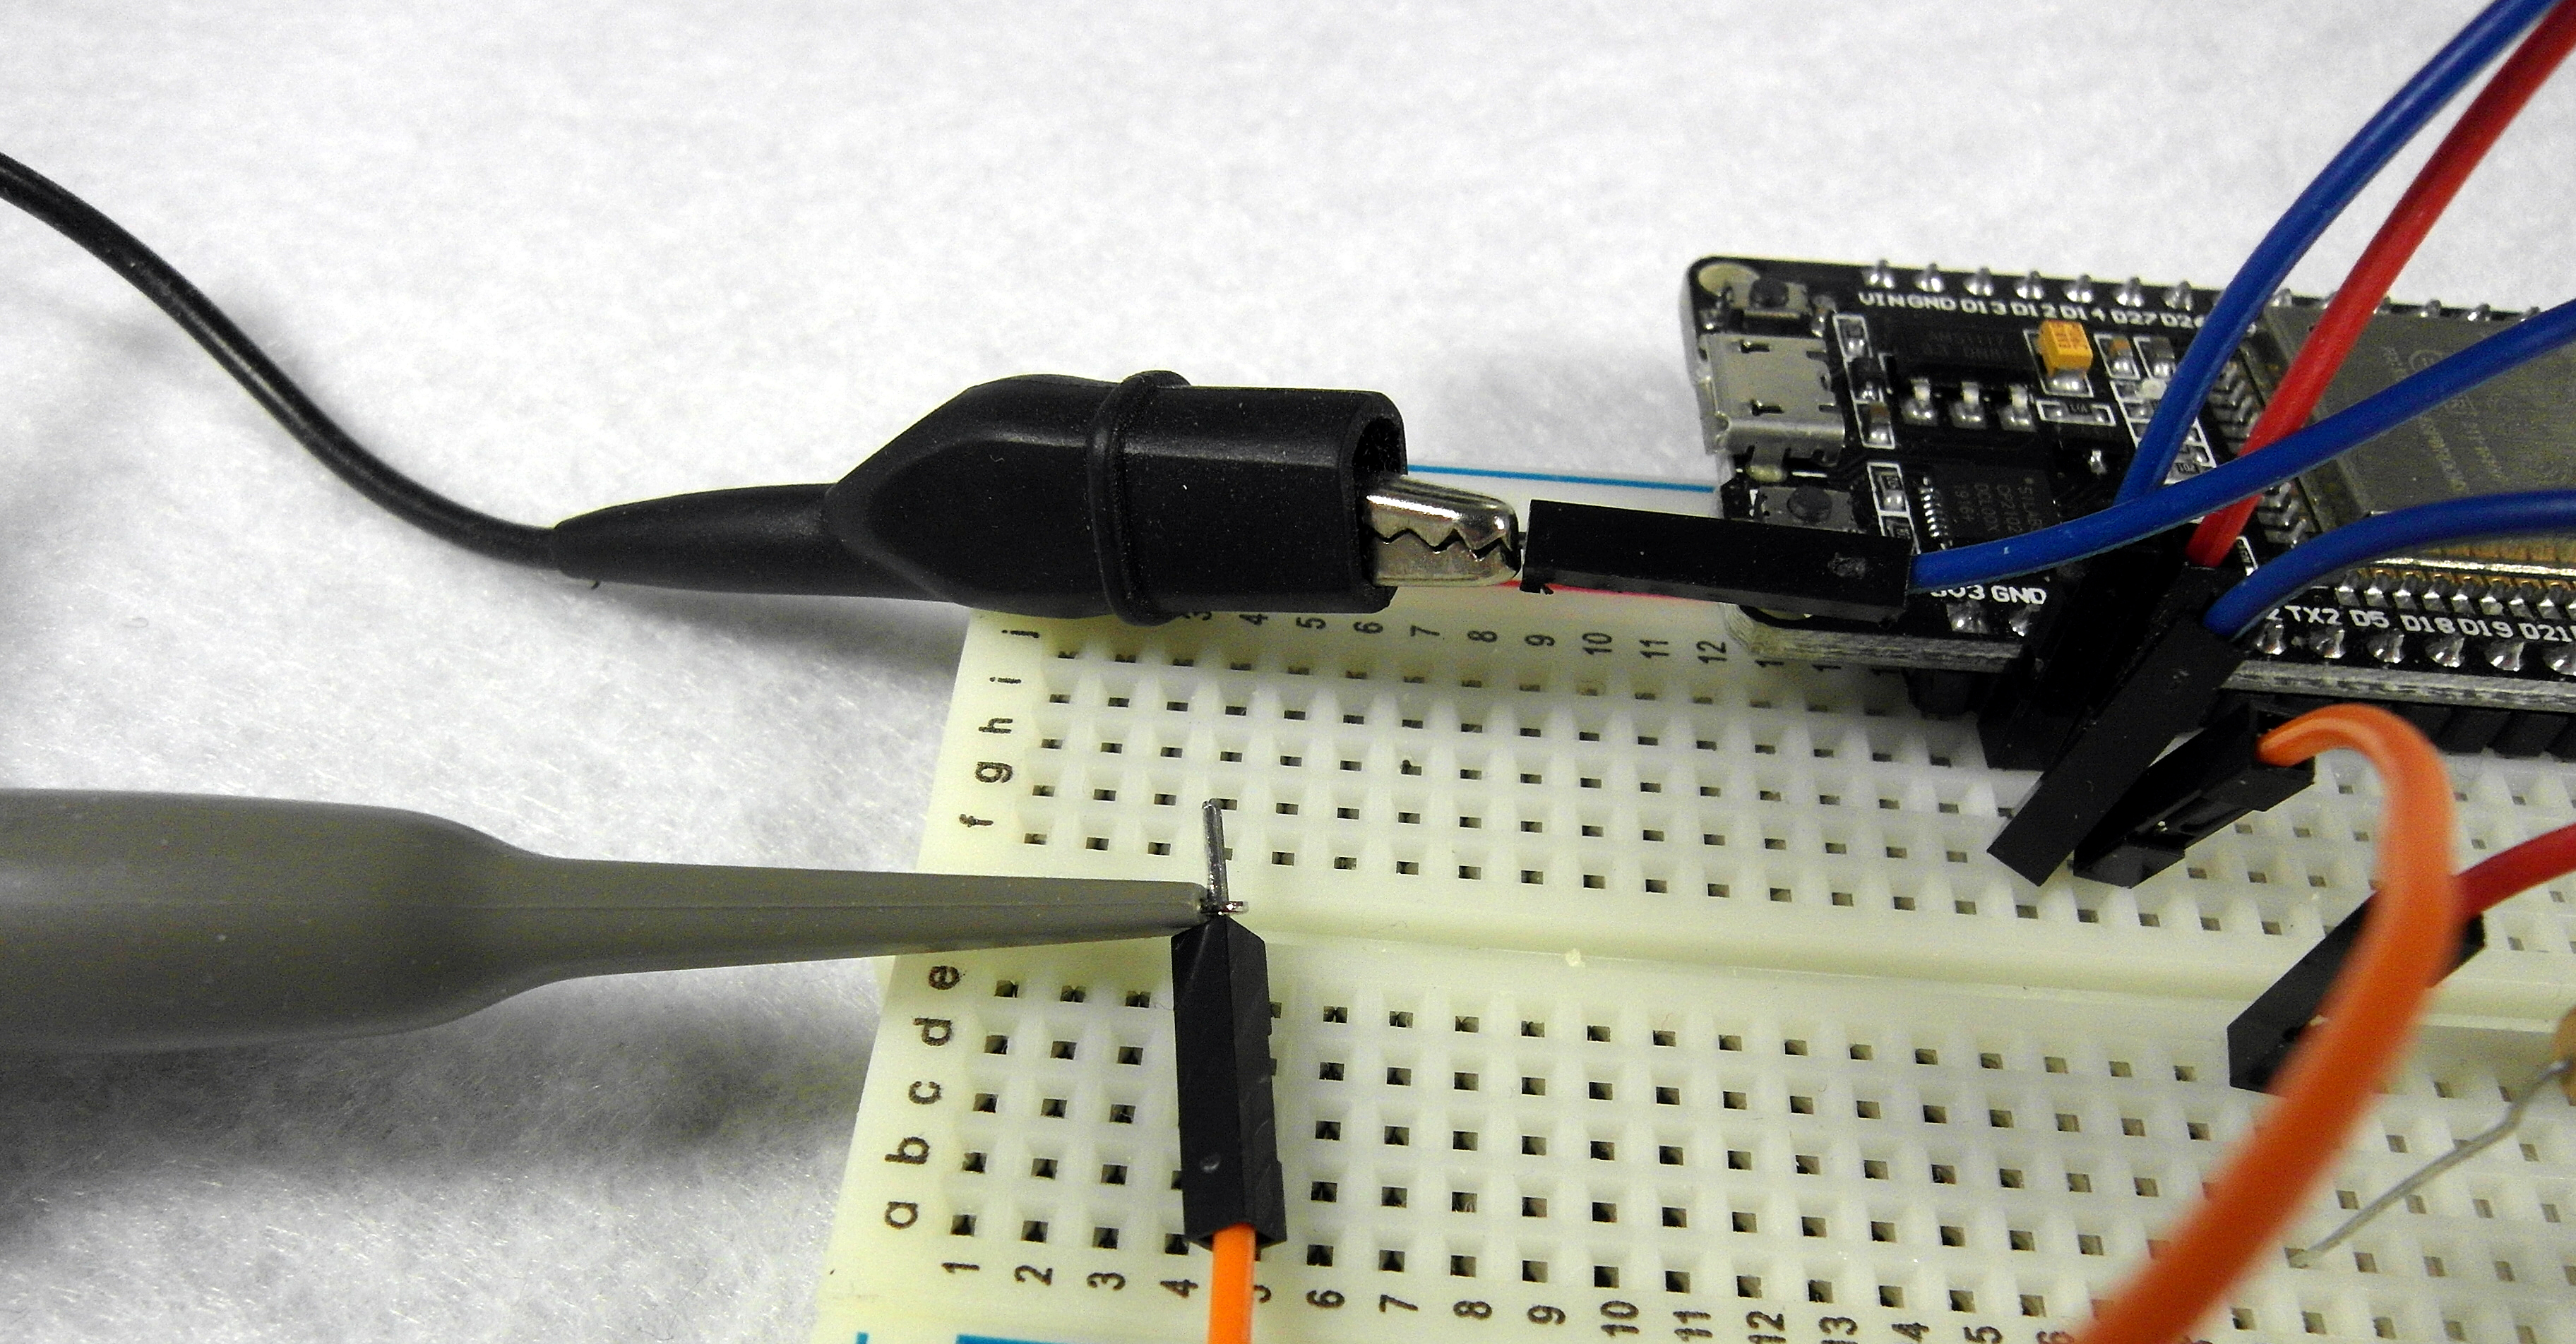
It is easy to connect the oscilloscope to see PWM in our example. First, we insert two additional male to male Dupont jumper wires in the breadboard, in electrical contact with the existing ground pin and pin D15. The unconnected male ends of these wires are connected to our oscilloscope probe. Ground to the ground wire on our probe, and the hook on our probe to the wire connected to D15. (See attached pictures).
As noted, PWM works by turning the LED On and Off for a portion of each period. The period for PWM here is the period of a square wave. These square wave periods are quite short, allowing our brain to "average" the time an LED is On and Off.
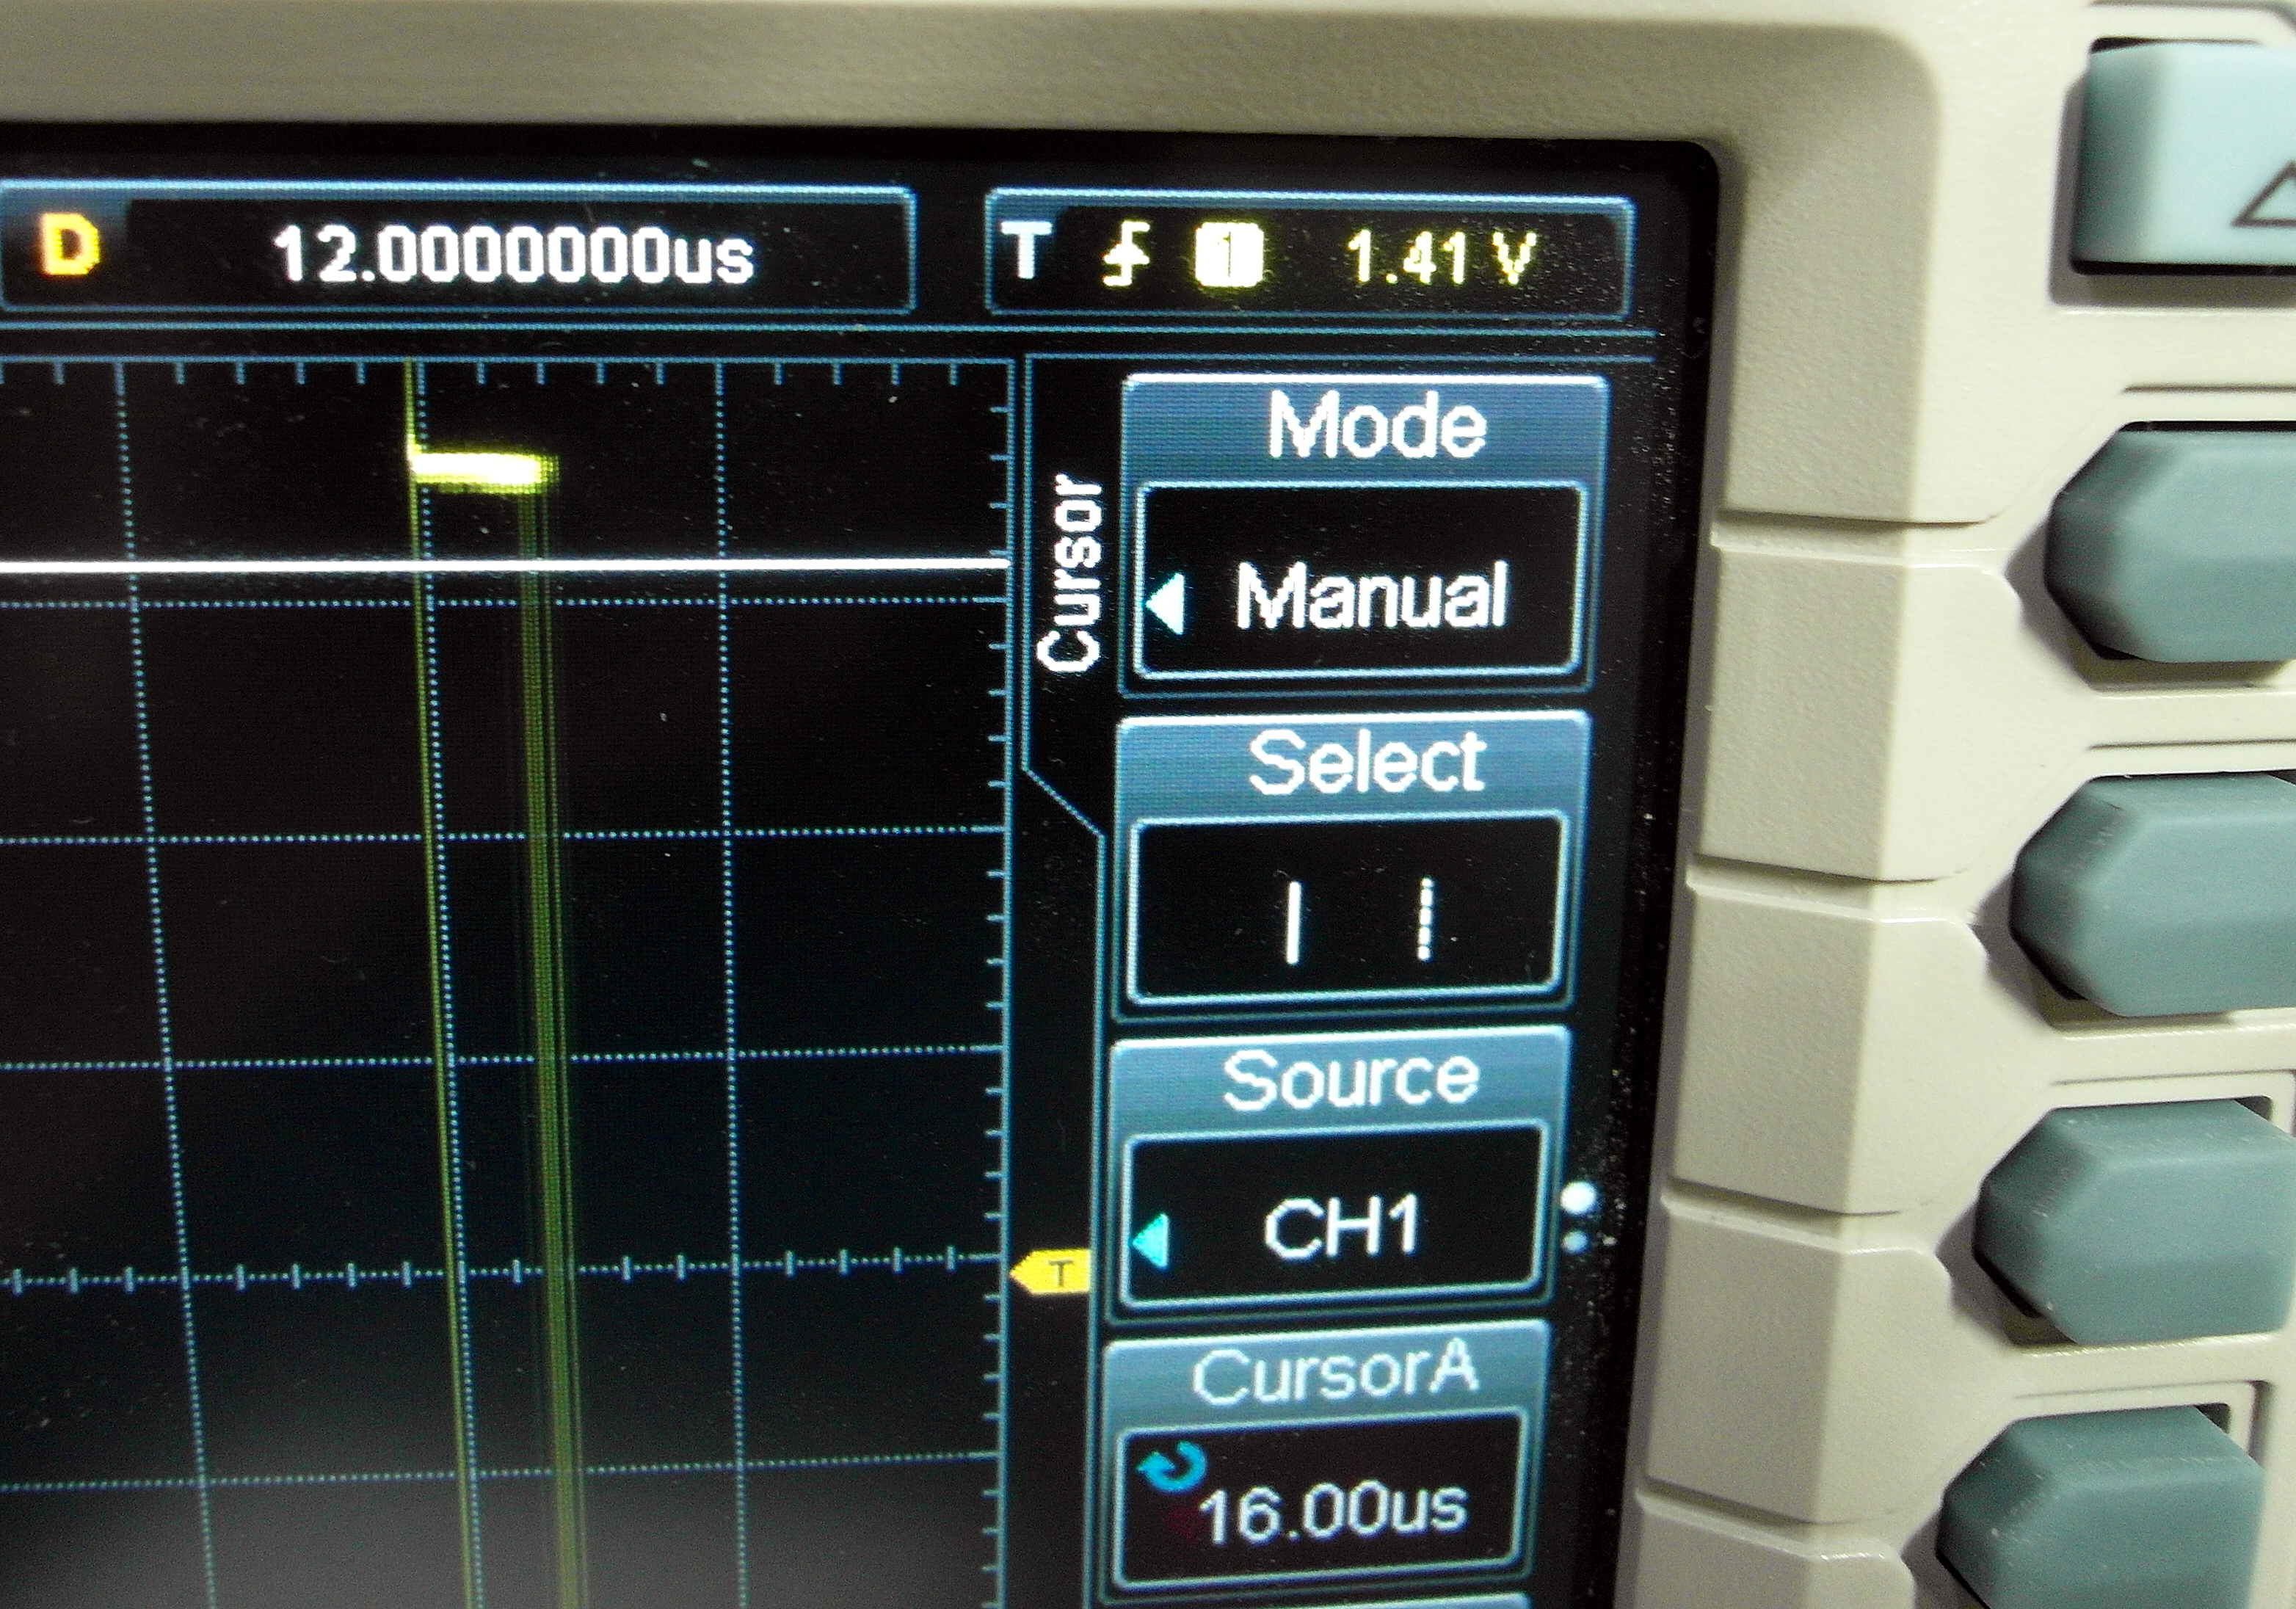
In fact, if we select the "Cursor" function in "Manual" mode and measure the period's length, shown on the oscilloscope, we can see this period is indeed quite short.
A time period is measured in seconds, it is usually denoted by the symbol "T". It is the time from the leading edge of one wave to the leading edge of the next. As the frequency of a wave is increased the time period decreases. Here we have a time period of about 400 microseconds. Since the frequency (f) and the period of a wave are reciprocally related; we have a frequency, in our example, of approximately 1/T, or about 2.5 kHz. This speed is faster than that detectable by the human eye. Thus, human eyes average the results out.
The amount of time the LED stays On is controlled by the "duty cycle", i.e., the fraction of time the LED is turned On compared to the time the LED is turned Off.
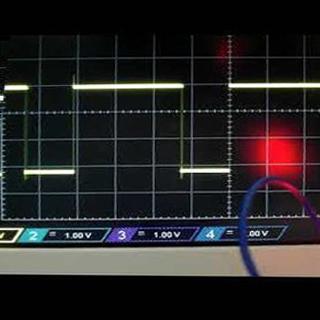
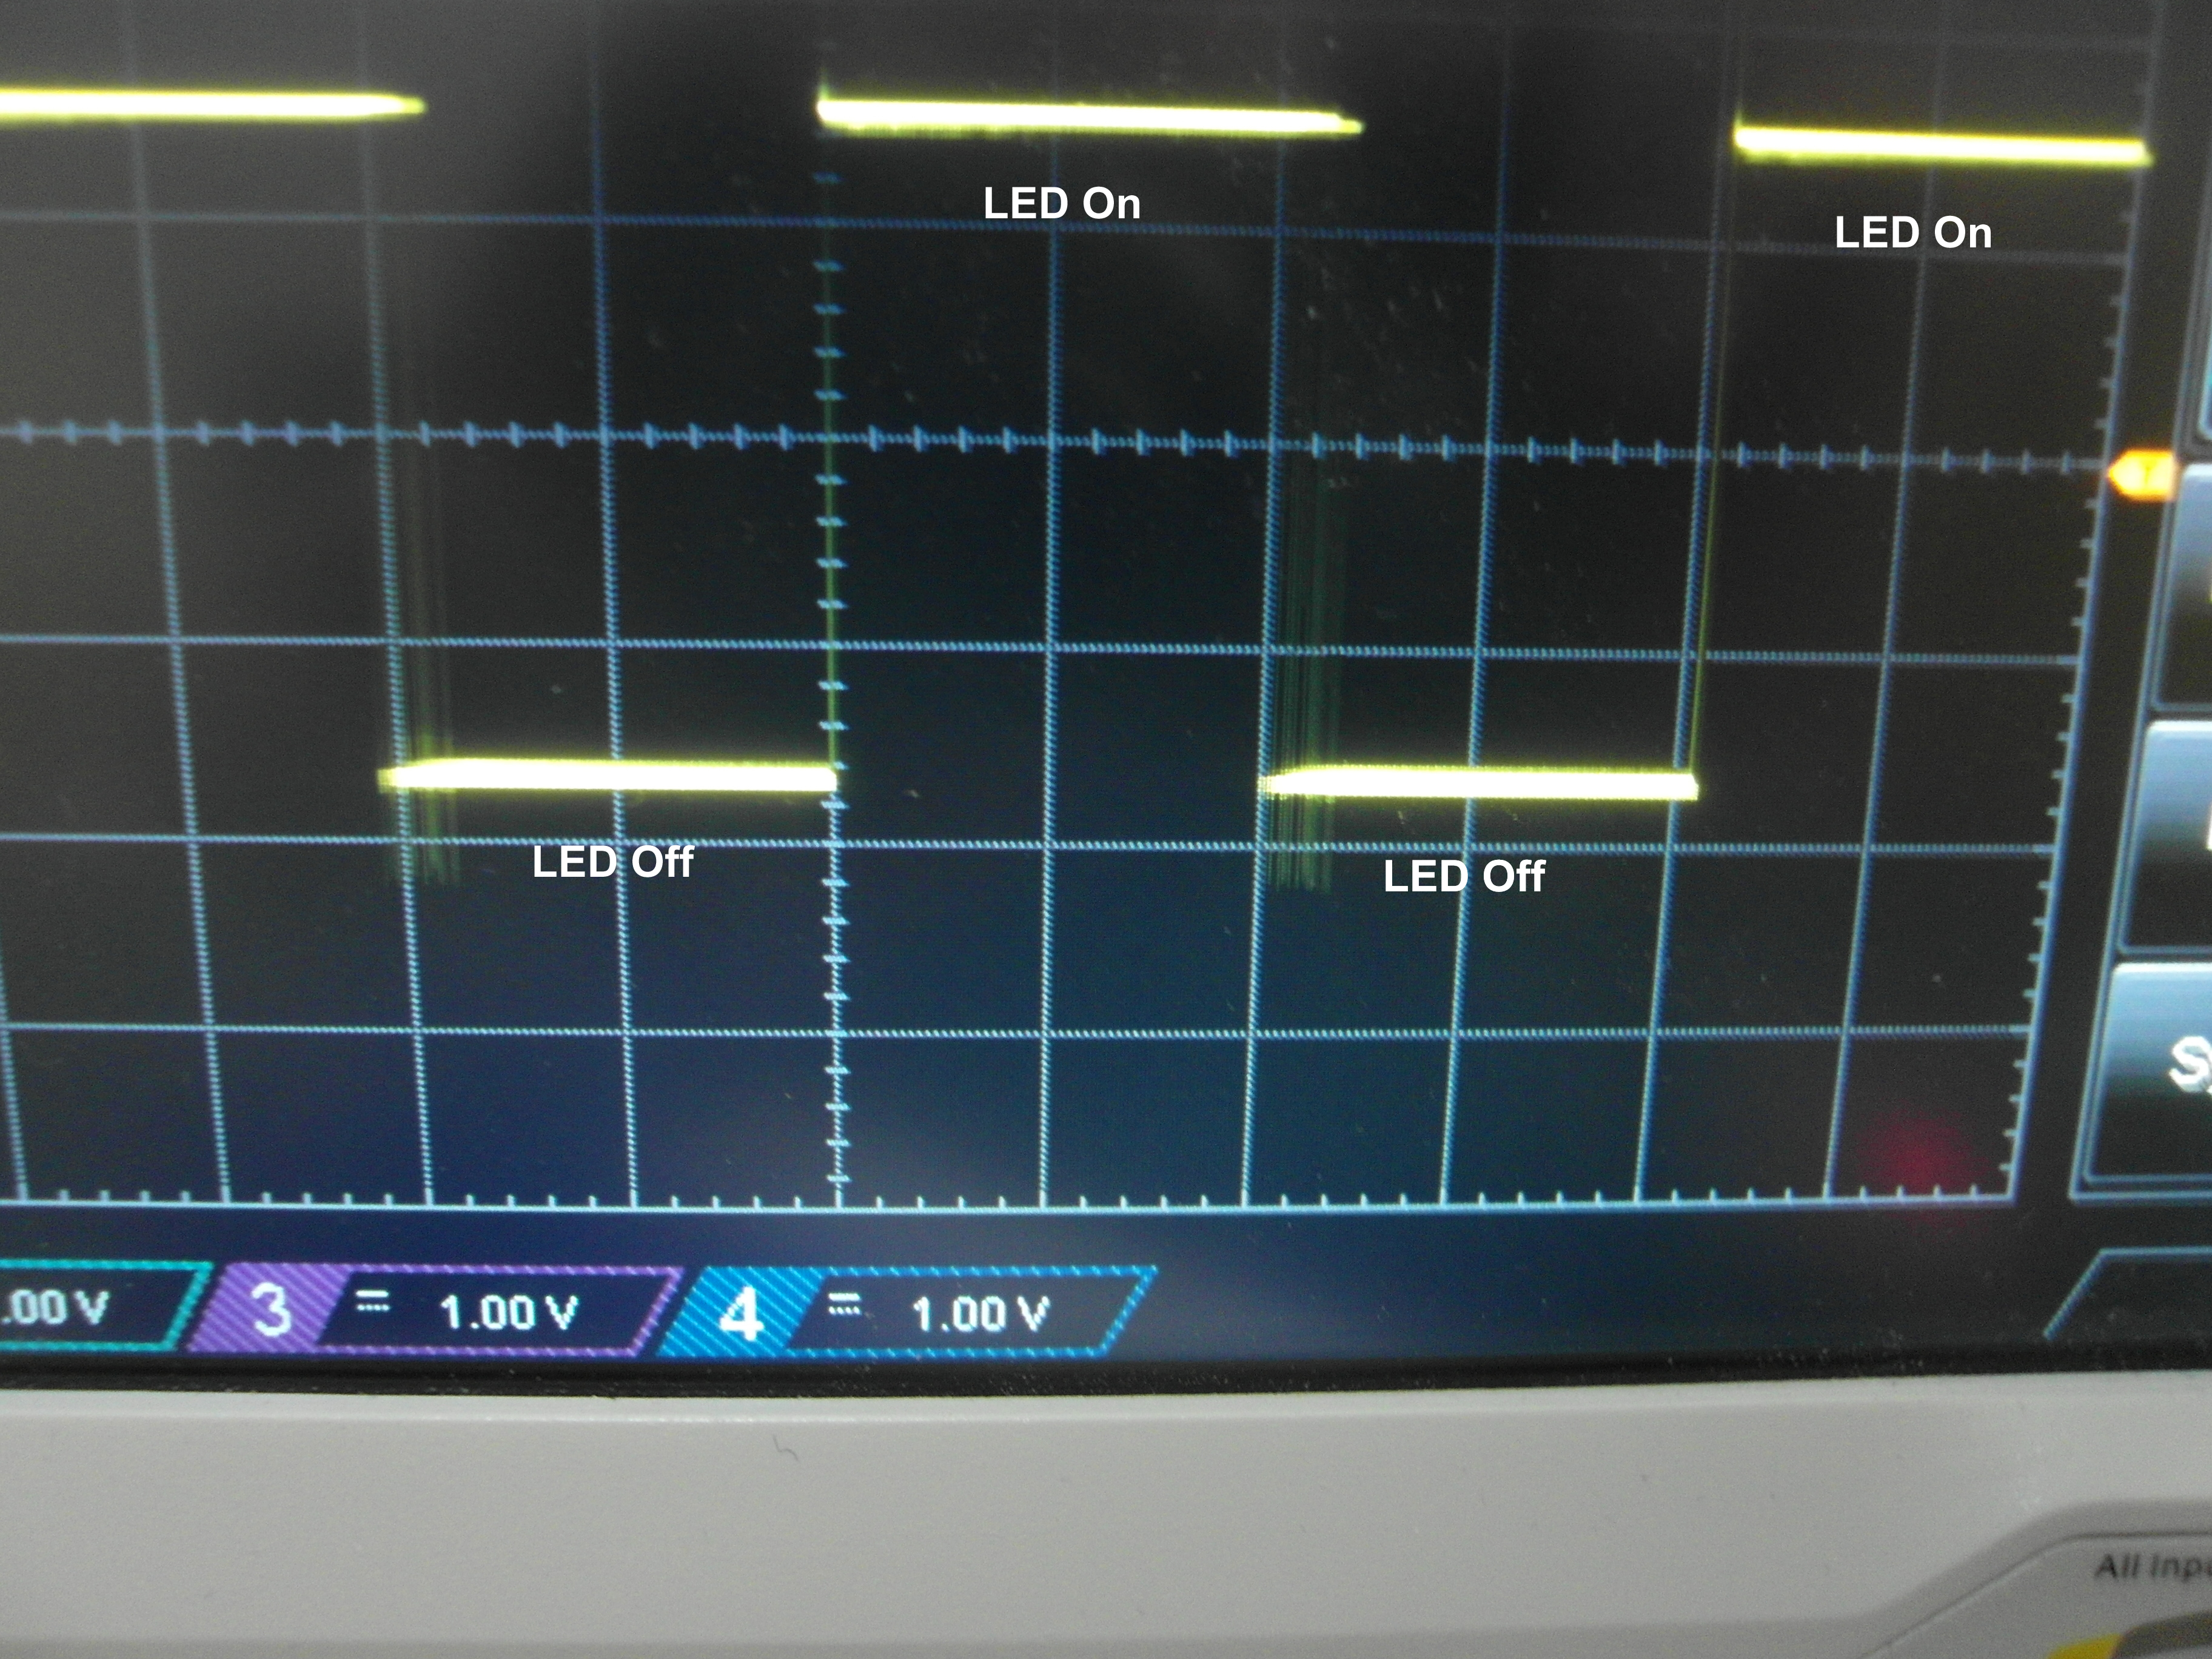
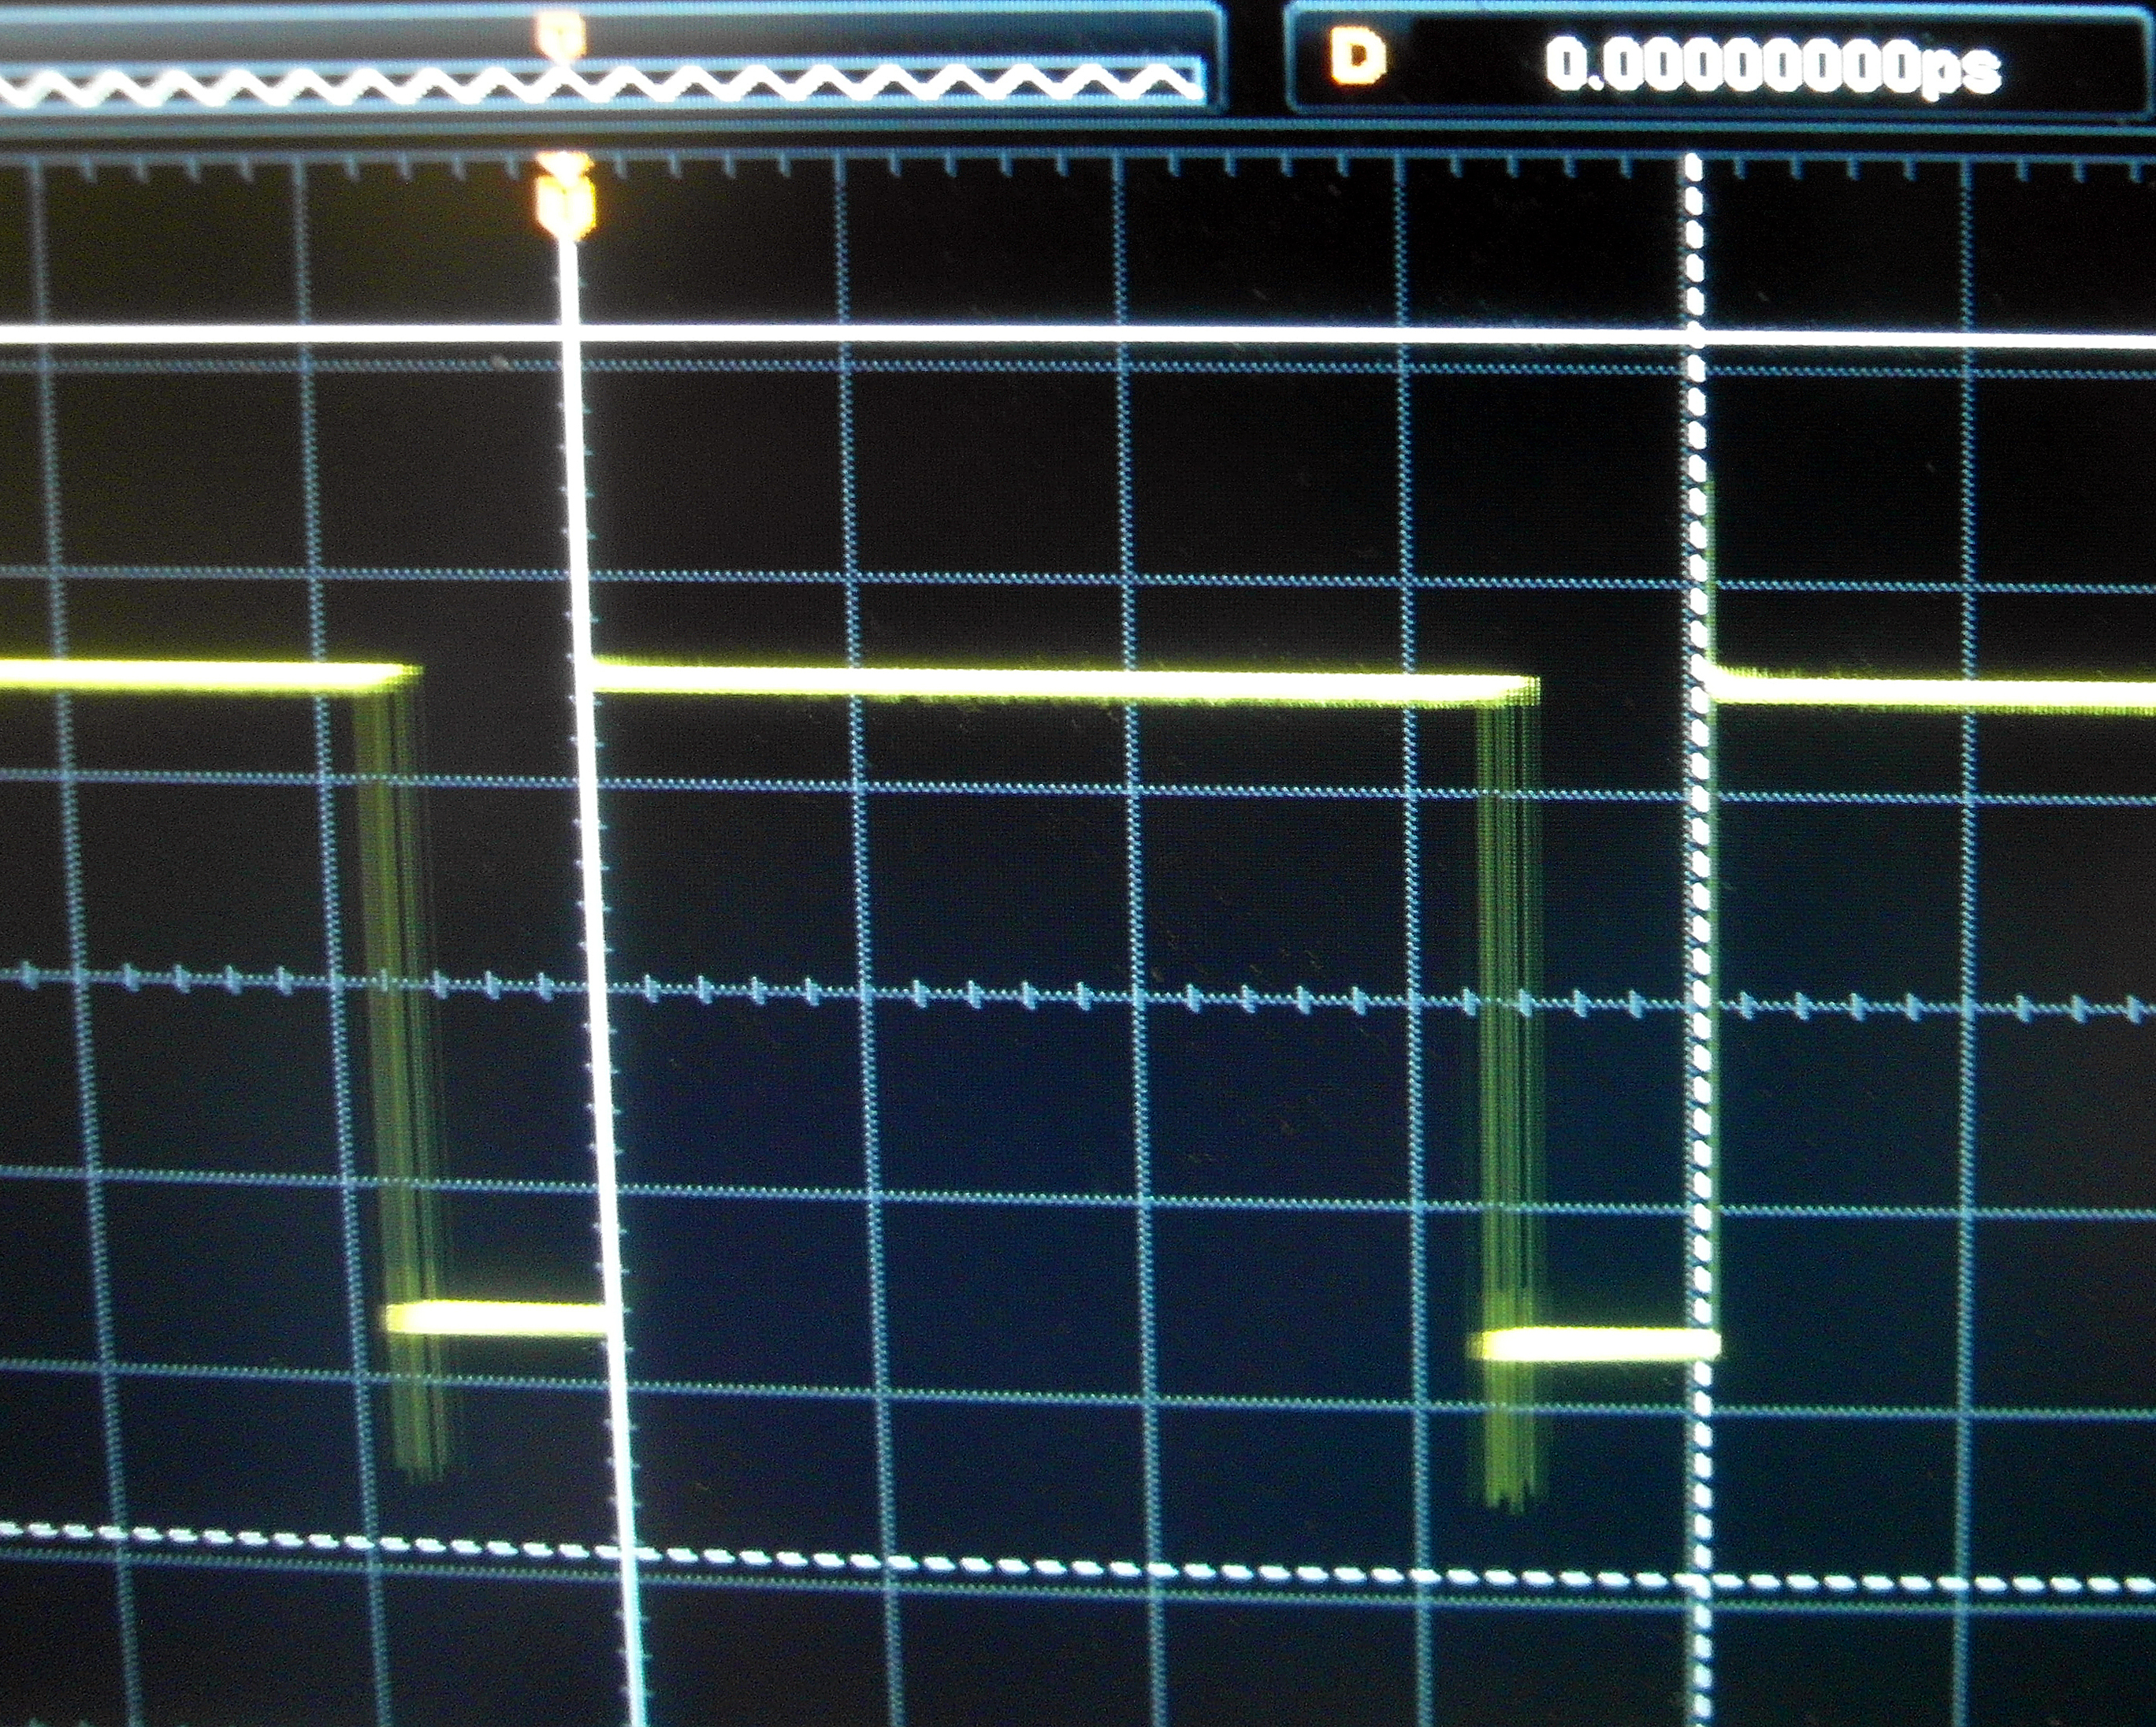
In the third attached still photograph, the LED is On about half the time so we perceive it at about 1/2 brightness.
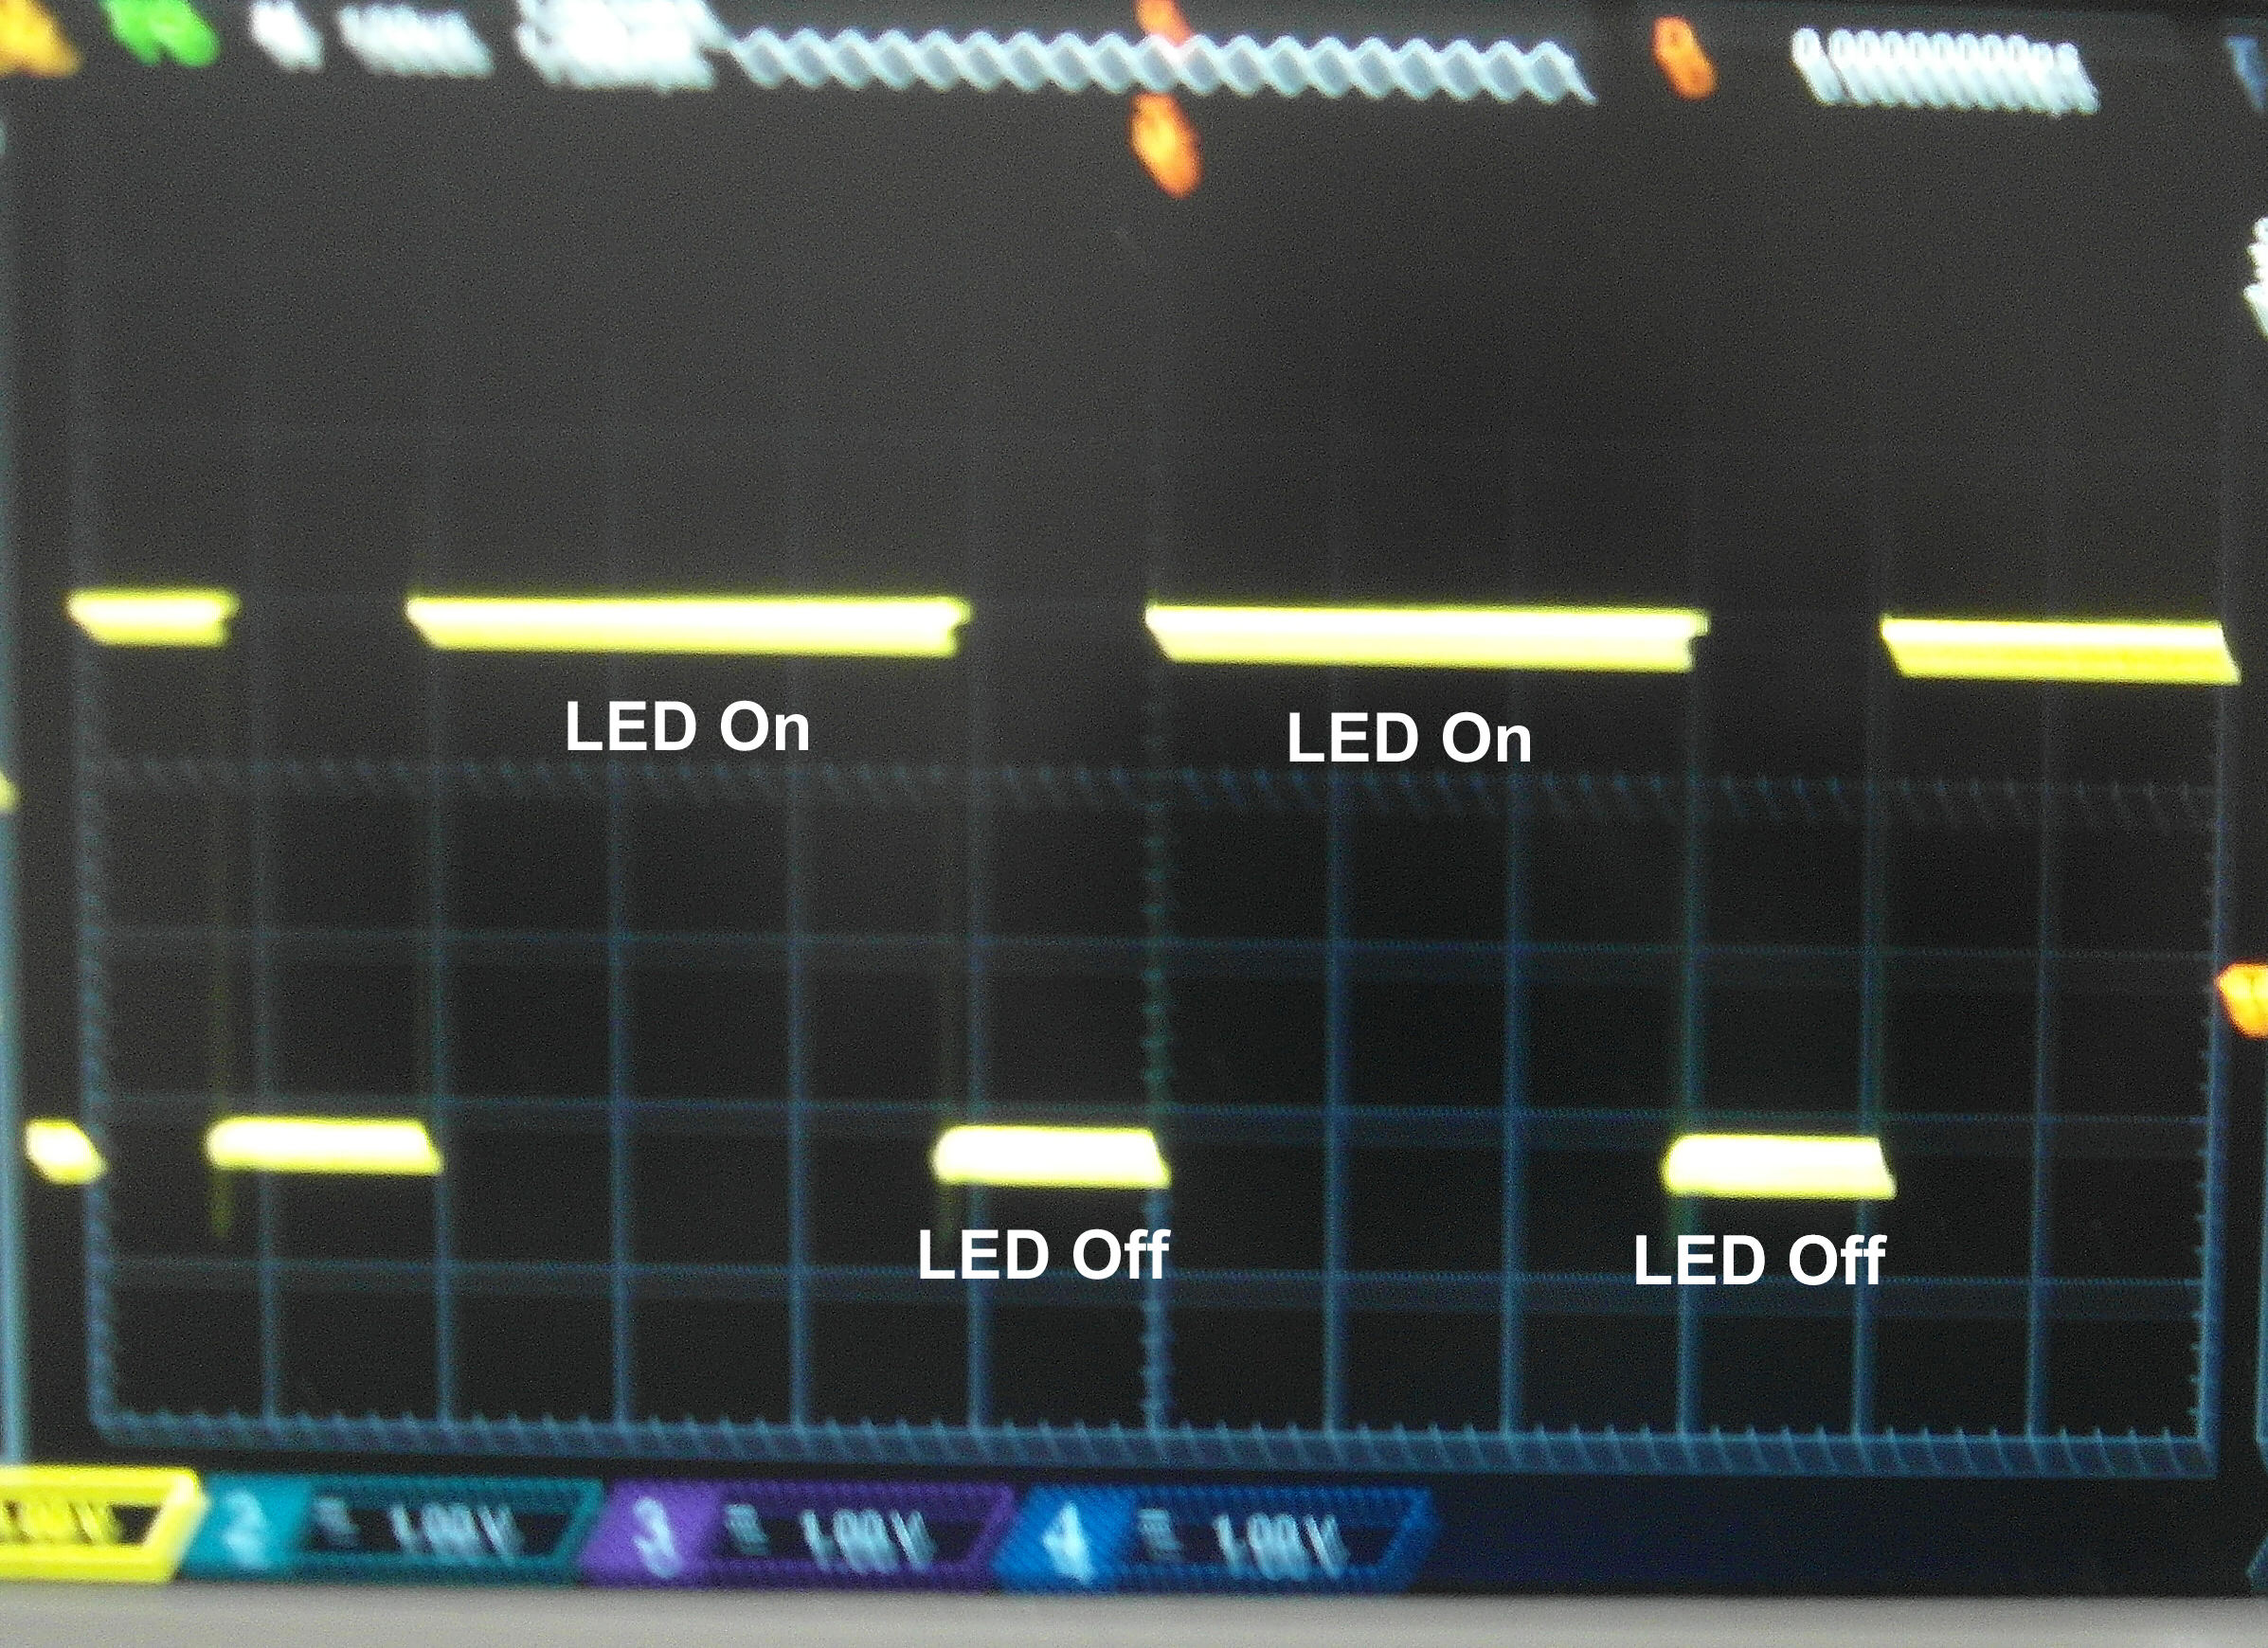
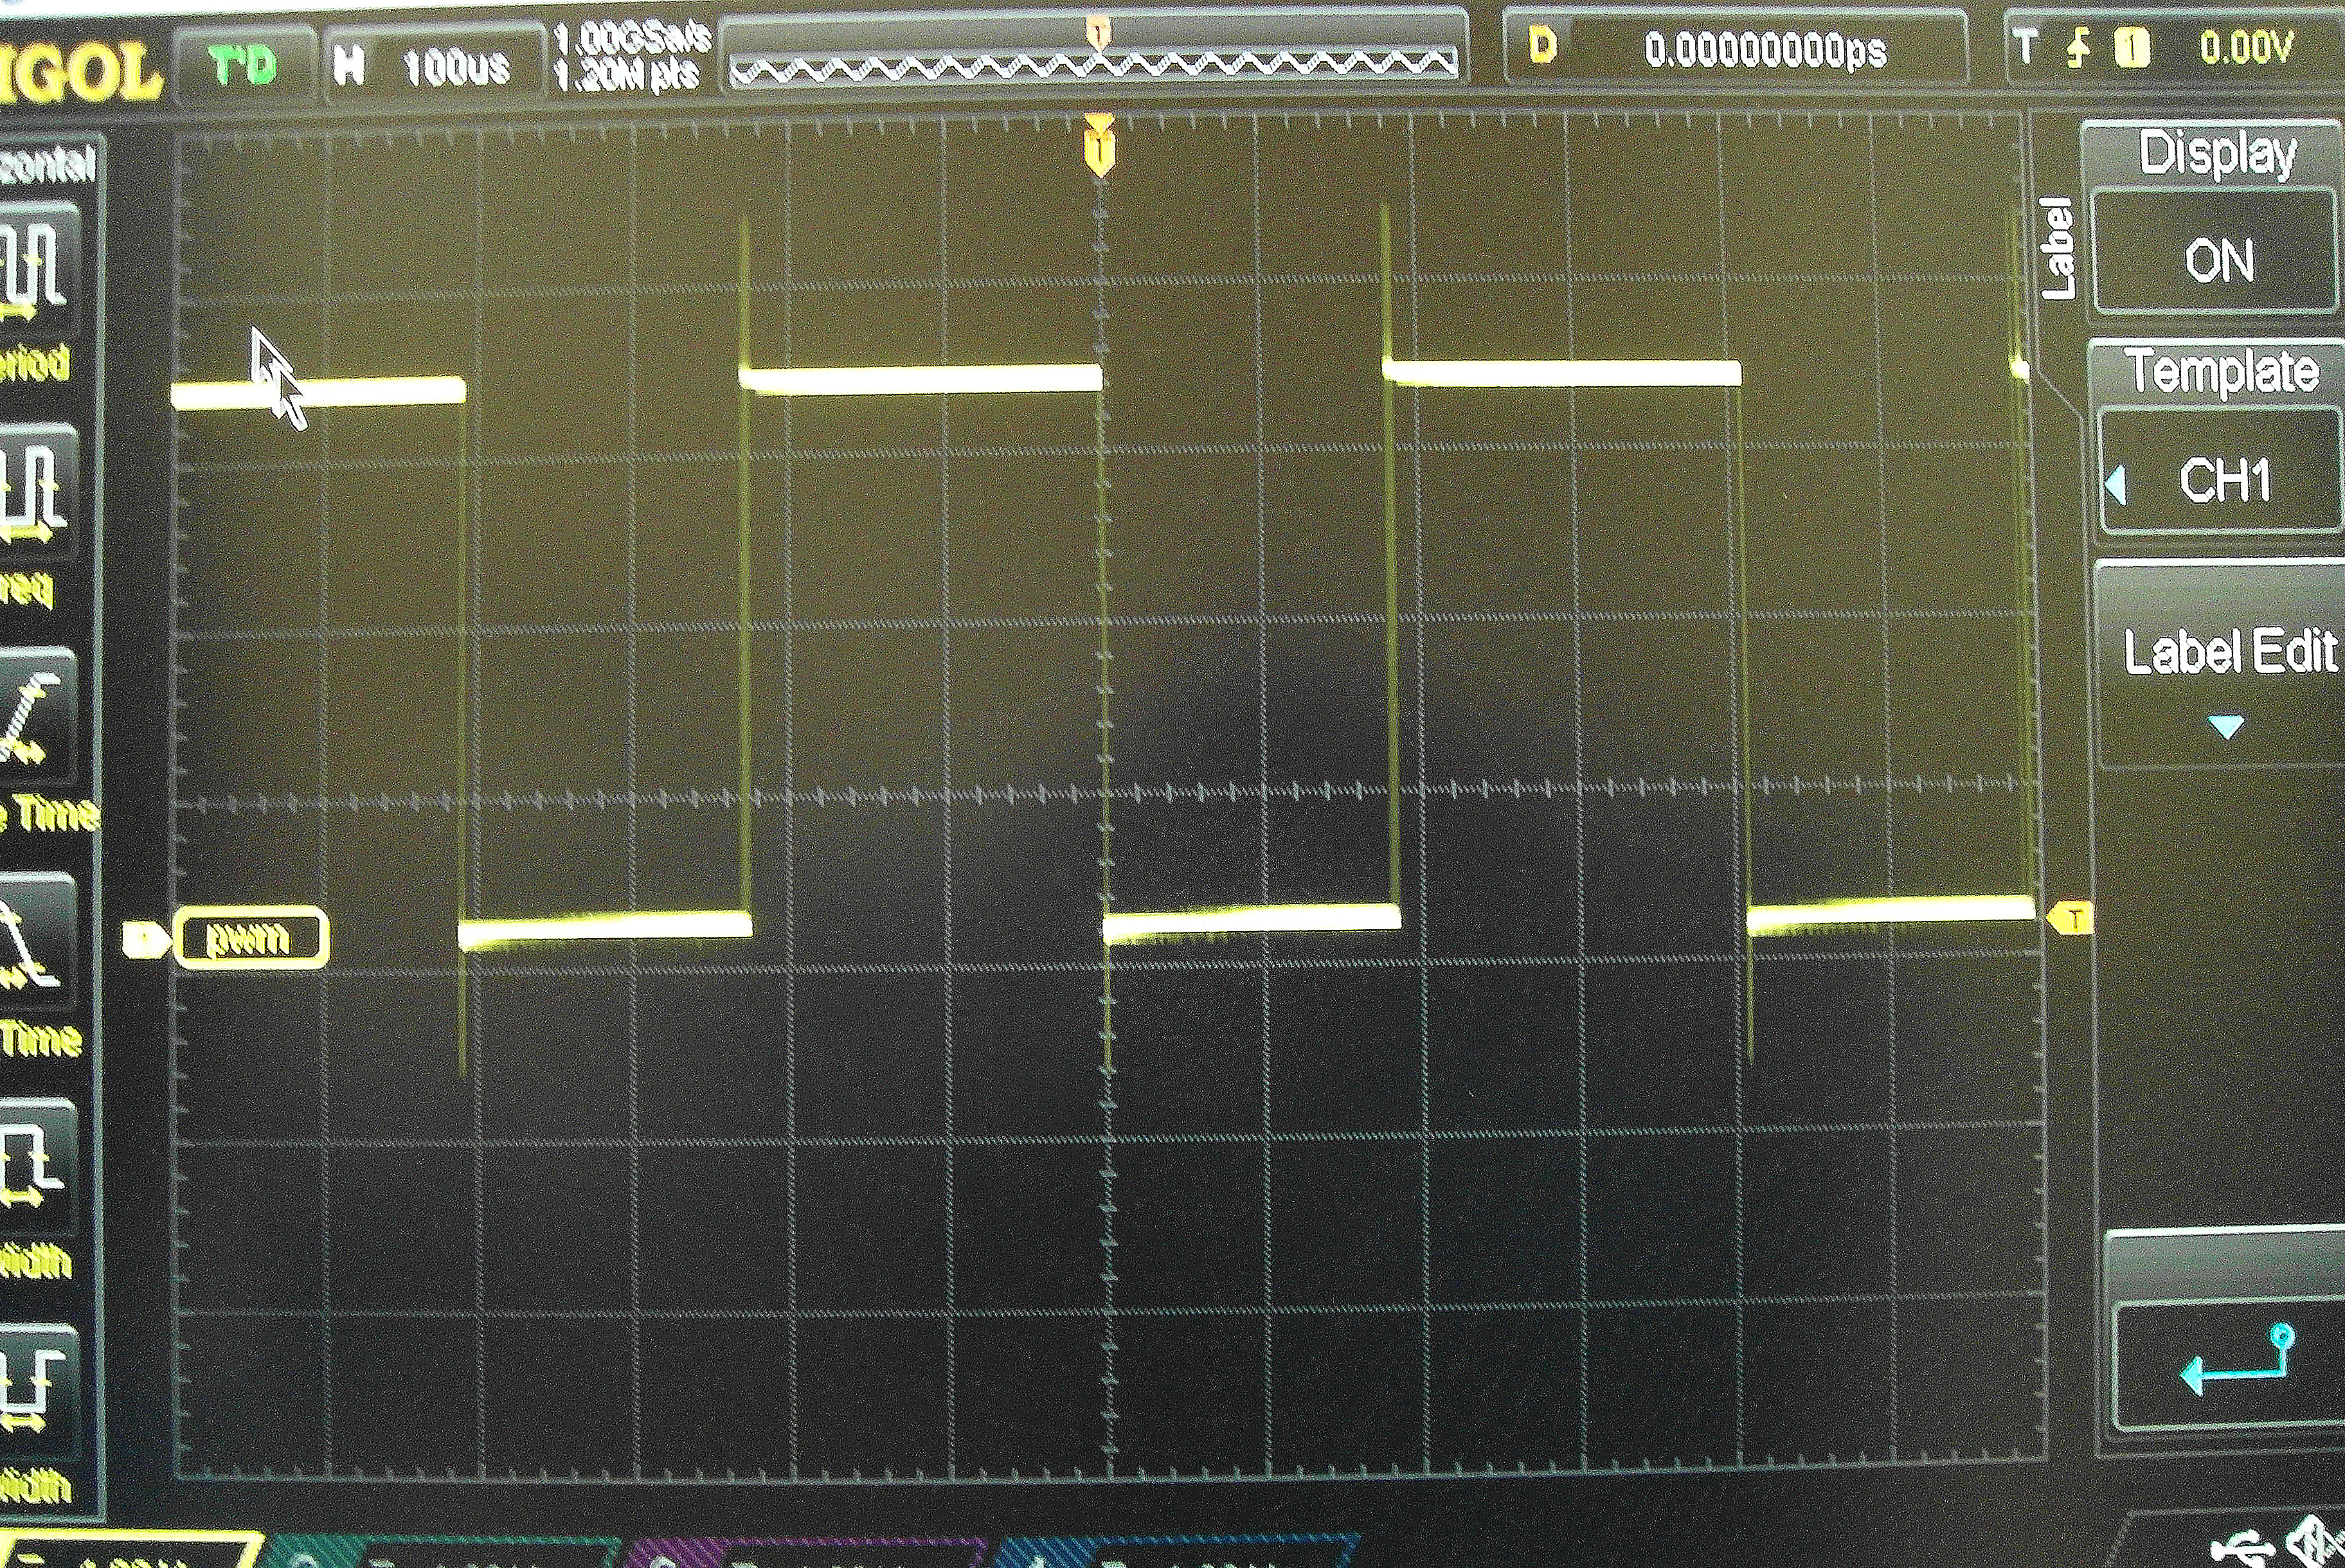
In the fourth attached still photograph the LED is On about 1/3rd of the time and Off about 2/3rds of the time. So, we perceive it at about 1/3rd brightness.
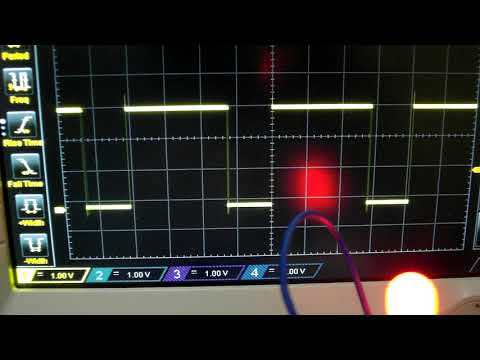
In the fifth attached still photograph, the LED is On almost all the time, so, we perceive that it is almost at its maximum brightness.
In all the above cases, the LED is actually flashing On and Off extremely quickly. However, these On and Offs are faster than the eye, i.e., the cones in the eye, can detect. So, we see the LED as Off, dimly lit, at some level of brightness above dim and below bright, or bright depending on the duty cycle.
In the second video the size of a step was increased to 2,000 and the delay also increased to 2 seconds (see the sketch below). These program changes provide for incremental and discrete changes in brightness that we can see.
In the first video we can clearly see the duty cycle for PWM go smoothly from zero to 100%, and the LED's light concurrently go from its being extinguished to the LED's light at its maximum brightness.
Without the oscilloscope display only the brightness of the LED would be visible to us. Neither a Multimeter or our eyes (i.e., without an oscilloscope) would allow us to see how the PWM signal worked to obtain this changing brightness.
In the second video we see a similar PWM signal, showing brightness and PWM in more discernible, incremental, steps.
_________________________________
This is optional, and Rigol oscilloscope specific: It may be useful if one decides to save the signal to label the x-axis, so in the future we will know that this is the PWM signal we saved.
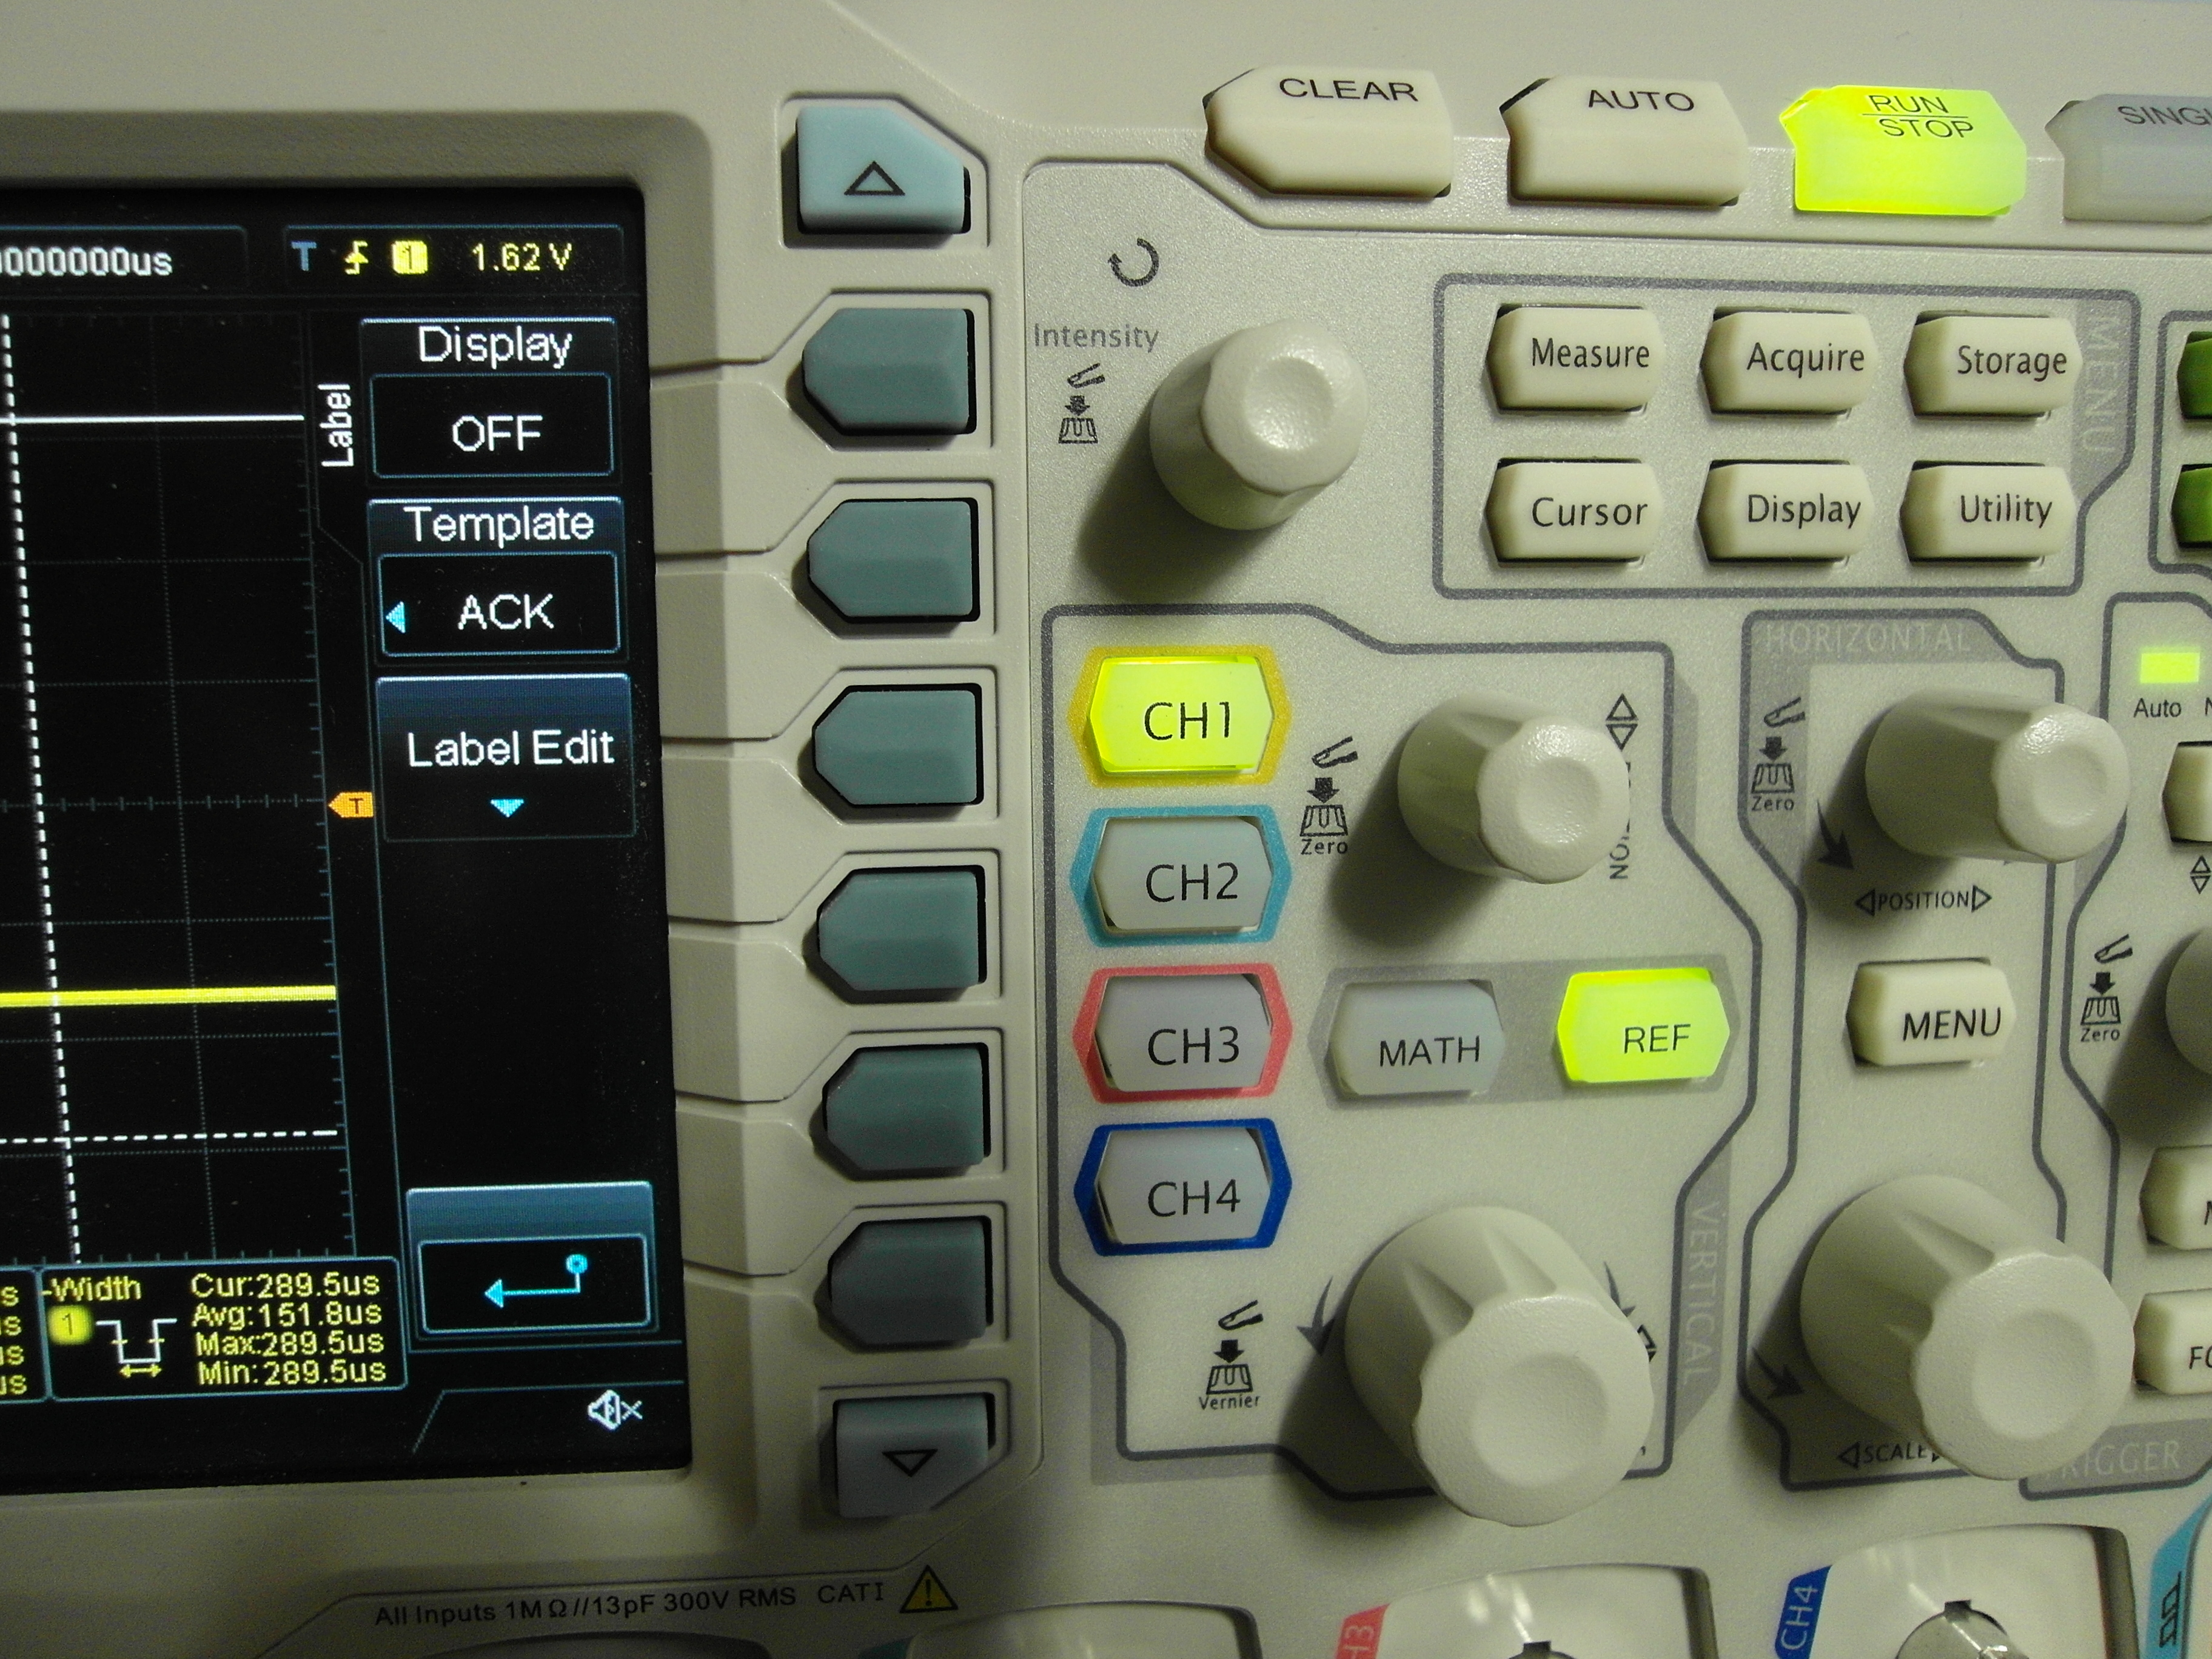
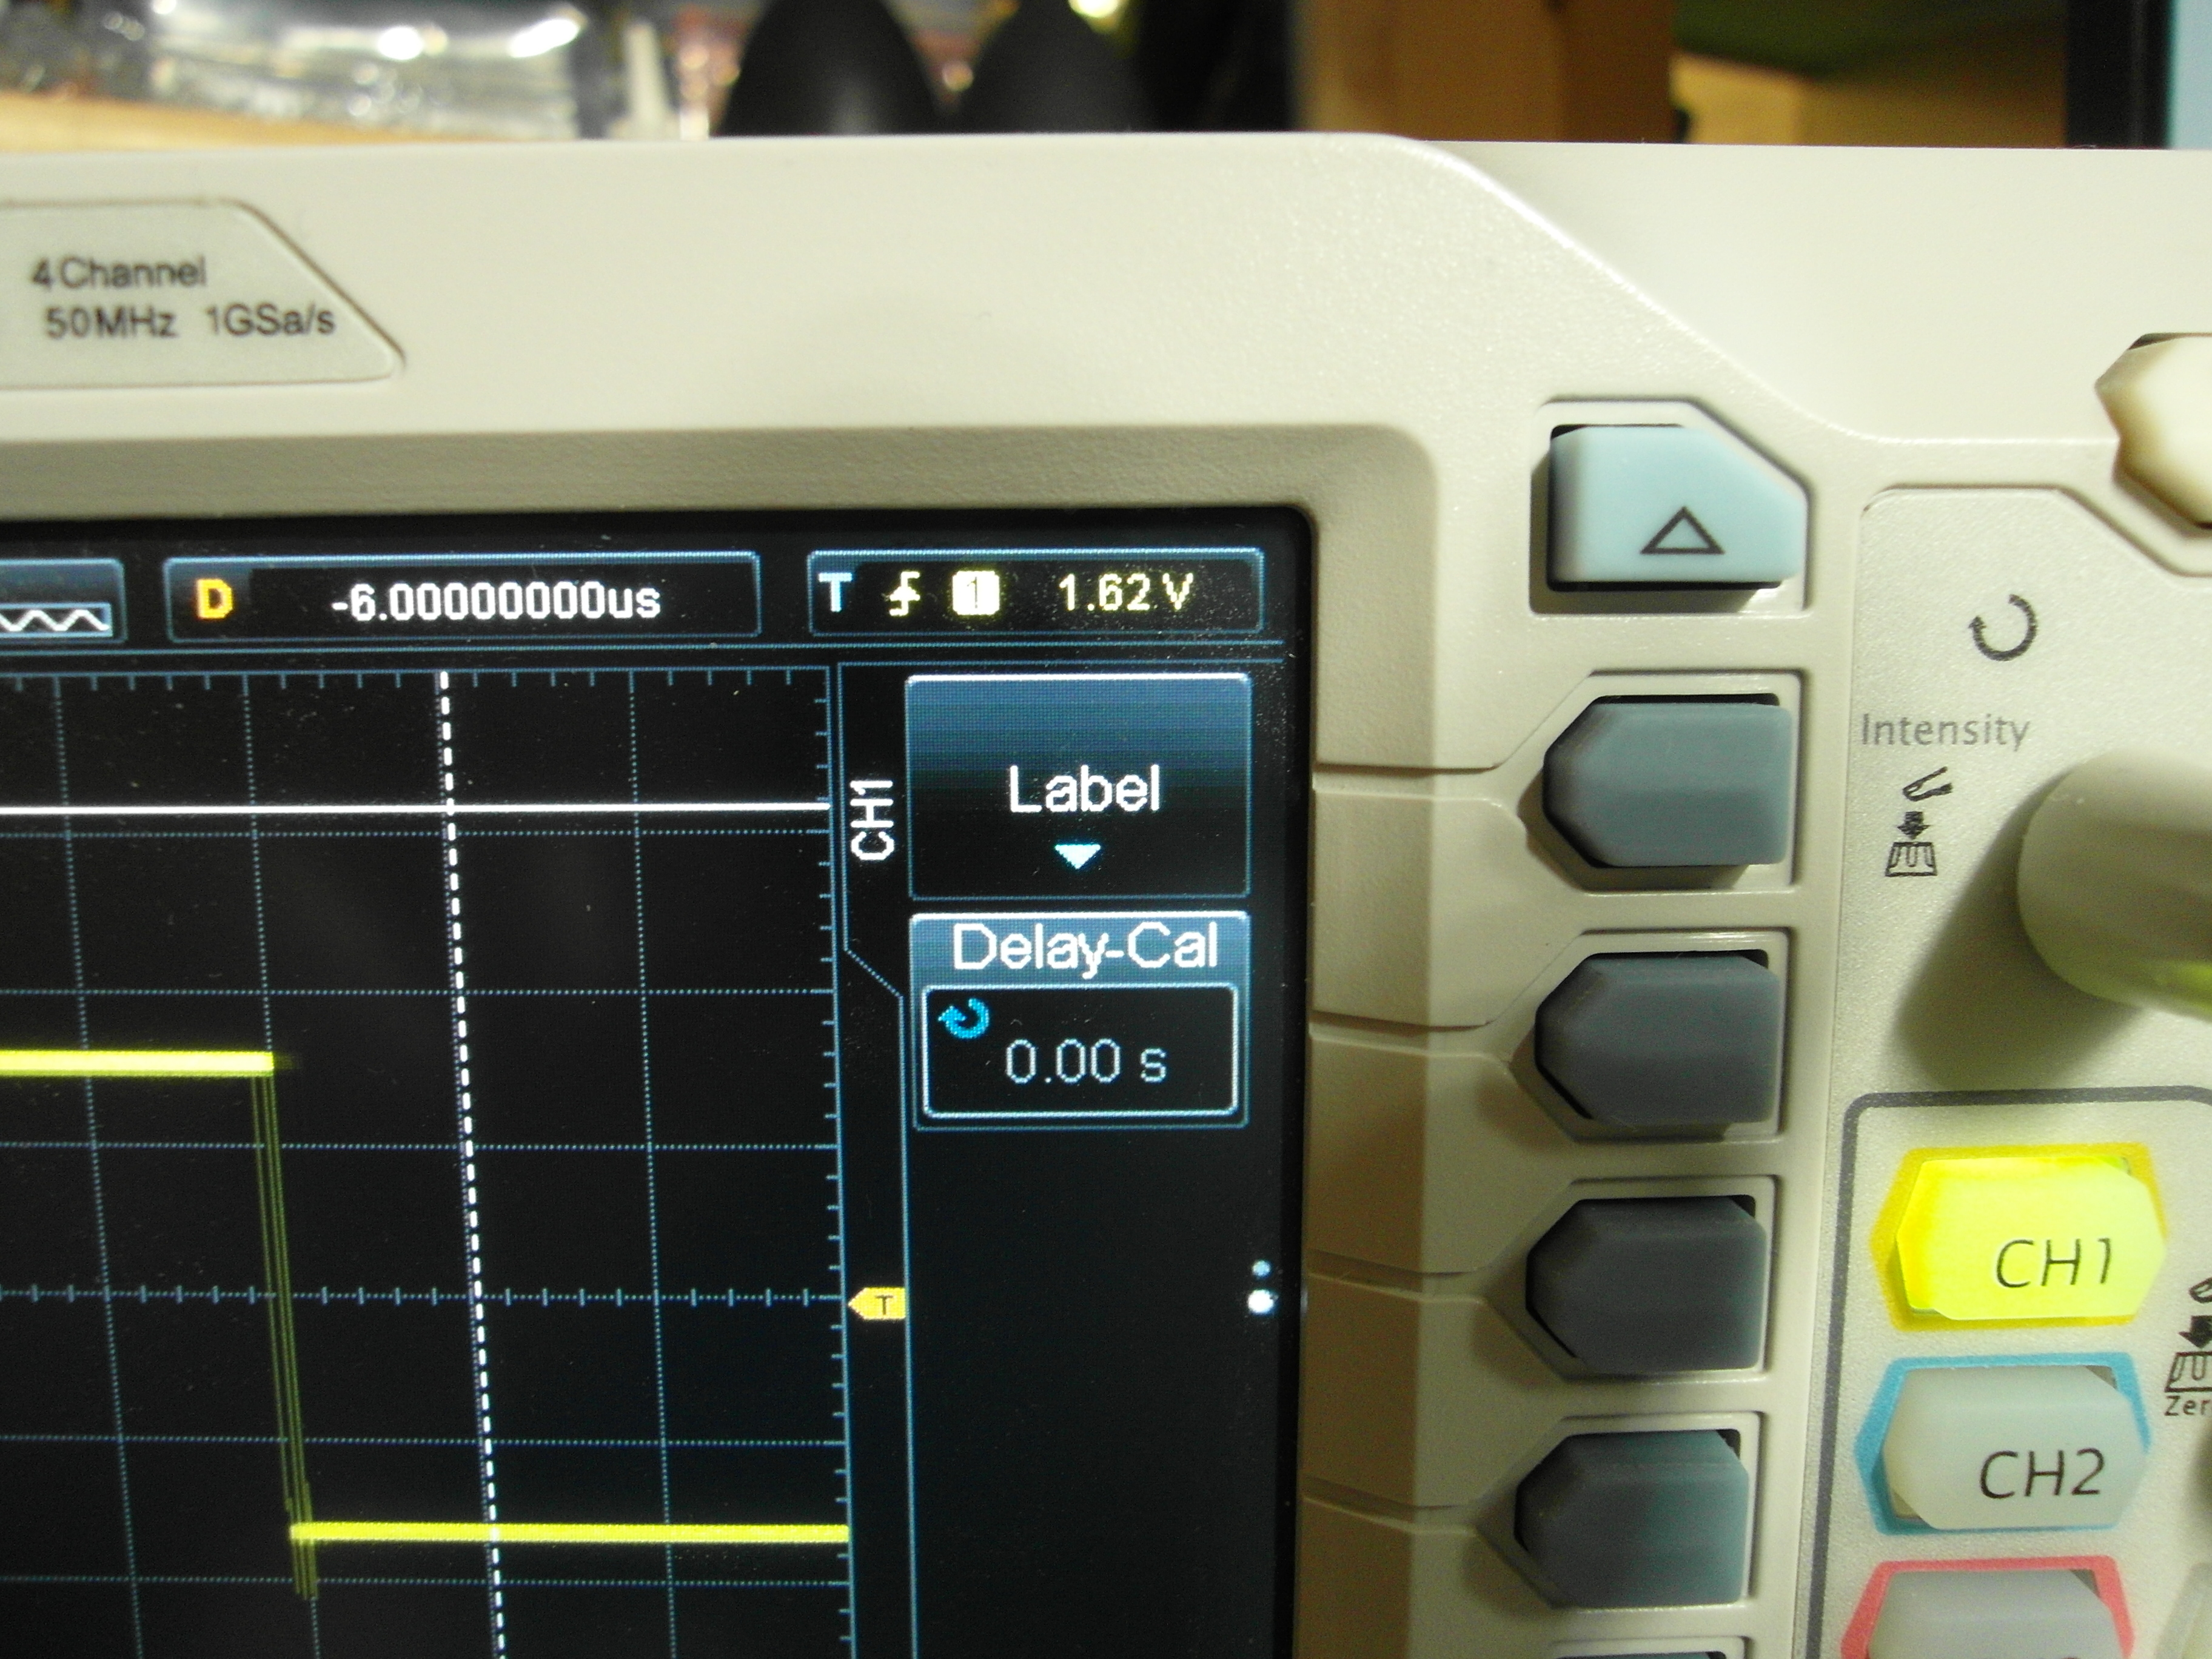
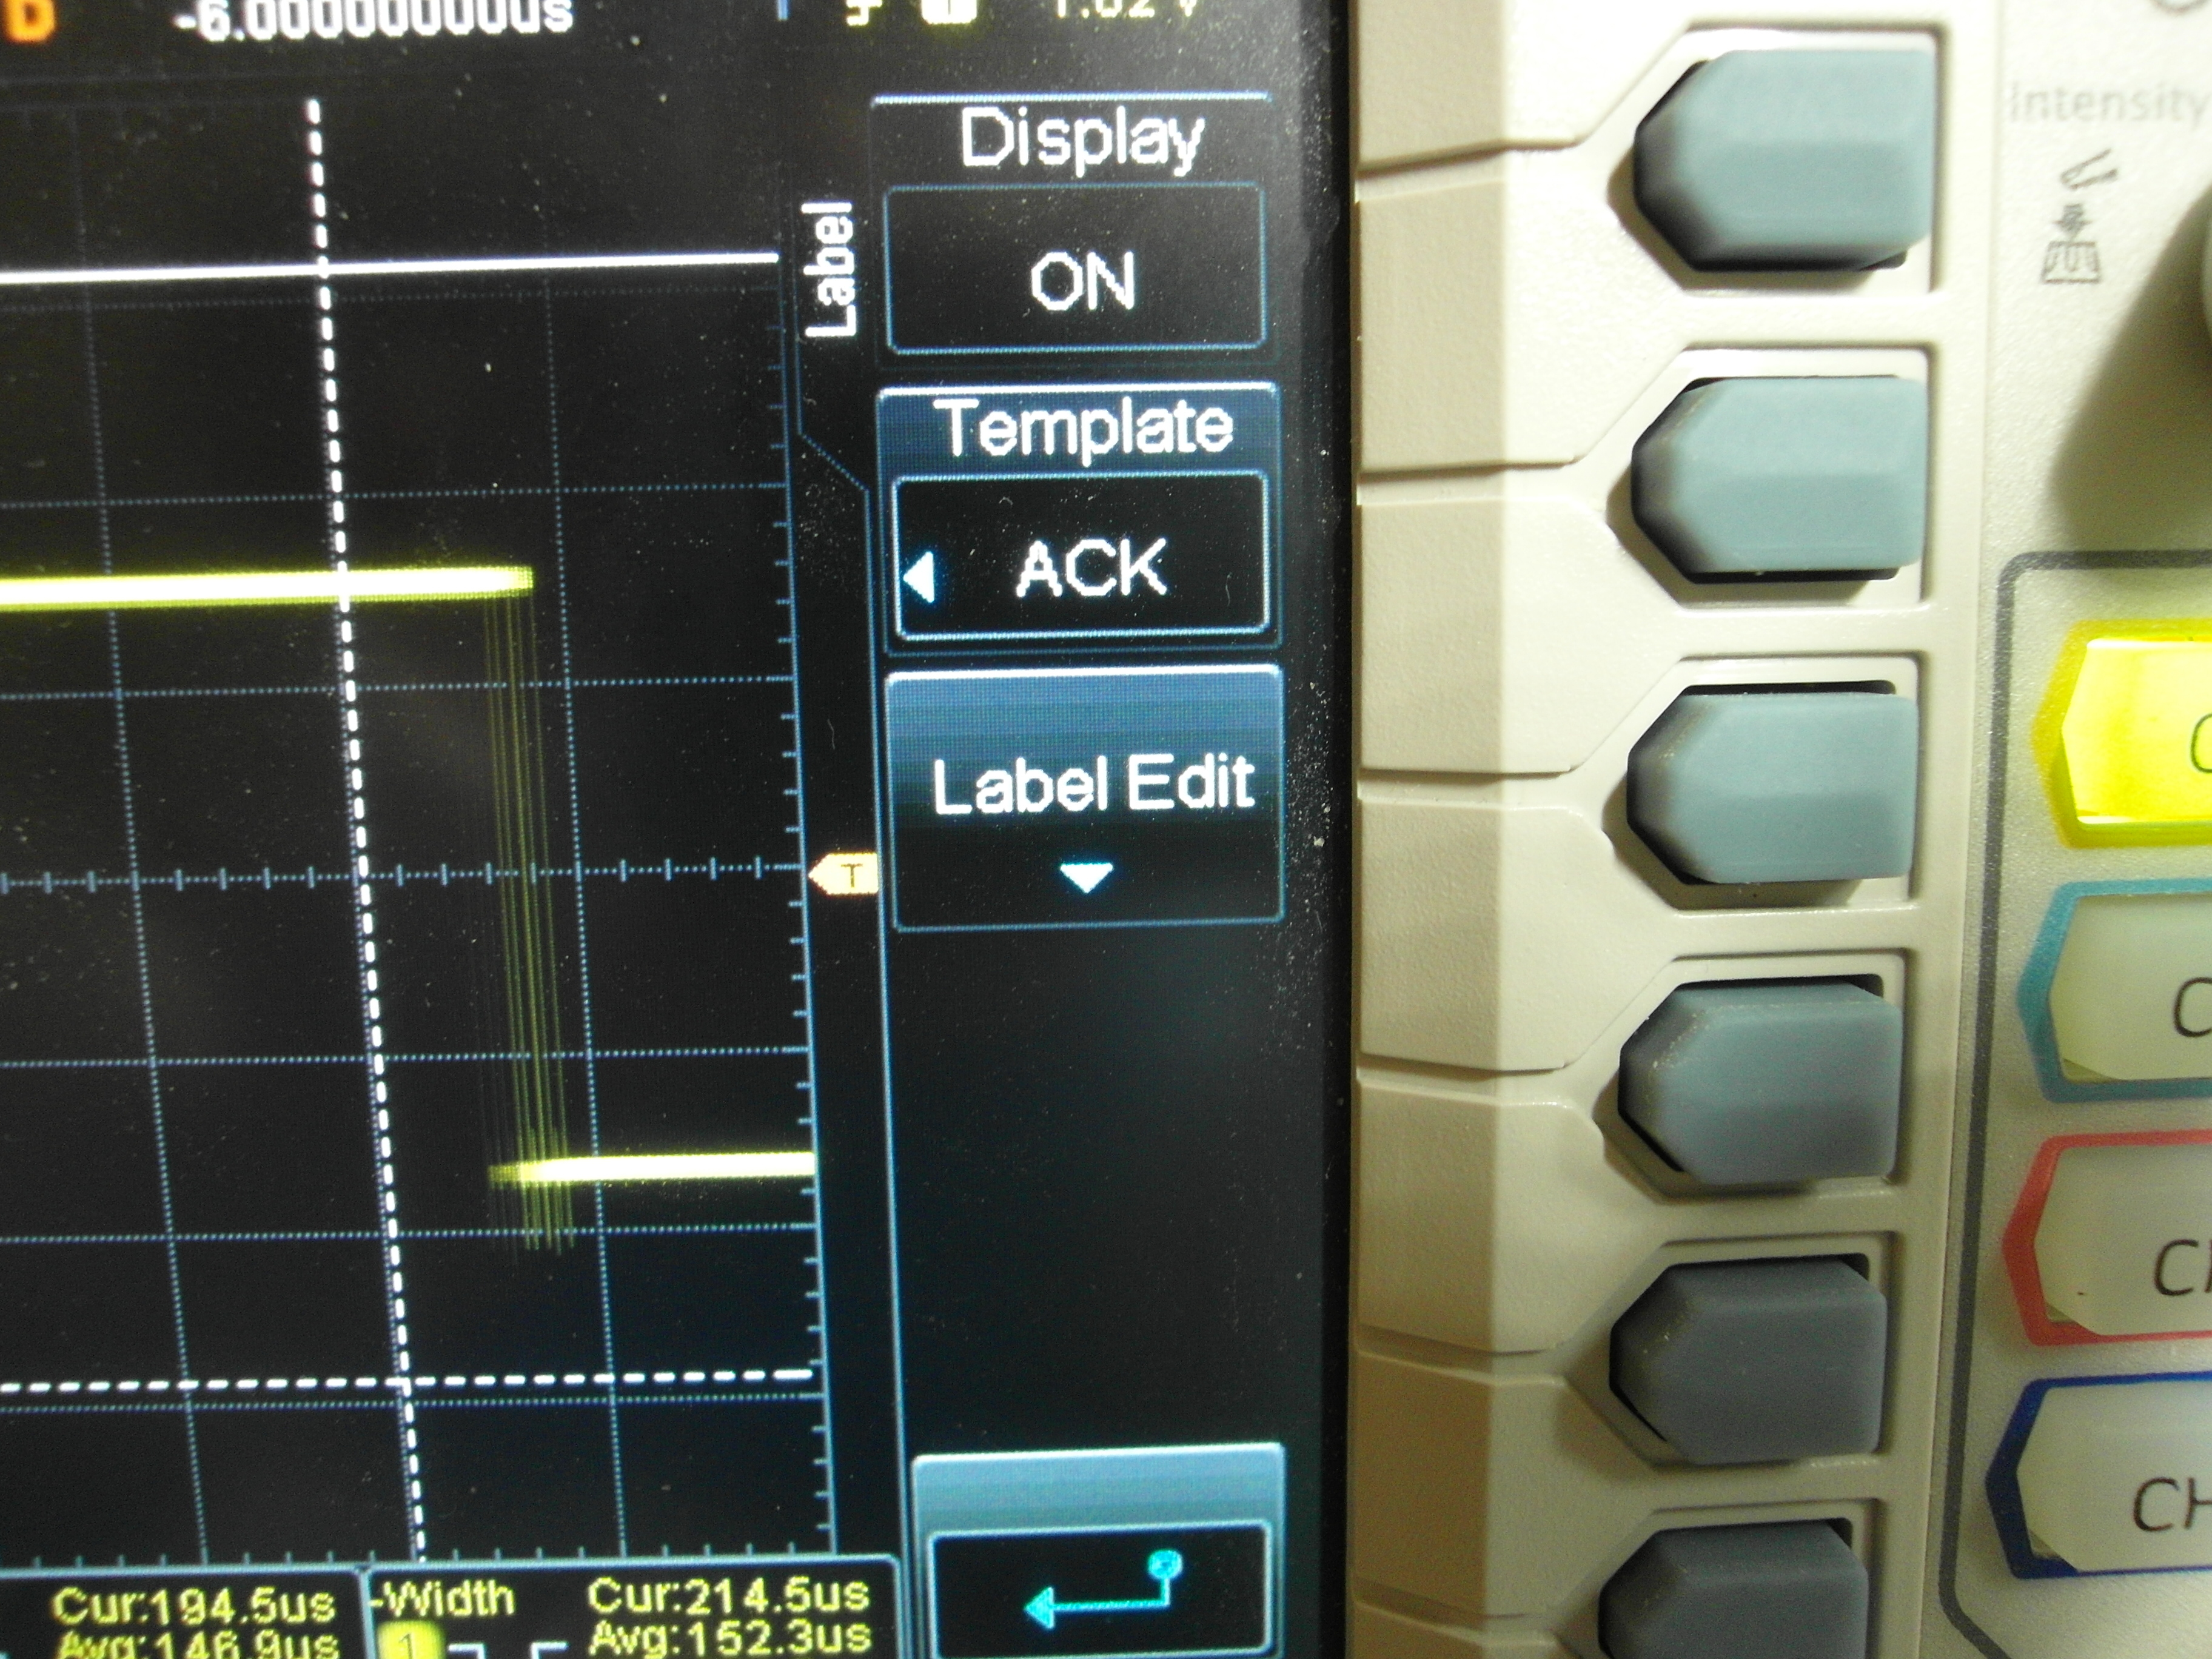
To do this, on the Rigol oscilloscope used here, press channel 1 (CH1), then the down arrow on the right side of the oscilloscope display. Select Label, then Label Edit. A keyboard will appear in the middle of the display.
Obviously, this process will be different on different brand oscilloscopes.
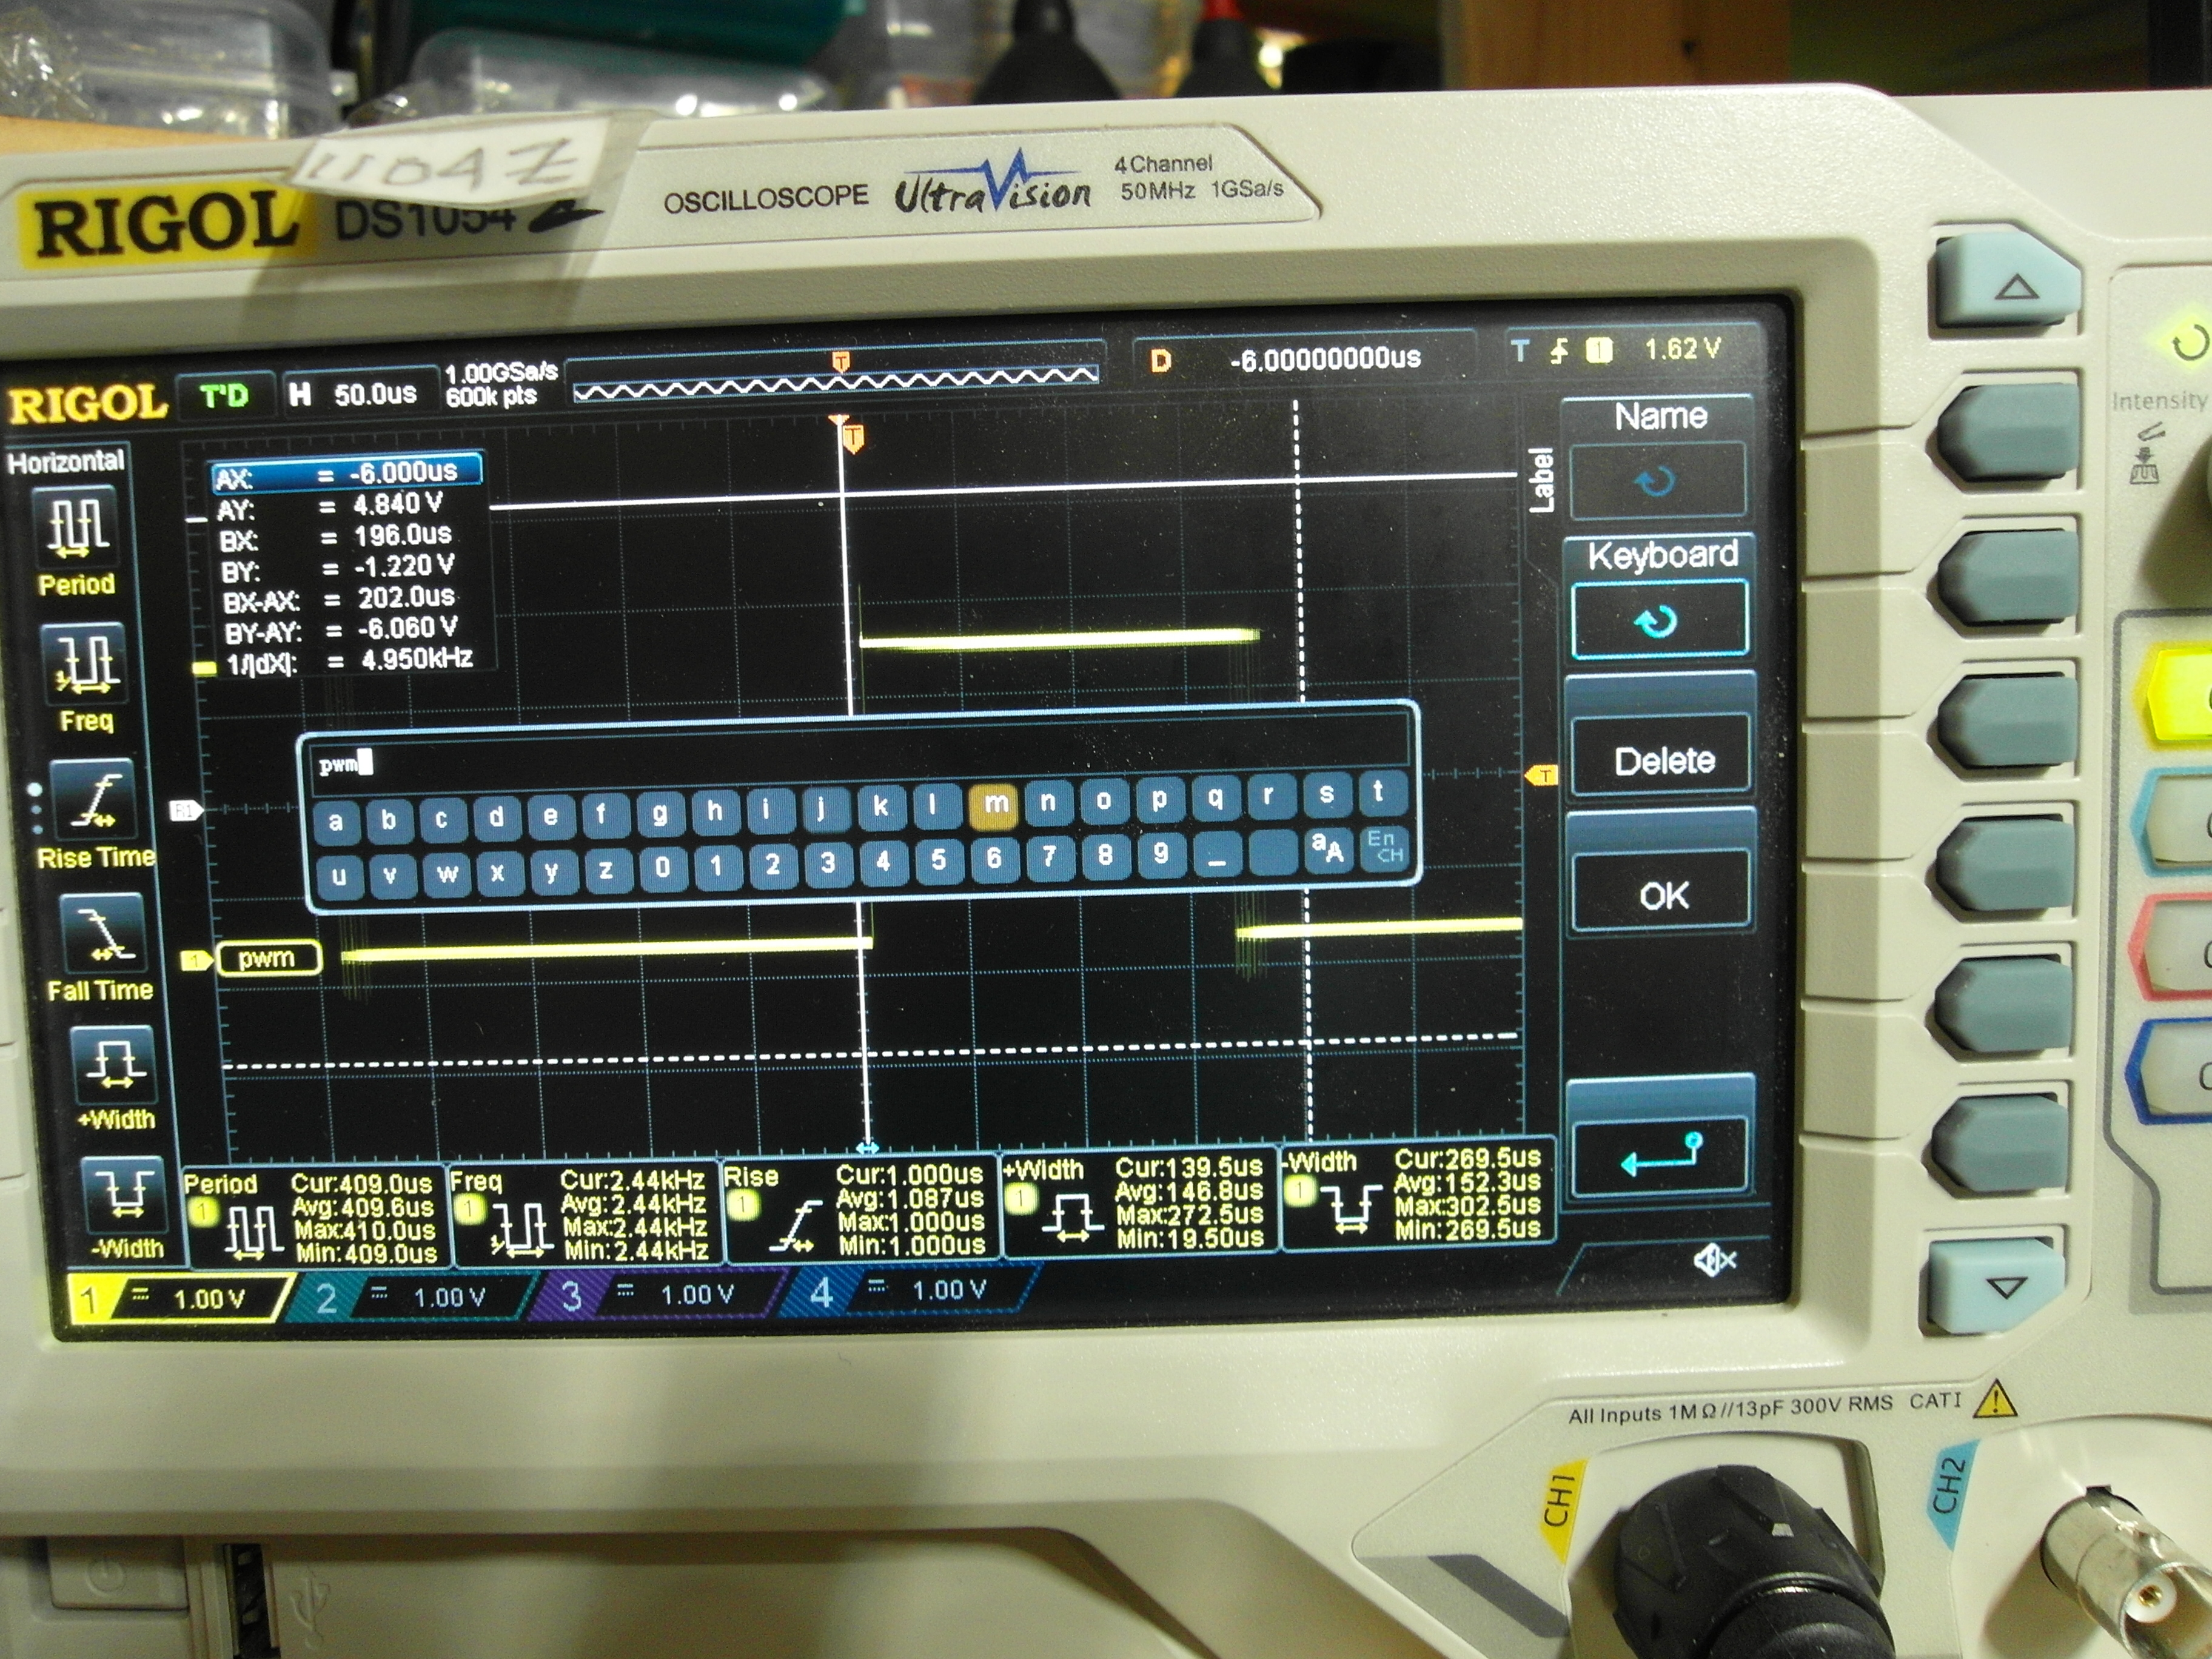
Use the upper leftmost knob, on the Rigol used here, to select the letters "pwm". The 2nd row of the screen keyboard is selected by turning the knob past the 1st row. In a similar manner the 1st row is then selected, if you are on the 2nd row, by moving the knob past the second row.
A letter is selected by using the upper, leftmost knob to place the selection color over the letter and pressing the knob to select the letter we are over.
(See the attached photos.)
An attached picture shows the results, where the x-axis is labeled "pwm".
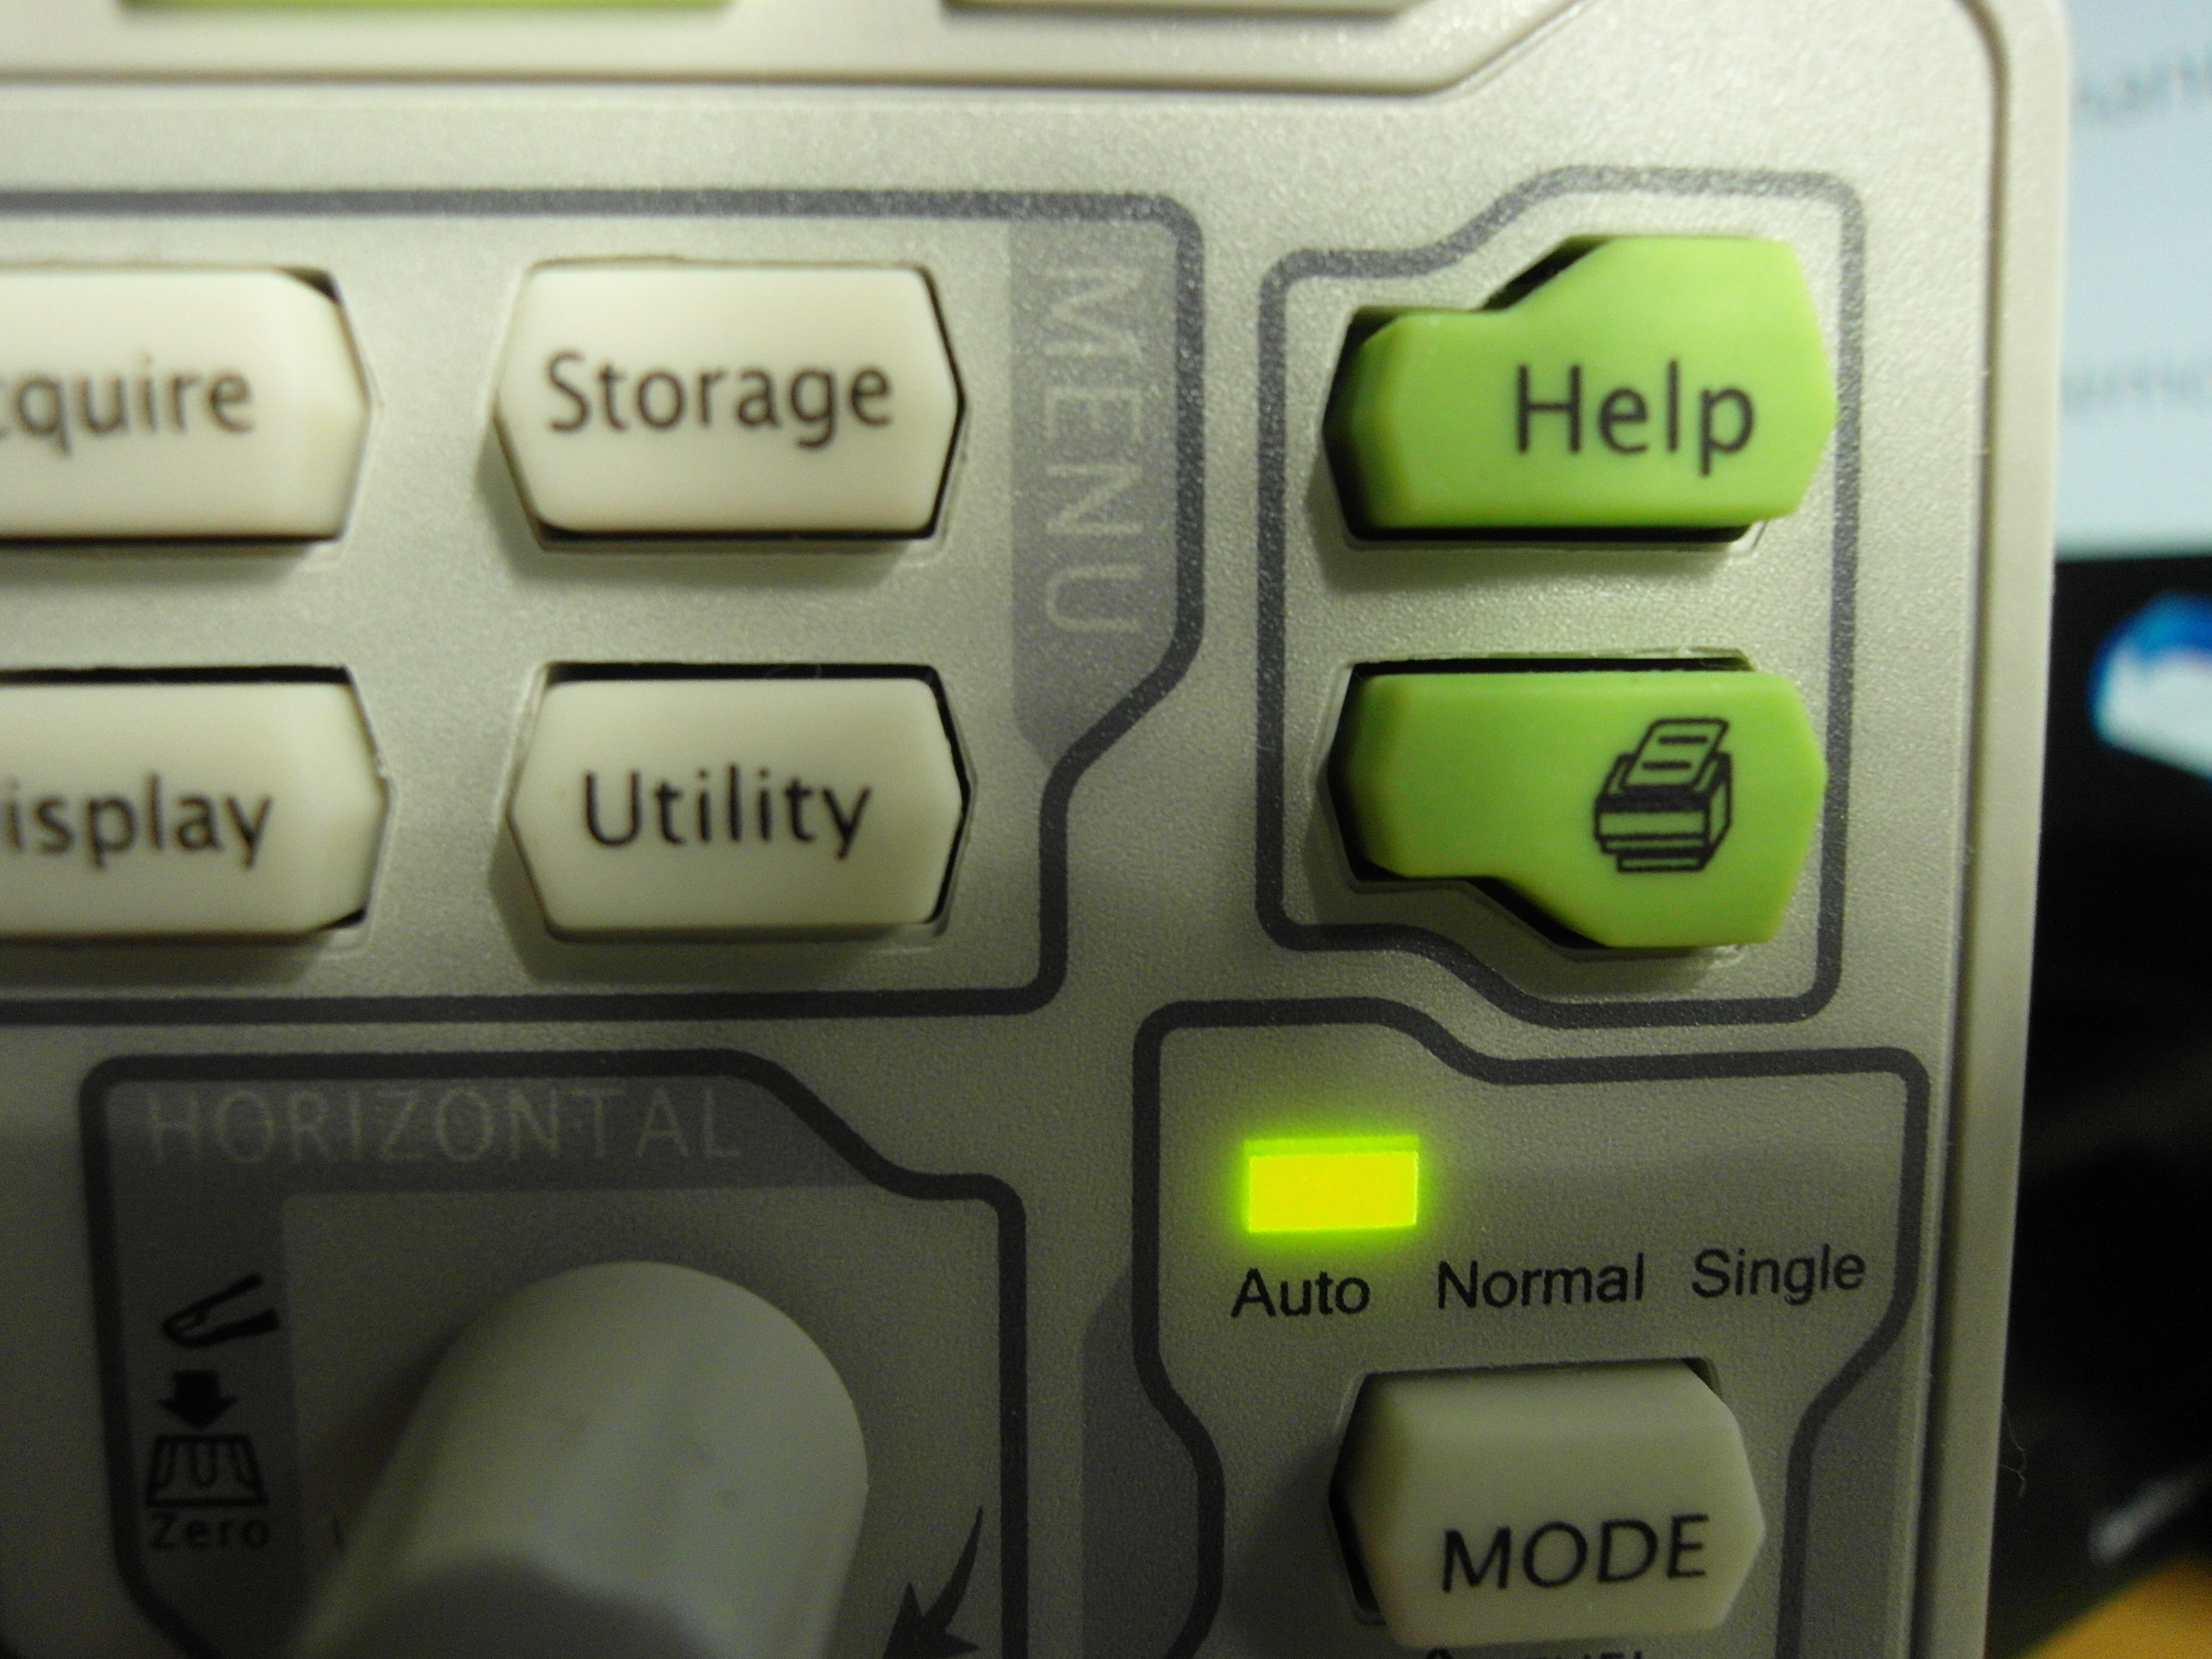
The final results can be saved to a Fat formatted USB drive, placed into the oscilloscope, and pressing the printer (lowest green) icon button on the oscilloscope used here (See photographs).
Since a Rigol oscilloscope is popular among many makers, although arguably not the top of the line in oscilloscopes, the above may prove useful to many readers, and so is worth including here, even though the material, as used here, is specific to the Rigol oscilloscope shown in this Instructable.
At the end of this Step is a still picture showing the signal as captured from the oscilloscope onto a USB flash drive, and displayed on a monitor.
This ends the optional material started immediately above.
_________________________________
As previously noted, one program that does this is shown below.
/*
* Program by R. Jordan Kreindler
* showing the use of the PWM capabilities
* of an ESP32 Development board. */
#define ledChannel 0 // Channel 0 chosen, from 0-15 choices
#define resolution 15 // Resolution is chosen as 15 bits
#define frequency 5000 // 5,000 Hz frequency
#define LED 15 // LED connected via 330 ohm
// resistor to pin 15
// Other end of LED
// to GND
int delay1 = 2000; // Delay in milliseconds = 2 seconds
void setup() {
ledcSetup(ledChannel, frequency, resolution); // Set-up a channel
ledcAttachPin(LED, ledChannel); // Attach a channel to a pin }
void loop() {
// In the for() loops, adding and subtracting
// two hundred (2000) is necessary owing to the greater
// resolution provided by 15 bits, compared to the UNO
// and the desire to "see" the brightness changes
for (int i = 0; i < 32768; i = i + 2000) { //loop to fade up
ledcWrite(ledChannel, i);
delay(delay1);
}
for (int i = 32767; i > -1; i = i - 2000) { //loop to fade down
ledcWrite(ledChannel, i);
delay(delay1);
}
}
Fortunately, these changes only required minor modifications of the original program.
We can now see on the oscilloscope that when the PWM signal has it maximum Duty Cycle the LED is at its maximum brightness. Conversely, when the Duty Cycle is zero the LED light is extinguished.
Downloads
Afterwards

If you have come to this point - congratulations. You should now have a basic understanding of one way to show PWM on an oscilloscope, i.e., as covered in this tutorial. I hope you found this Instructable interesting and of value.
Also, if you liked this Instructable, please be kind enough to check "Favorited" box at the top of this Instructable. Thank you.
If you have any comments, suggestions, or questions related to this Instructable, please add these to the comments below, if there are any.
If you have any thoughts or questions, related to PWM in general, but not covered in this Instructable, or any suggestions for how I could improve this Instructable, I would be pleased to hear from you. You can contact me directly at transiintbox@gmail.com. (Please replace the second 'i' with an 'e' to contact me).