Room Monitoring With Python
by phidgeteer in Circuits > Raspberry Pi
486 Views, 1 Favorites, 0 Comments
Room Monitoring With Python
In this project, you will learn how to do the following:
- Create a Python script that gathers data from a variety of Phidget sensors and logs them to a file
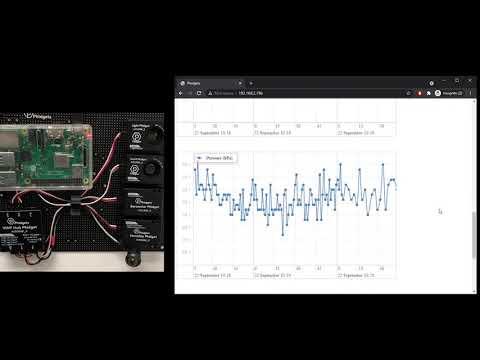
- Display the data on a website hosted on your Raspberry Pi
Supplies
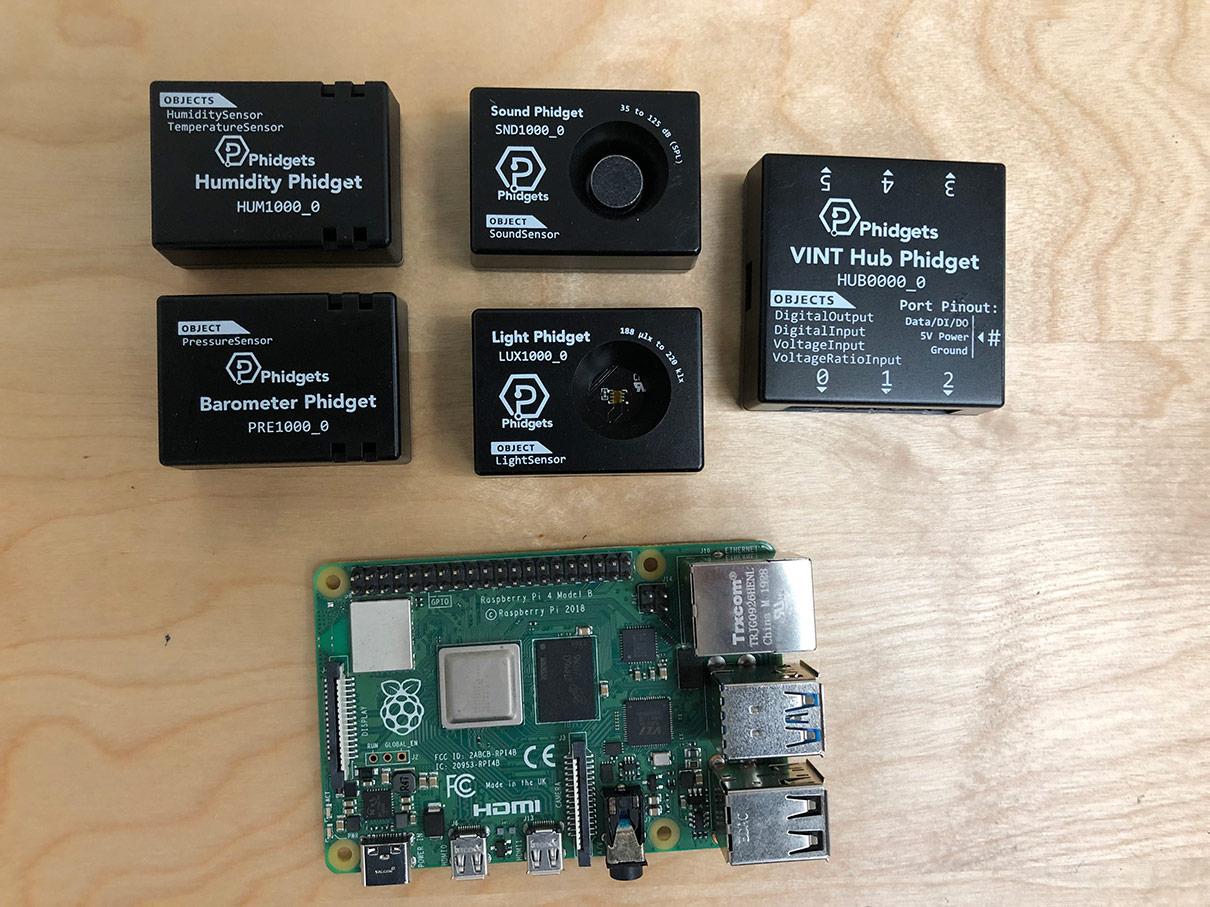
The following sensors are used:
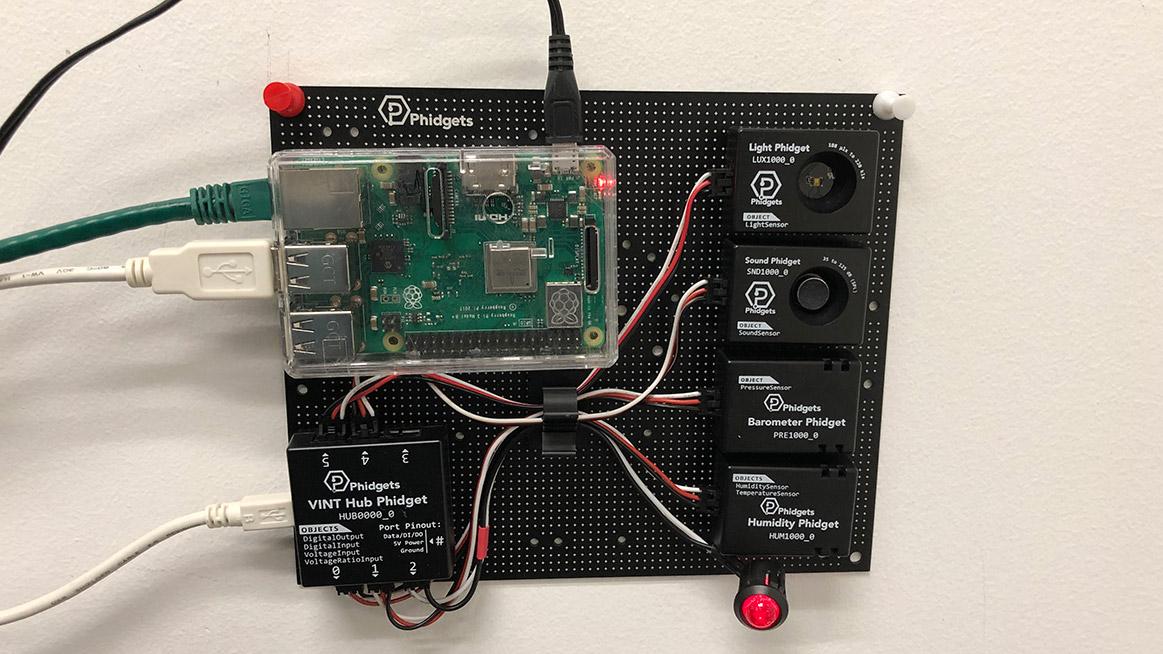
- Phidgets VINT Hub
- Humidity Phidget
- Barometer Phidget
- Light Phidget
- Sound Phidget
- Status LED (taken from Getting Started Kit)
You can use all the sensors, some, or entirely different sensors for this project, as long as they have a Python API.
Setup
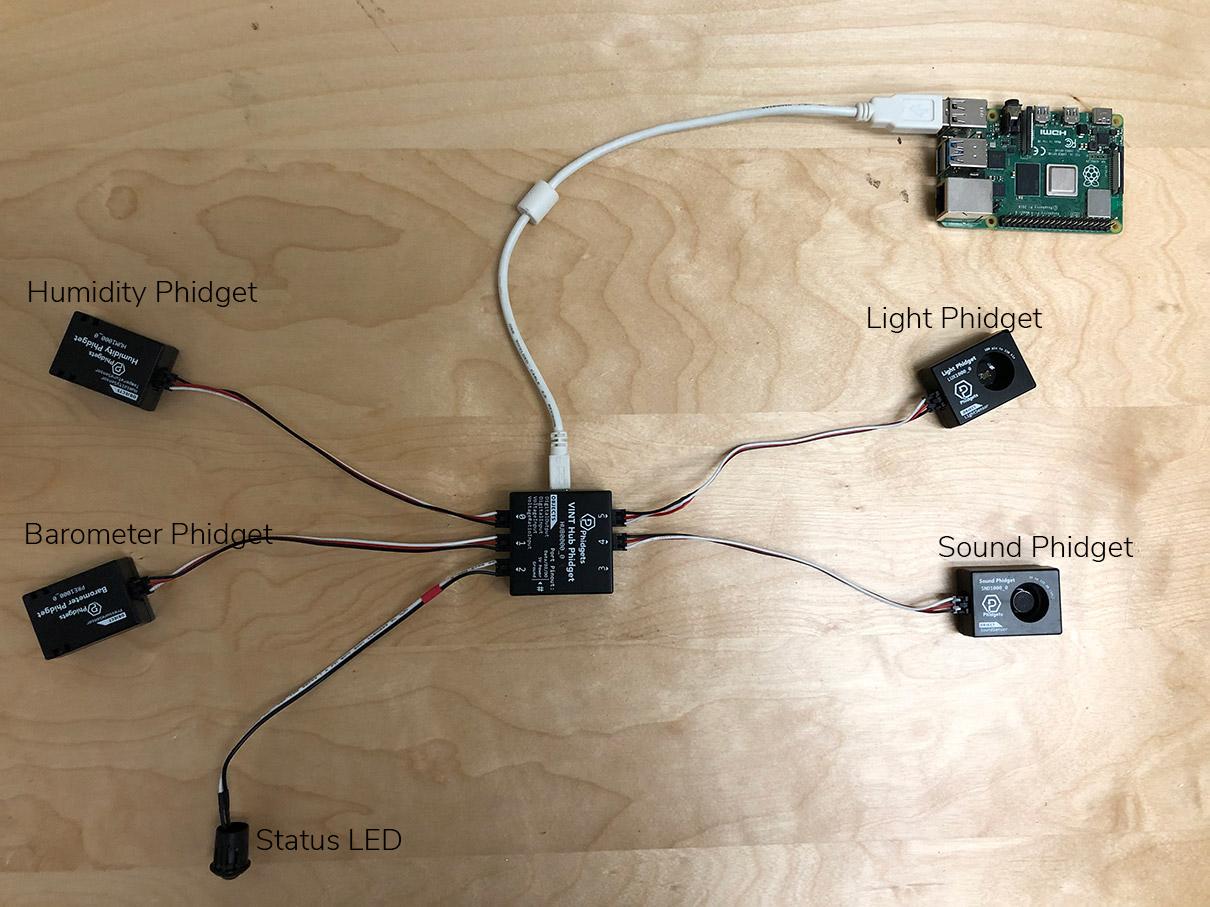
Connect your sensors to your VINT Hub as shown above. The code examples below will use the orientation shown above (i.e. Status LED on port 2).
Overview
The goals of this project are as follows:
- Create a Python program that connects to sensors and logs data to a file every X seconds (your choice on how much data you want to collect)
- Host a webpage on the Raspberry Pi that displays the collected data.
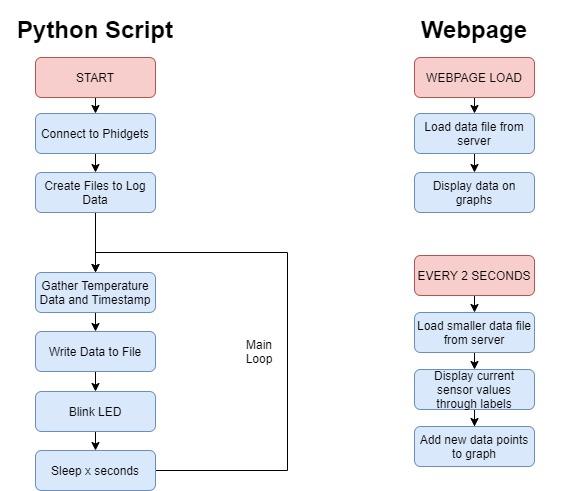
The flowcharts above show what each program should look like.
Software Setup
Install the Phidget libraries on your Raspberry Pi. This tutorial shows how to do that.
Set up an Apache Web Server on your Raspberry Pi. Documentation.
Write Code - Python
Copy the code below into a new Python script on your Raspberry Pi
#Add Phidgets library
from Phidget22.Phidget import *
from Phidget22.Devices.TemperatureSensor import *
from Phidget22.Devices.LightSensor import *
from Phidget22.Devices.HumiditySensor import *
from Phidget22.Devices.PressureSensor import *
from Phidget22.Devices.SoundSensor import *
from Phidget22.Devices.DigitalOutput import *
#Used to get current time
from datetime import datetime
#Required for sleep statement
import time
#Check file status
import os

#Create
temp = TemperatureSensor()
light = LightSensor()
hum = HumiditySensor()
pressure = PressureSensor()
sound = SoundSensor()
statusLED = DigitalOutput()

#Address
statusLED.setHubPort(2)
statusLED.setIsHubPortDevice(True)

#Open
temp.openWaitForAttachment(1000)
light.openWaitForAttachment(1000)
hum.openWaitForAttachment(1000)
pressure.openWaitForAttachment(1000)
sound.openWaitForAttachment(1000)
statusLED.openWaitForAttachment(1000)

#Write Headers if file doesn't exist
if(not os.path.isfile('/var/www/html/data.csv')):
    with open ('/var/www/html/data.csv','a') as datafile:
        datafile.write("Date,Temperature(°C),Light(lx),Humidity(%RH),Pressure(kPa),Sound(dB)\n")

#Use your Phidgets
while (True):
    tempStr = str(temp.getTemperature())
    lightStr = str(light.getIlluminance())
    humStr = str(hum.getHumidity())
    pressureStr = str(pressure.getPressure())
    soundStr = str(sound.getdB())
    now = datetime.now()
    timeStr = now.strftime("%Y-%m-%dT%H:%M:%SZ")

    #Write data to file in CSV format
    fileStr = timeStr + "," + tempStr + "," + lightStr + "," + humStr + "," + pressureStr + "," + soundStr + "\n"
    with open ('/var/www/html/data.csv','a') as datafile:
        datafile.write(fileStr)

    with open ('/var/www/html/latest.csv','w') as datafile:
        datafile.write(fileStr)

    #Blink LED
    statusLED.setState(not statusLED.getState())

    #sleep, modify this based on your needs
    time.sleep(1.0)
Code Review - Python
Here is a quick review of the code above:
#Add Phidgets Library
Add the Phidget class and all the sensor classes that will be used in this code.
#Used to get current time
import the datetime module so we can timestamp data easily
#Check file status
Used to determine if we should write headers or not
#Create/Address/Open
Basic Phidget configuration.
#Write Headers if file doesn't exist
Optional to have this section. This will write a header row to describe the data in your file. You can remove this entirely if you'd like.
#Use your Phidgets
Infinite loop that gathers data from sensors and stores it to a file. Writing data in a CSV format here. If you have never used a CSV before, this project has some good information. In this section, we are writing data to two files:
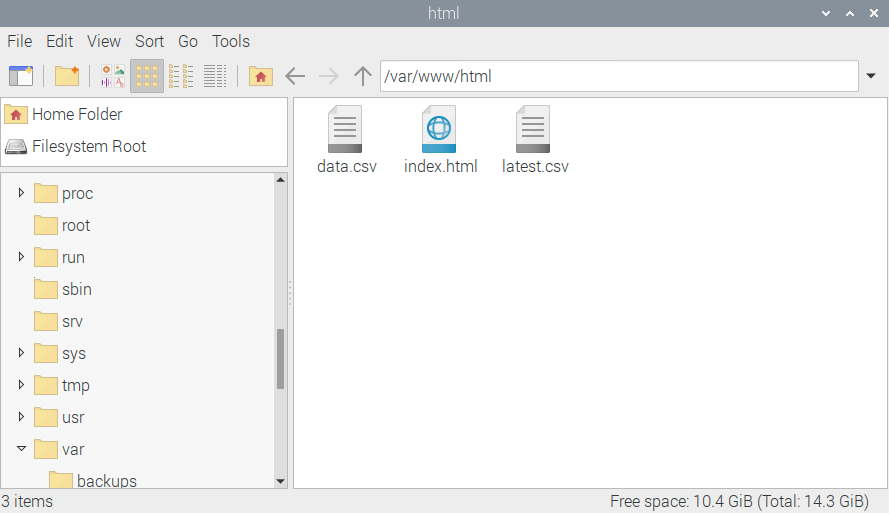
- data.csv is the primary data file that will hold the main information.
- latest.csv is a small data file used to pass current information to the website.
More on these later.
#Blink LED
Give a visual cue that the program is actually running. Ideally, this program will be running "headless" as in no monitor, so if it crashes you won't be able to tell. The status LED gives you a small glimpse into the program.
#sleep
Sleep for some period of time. If you plan to log data from your room for a long time (months, years, etc.) you will want to increase from 1 second to something more manageable like 1 minute, 5 minutes, 10 minutes, etc. If you log too often, you will run out of space more quickly.
Now that the data is being gathered and logged to a file, the next step is to take the data and display it via a website.
Website Review
Previously, we mentioned using the Raspberry Pi documentation to set up an Apache webserver. This information is also covered in this project.
It may sound complicated, but there are only two commands to run:
- sudo apt update
- sudo apt install apache2 -y
After running the commands in your terminal, you are ready to view/edit your webpage. There will be a folder under /var/www/html that holds all of your web files. In this next step, we will be editing the index.html file to create graphs and labels that display the Phidgets data. Note: /var/www/html is also where your Python script is now logging data. This is so that it can be served by the webserver and used by the website.
Write Code - JavaScript/HTML
Add the following code to your index.html file
<!doctype html>
<html lang="en">
<head>
    <meta http-equiv="Cache-Control" content="no-cache, no-store, must-revalidate" />
    <meta http-equiv="Pragma" content="no-cache" />
    <meta http-equiv="Expires" content="0" />
    <meta charset="utf-8">
	<script src="https://cdnjs.cloudflare.com/ajax/libs/vis/4.21.0/vis.min.js"></script>
	<link href="https://cdnjs.cloudflare.com/ajax/libs/vis/4.21.0/vis.min.css" rel="stylesheet" type="text/css">
    <title>Phidgets</title>
</head>
<script>
    var tempgraph;
    var tempwdata = [];
    var tempDataset;

    var lightgraph;
    var lightwdata = [];
    var lightDataset;

    var humgraph;
    var humwdata = [];
    var humDataset;

    var pregraph;
    var prewdata = [];
    var preDataset;

    setInterval(function() {
        fetch('http://192.168.2.196/latest.csv') <!-- REPLACE WITH YOUR IP ADDRESS -->
        .then(response => response.text())
        .then(text => {
            let newData = text.split(",");
            let date = new Date(newData[0]);
            document.getElementById("tempLabel").innerHTML = "Current Temperature: " + newData[1] + "°C"
            document.getElementById("lightLabel").innerHTML = "Current Light: " + newData[2] + "lx"
            document.getElementById("humLabel").innerHTML = "Current Humidity: " + newData[3] + "%RH"
            document.getElementById("preLabel").innerHTML = "Current Pressure: " + newData[4] + "kPa";

            //Temperature update
            tempwdata.push({ x: date, y: parseFloat(newData[1]), group: 0});
            tempDataset.update(tempwdata);
            tempgraph.setWindow(null,date);
            tempgraph.redraw()

            //Light update
            lightwdata.push({ x: date, y: parseFloat(newData[2]), group: 1});
            lightDataset.update(lightwdata);
            lightgraph.setWindow(null,date);
            lightgraph.redraw()

            //Humidity update
            humwdata.push({ x: date, y: parseFloat(newData[3]), group: 2});
            humDataset.update(humwdata);
            humgraph.setWindow(null,date);
            humgraph.redraw()

            //Pressure update
            prewdata.push({ x: date, y: parseFloat(newData[4]), group: 3});
            preDataset.update(prewdata);
            pregraph.setWindow(null,date);
            pregraph.redraw()
        })
    }, 2000);

    function connectPhidgets(){
        fetch('http://192.168.2.196/data.csv') <!-- REPLACE WITH YOUR IP ADDRESS -->
        .then(response => response.text())
        .then(text => {

            let data = text.split("\n");

            let options = {
				legend: true,
				width: '75%'
			};

            let groups = new vis.DataSet();
				groups.add({
					id:0,
					content: "Temperature (°C)"
				});
                groups.add({
					id:1,
					content: "Light (lux)"
				});
                groups.add({
					id:2,
					content: "Humidity (%RH)"
				});
                groups.add({
					id:3,
					content: "Pressure (kPa)"
				});

                //Temperature
				let tempContainer = document.getElementById('temperatureGraph');
				for (let i = 1; i < data.length -1 ; i++) { //first data point is headers, last is new line, so avoid those
                    realData = data[i].split(",")
                    let date = new Date(realData[0]);
					tempwdata.push({ x: date, y: parseFloat(realData[1]), group: 0});
				}
				tempDataset = new vis.DataSet();
				tempDataset.add(tempwdata);
				tempgraph = new vis.Graph2d(tempContainer, tempDataset, groups, options);

                //Light
                let lightContainer = document.getElementById('lightGraph');
				for (let i = 1; i < data.length -1 ; i++) { //first data point is headers, last is new line, so avoid those
                    realData = data[i].split(",")
                    let date = new Date(realData[0]);
					lightwdata.push({ x: date, y: parseFloat(realData[2]), group: 1});
				}
				lightDataset = new vis.DataSet();
				lightDataset.add(lightwdata);
				lightgraph = new vis.Graph2d(lightContainer, lightDataset, groups, options);

                //Humidity
                let humContainer = document.getElementById('humidityGraph');
				for (let i = 1; i < data.length -1 ; i++) { //first data point is headers, last is new line, so avoid those
                    realData = data[i].split(",")
                    let date = new Date(realData[0]);
					humwdata.push({ x: date, y: parseFloat(realData[3]), group: 2});
				}
				humDataset = new vis.DataSet();
				humDataset.add(humwdata);
				humgraph = new vis.Graph2d(humContainer, humDataset, groups, options);

                //Pressure
                let preContainer = document.getElementById('pressureGraph');
				for (let i = 1; i < data.length -1 ; i++) { //first data point is headers, last is new line, so avoid those
                    realData = data[i].split(",")
                    let date = new Date(realData[0]);
					prewdata.push({ x: date, y: parseFloat(realData[4]), group: 3});
				}
				preDataset = new vis.DataSet();
				preDataset.add(prewdata);
				pregraph = new vis.Graph2d(preContainer, preDataset, groups, options);
        })
    }

</script>
    <body onload="connectPhidgets()">
        <div>
            <h1>Phidgets Data</h1>
            <h2 id="tempLabel"></h2>
            <h2 id="lightLabel"></h2>
            <h2 id="humLabel"></h2>
            <h2 id="preLabel"></h2>
            <div id="temperatureGraph"></div><br><br><br>
            <div id="lightGraph"></div><br><br><br>
            <div id="humidityGraph"></div><br><br><br>
            <div id="pressureGraph"></div>
        </div>
    </body>
</html>
Code Review - JavaScript/HTML
Note: the website code can be vastly improved. This is a extremely basic website that displays data on graphs.
We will review the following sections:
- Main flow
- Graphing
- Updating Graphs
- Caching
Main Flow
The website has two main parts:
- Webpage load: when the webpage loads the main data file (data.csv) is loaded and the contents of the file are displayed on graphs
- Every 2 seconds: there is a function that runs every 2 seconds (you can change this frequency) that grabs the small data file (latest.csv) and displays the latest data on the webpage AND updates the graphs.
Graphing
Graphing is accomplished using the vis.js graphing library. When the webpage loads, we fetch the data.csv file, extract the data, and graph it. If you need more information about how this is done, leave a comment below.
Updating Graphs
In order to update the graphs and the labels on the website, we fetch the much smaller latest.csv file, extract the data, update the labels and add the data points to our graphs.
Caching
Caching may need to be looked into more closely on this project. Depending on your browser, it may want to pull old versions of data.csv and latest.csv. There are multiple ways around this, and if you are getting strange results when running the code above, look there first.
Run on Boot
Now that all of your software is running, you will want to make your Python script runs every time your Pi boots. You will want to do this because your Pi will be running "headless" (i.e. without a monitor), so you won't be able to manually run the program.
Follow the instructions on this project for more information.
Install and Run
The last step is to install your project and run it. You will likely have to do some debugging to get it running solidly, but if you do, you will have some awesome data to review.
Going Forward Points
Here are some things you can do to improve on the project:
- Make your website viewable from the outside world. Right now, your project runs on your local network. Try using PiTunnel to make it accessible from anywhere. This project has some good points.
- Add some filters to your graphs. Allow users to filter by day, month, year, etc.
- Think about your data. Right now you have a file that is constantly being written to and is getting larger and larger. Maybe you want to make a backup? Maybe you want to create files based on the month/year instead of just one large file, etc etc.
- Make your website look better. There are many website templates available online that you can simply import and use.
If you have any questions, leave a comment below.