Raspberry Pi RF Temperature Monitor
by JohnV81 in Circuits > Raspberry Pi
16756 Views, 48 Favorites, 0 Comments
Raspberry Pi RF Temperature Monitor
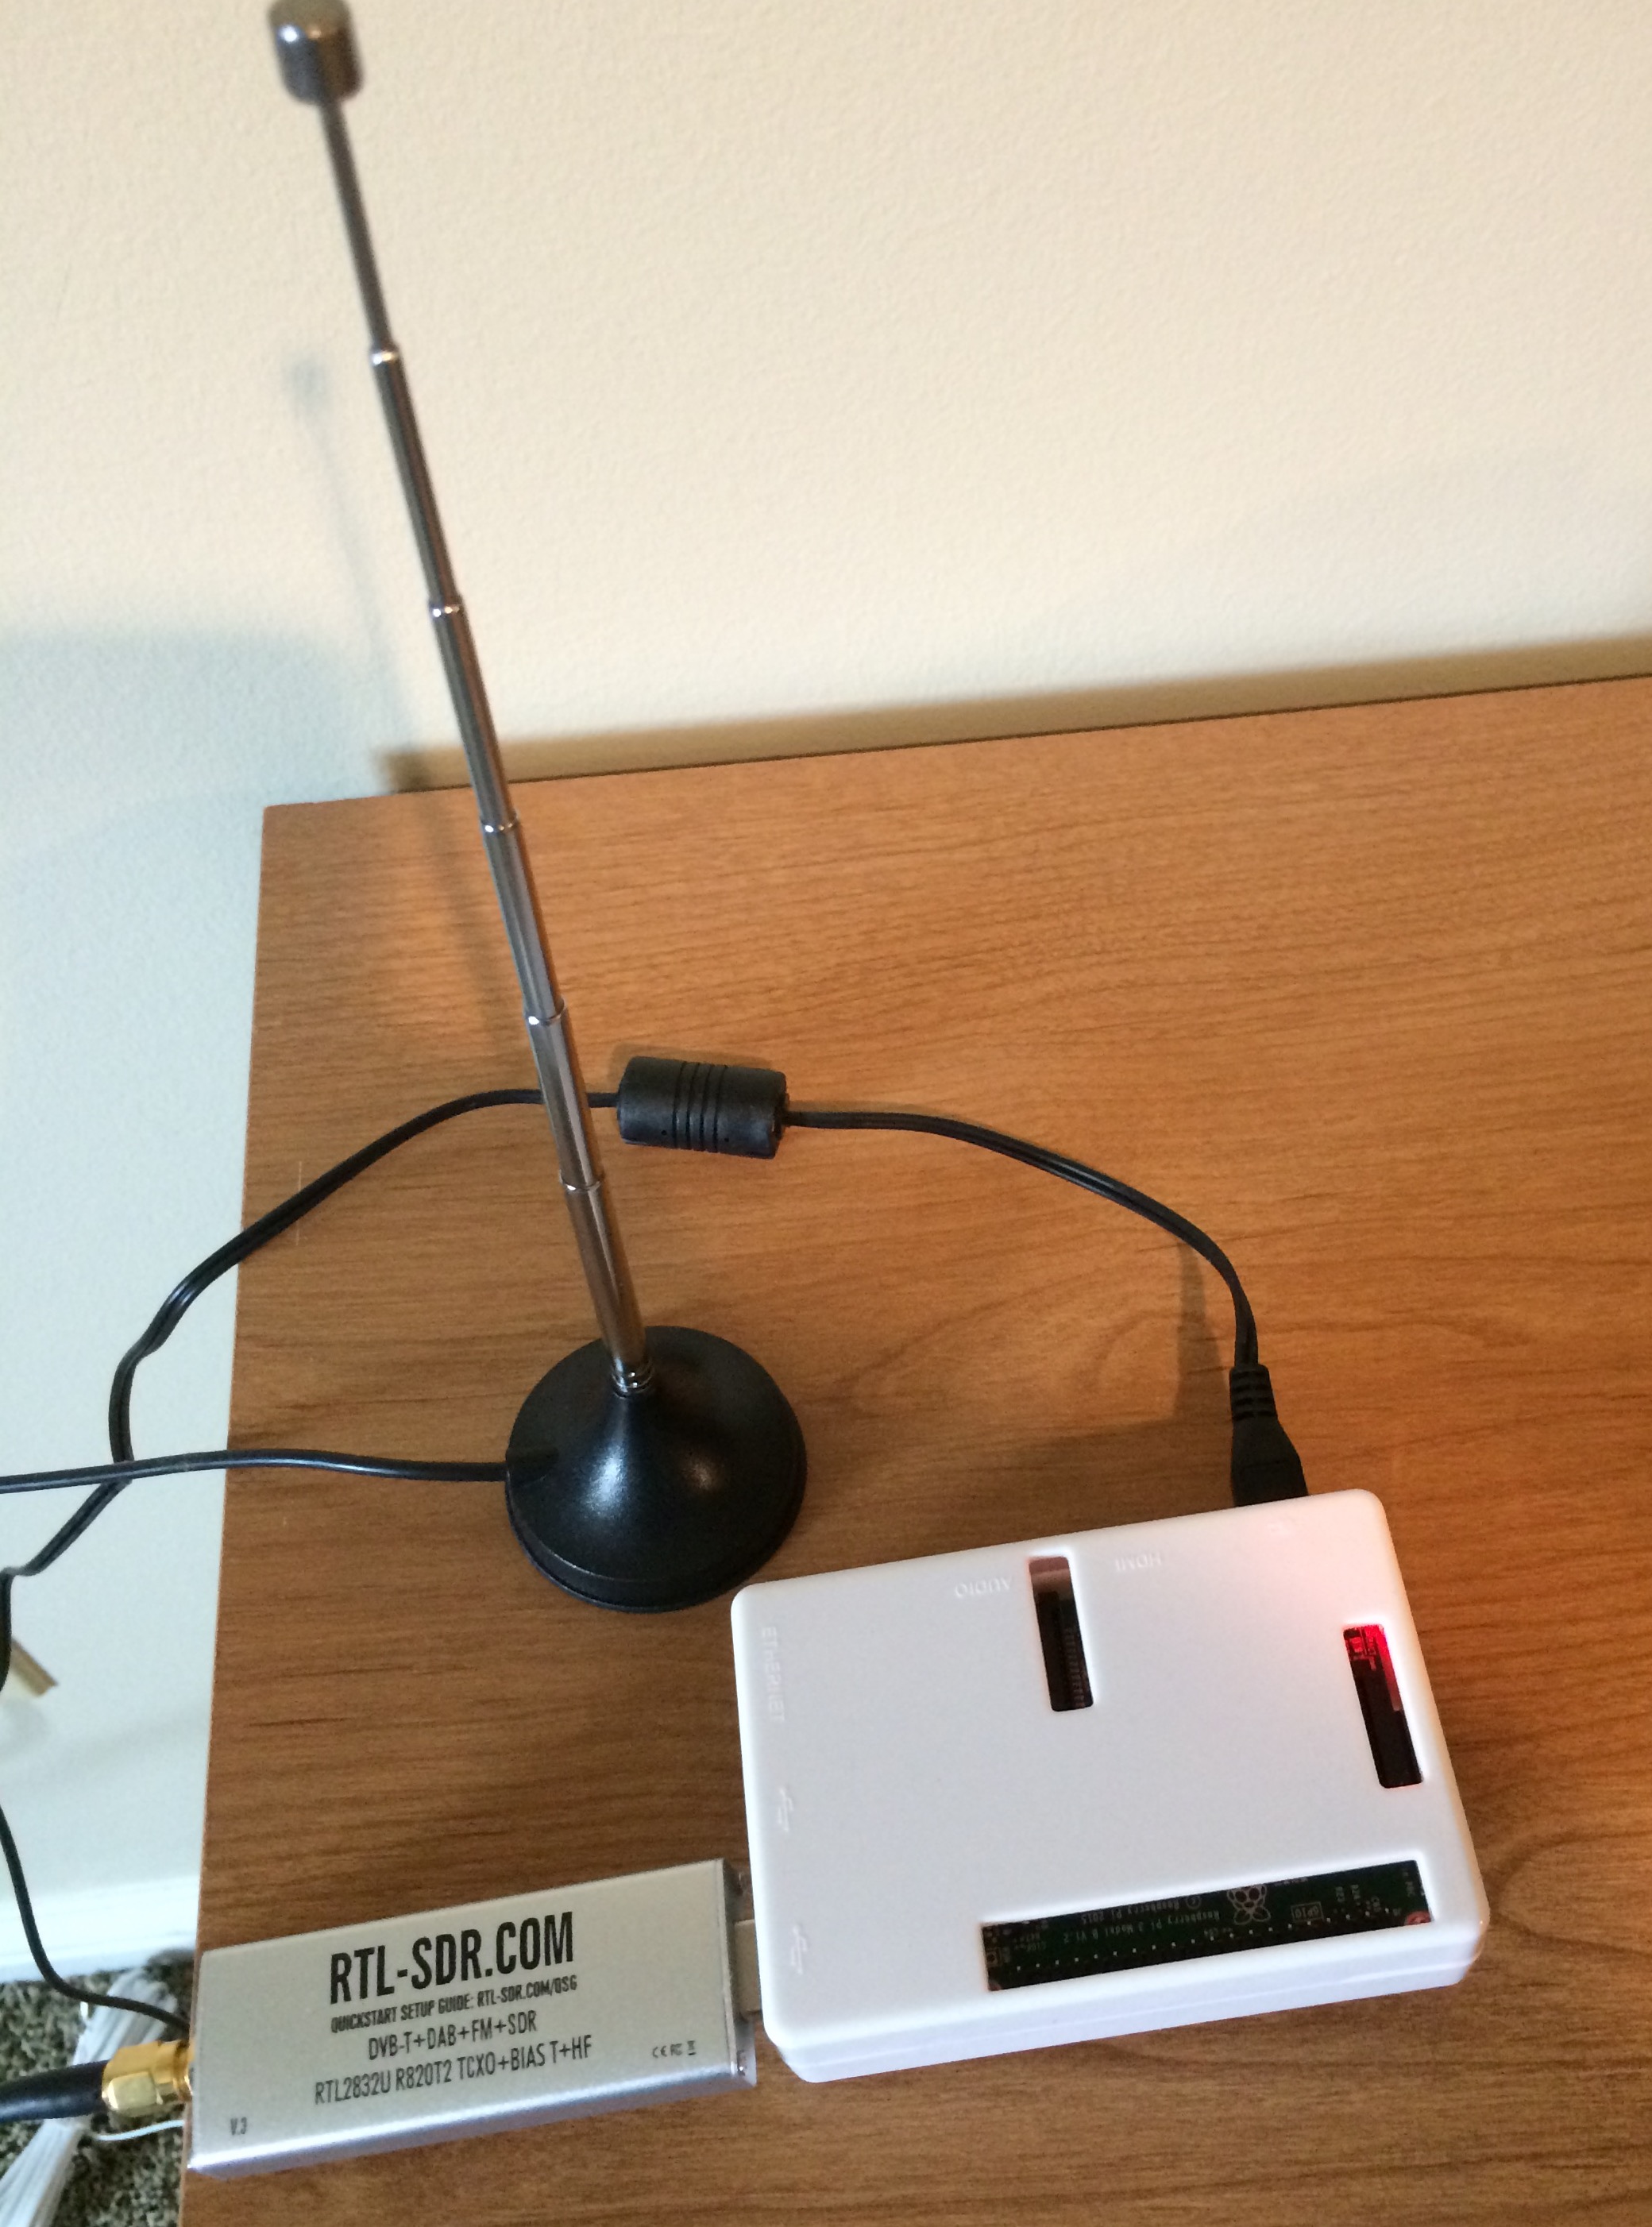
I have a friend that owns a business with 2 walk in coolers storing perishable ingredients she needs to use. Occasionally she has issues with the coolers getting warmer than they should due to mechanical breakdowns. On one occasion, the cooler broke down on the weekend when no one was around and she lost some of the food. I built a temperature monitoring and alarm system using off the shelf Acurite Freezer - Refrigerator temperature sensors with a Raspberry Pi set up to intercept the RF signal from the temperature sensors and send an email if the temperatures were out of bounds.
What You Need
Here is the part list linked to Amazon if you would like to buy them there (cost around $105 total):
AcuRite 00986A2 Refrigerator/Freezer Wireless Digital Thermometer
Nooelec NESDR Smart v4 Bundle - Premium RTL-SDR
Raspberry Pi 3 with 2.5A Micro USB Power Supply (UL Listed)
Samsung 32GB EVO Plus Class 10 Micro SDHC with Adapter 80mb/s (MB-MC32DA/AM)
There are a few websites that will guide you in setting up your RPi for the first time if needed.
I set mine up 'headless' and use VNC to connect to it. The links above show how to do this.
I may earn a small commission for my endorsement, recommendation, testimonial, and/or link to any products listed above.
Sensor Setup
Setup the Acurite temperature sensors according to the instructions provided with it.
You can use any other temperature measuring device that sends an RF signal. This project assumes it is sending the signal on 433mHz so you may need to adjust the software if using a device that sends on a different frequency.
- Install rtl-sdr using the add /remove software included in the RPi standard menu. I installed all 3 packages - tools, development files, and library.
Get and build / install rtl_433 from https://github.com/merbanan/rtl_433 (may need to also install cmake). This package supports a fair number of sensors. I am using the Acurite 986 which is protocol 40. You may be able to substitute other sensors as indicated in the package documentation.
- At this point, with the sensors in place in the refrigerator and freezer, the RTL dongle plugged into the RPi, you should be able to open a terminal window and run 'rtl_433 -G' and see the Acurite 986 send measurements. (Note: you will also see any other devices that transmit at 433 mHz). The Acurite 986 sends measurements every couple of minutes so you will have to wait to see the results.
- Here is what my RPi reports when I run 'rtl_433 -G':
2017-02-28 10:50:26 Acurite 986 sensor 0x154c - 1R: 3.9 C 39 F
2017-02-28 10:50:39 : HIDEKI TS04 sensor Rolling Code: 9 Channel: 3 Battery: OK Temperature: 10.7 C Humidity: 34 %
2017-02-28 10:50:39 : HIDEKI TS04 sensor Rolling Code: 9 Channel: 3 Battery: OK Temperature: 10.7 C Humidity: 34 %
2017-02-28 10:50:39 : HIDEKI TS04 sensor Rolling Code: 9 Channel: 3 Battery: OK Temperature: 10.7 C Humidity: 34 %
^CSignal caught, exiting!
Install Python Script to Capture Measurements
Create a folder for your project. I used /home/pi/Documents/FreezerProjects for mine. If you use a different folder you will need to update the python script to reflect that.
Download the record_986.py script attached and place in your folder.
This script does the following:
- Starts up the rtl_433 service with parameters for using protocol 40 (Acurite 986), records in json format, and runs in quiet mode.
- Waits for a measurement to be reported by the rtl_433 service. Updates the refrigerator or freezer .dat file as appropriate and appends the measurements to the Stats.csv file
The R.dat and F.dat files are read every 15 minutes by another python script described in the next step. The Stats.csv file is used on a weekly basis in the creation of a graph.
I set this script to run on every reboot. I use gnome-schedule to set cron jobs - use whatever you are comfortable with.
I installed gnome-scheduler via the Add / Remove software from the RPi menu -> Preferences.
Note: script assumes you have sys, subprocess, threading and datetime python modules installed. You can check to see installed python modules by opening a python shell and typing help('modules'). If any are missing, use pip to add them. (see https://packaging.python.org/installing).
crontab setting:
@reboot python /home/pi/Documents/FreezerProjects/record_986.py > t986.log &
Downloads
Install Python Script to Monitor Temperature Readings
Add the attached file temp4sensor.py to your folder.
This script does the following:
- Reads a configuration file with the temperature range to check, along with email and text message addresses to use for alerts.
- When it executes, it reads the R.dat and F.dat files updated by the record_986.py script to see if they are in the range specified in the configuration file.
- If either reading is out of range, the script sends an email and text message.
- The script uses a gmail account to send the messages from. There are other methods to send messages if this doesn't work for you.
- If a message is sent, the script will modify a file save.dat with a '1' to prevent continuously sending a message. I reset this file every day a 8:00 am with a small cron job.
Script assumes the following python modules are installed:
time, decimal, smtplib, email.mime.text, time, sleep, threading, json, pickle
I set this up to execute every 15 minutes - you can adjust it in your crontab.
crontab setting:
*/15 * * * * python /home/pi/Documents/FreezerProjects/temp4sensor.py > Mtemp.log
In your project folder create a text file named t4sensorjson.cfg with the following contents:
{
"S1_Low" : "32",
"S1_High": "47",
"S2_Low" : "-7",
"S2_High": "29",
"TextID" : "NNNNNNNNNN@vtext.com",
"EmailID": ["person1@comcast.net", "person2@gmail.com"]
}
S1 is the refrigerator settings, S2 is the freezer settings - set to whatever you like. textID is the phone number to text using the required format for the phone service provider (e.g., @vtext.com for Verizon cellphones).
EmailID is an array of multiple email addresses as needed.
At this point, you should have a working temperature monitoring and alerting application!
The following steps are enhancements I built to add value to the basic application.
Downloads
Daily File Reset
Download the attached file and save it in your project folder.
Set a crontab entry to run this script every day at 8:00 to reset the text message sent flag file.
crontab setting:
0 8 * * * python /home/pi/Documents/FreezerProjects/onceperday.py
Downloads
Create and Email Weekly Graph
Create an executable shell script file with the following content:
#!/bin/sh
# produce graph file, email the graph, and reset the collection files
> t986.log
> Mtemp.log
cd /home/pi/Documents/FreezerProjects
cp Stats.csv Stats.bak
cp messages.csv messages.bak
python graph2.py && python test_mail.py
> messages.csv
> Stats.csv
echo 'DateTime,Sensor,Value' > Stats.csv
Download and save the attached files in your project folder. Update test_mail.py with your email account settings.
The shell script will zero out the t986 and Mtemp logs so they do not grow too large. Then it will back up the Stats.csv and messages,csv files in case you need to use them for trouble shooting.
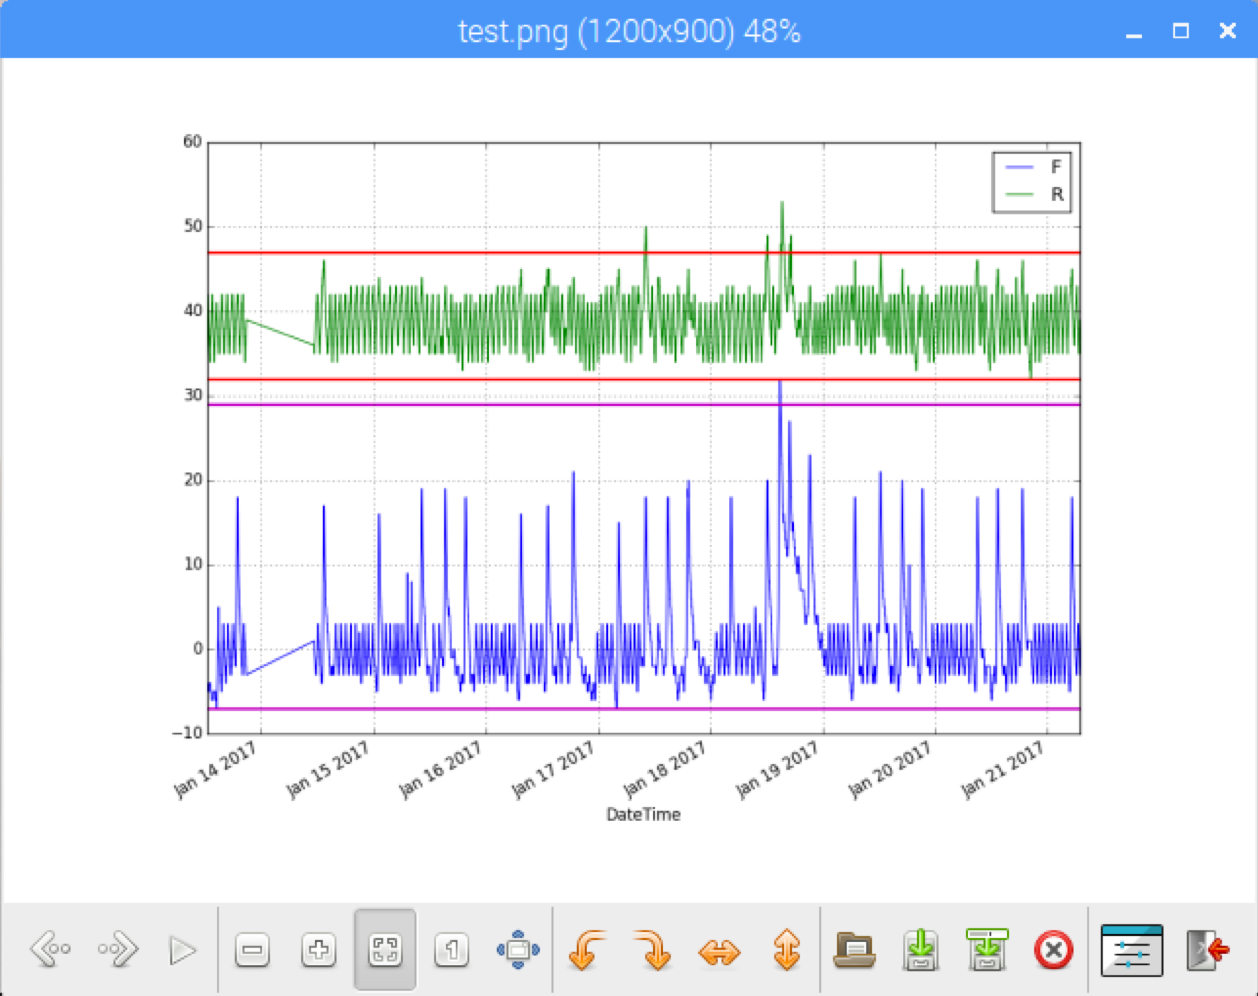
Next the shell script will execute the graph2 python script to create the graph file - image attached to this step - and then email it to the email addresses set up earlier in the configuration file.
Finally the shell script will reset the messages and Stats files to initial states.
Python script requires these modules: csv, dateutil, subprocess, pandas, matplotlib, matplotlib.pyplot, json.
I set this up to run every Monday morning at 9:00 AM.
crontab settings: 0 9 * * 7 /home/pi/Documents/FreezerProjects/graph.sh
Use IBM Watson-IOT and Node-Red to Create a Dashboard (optional)
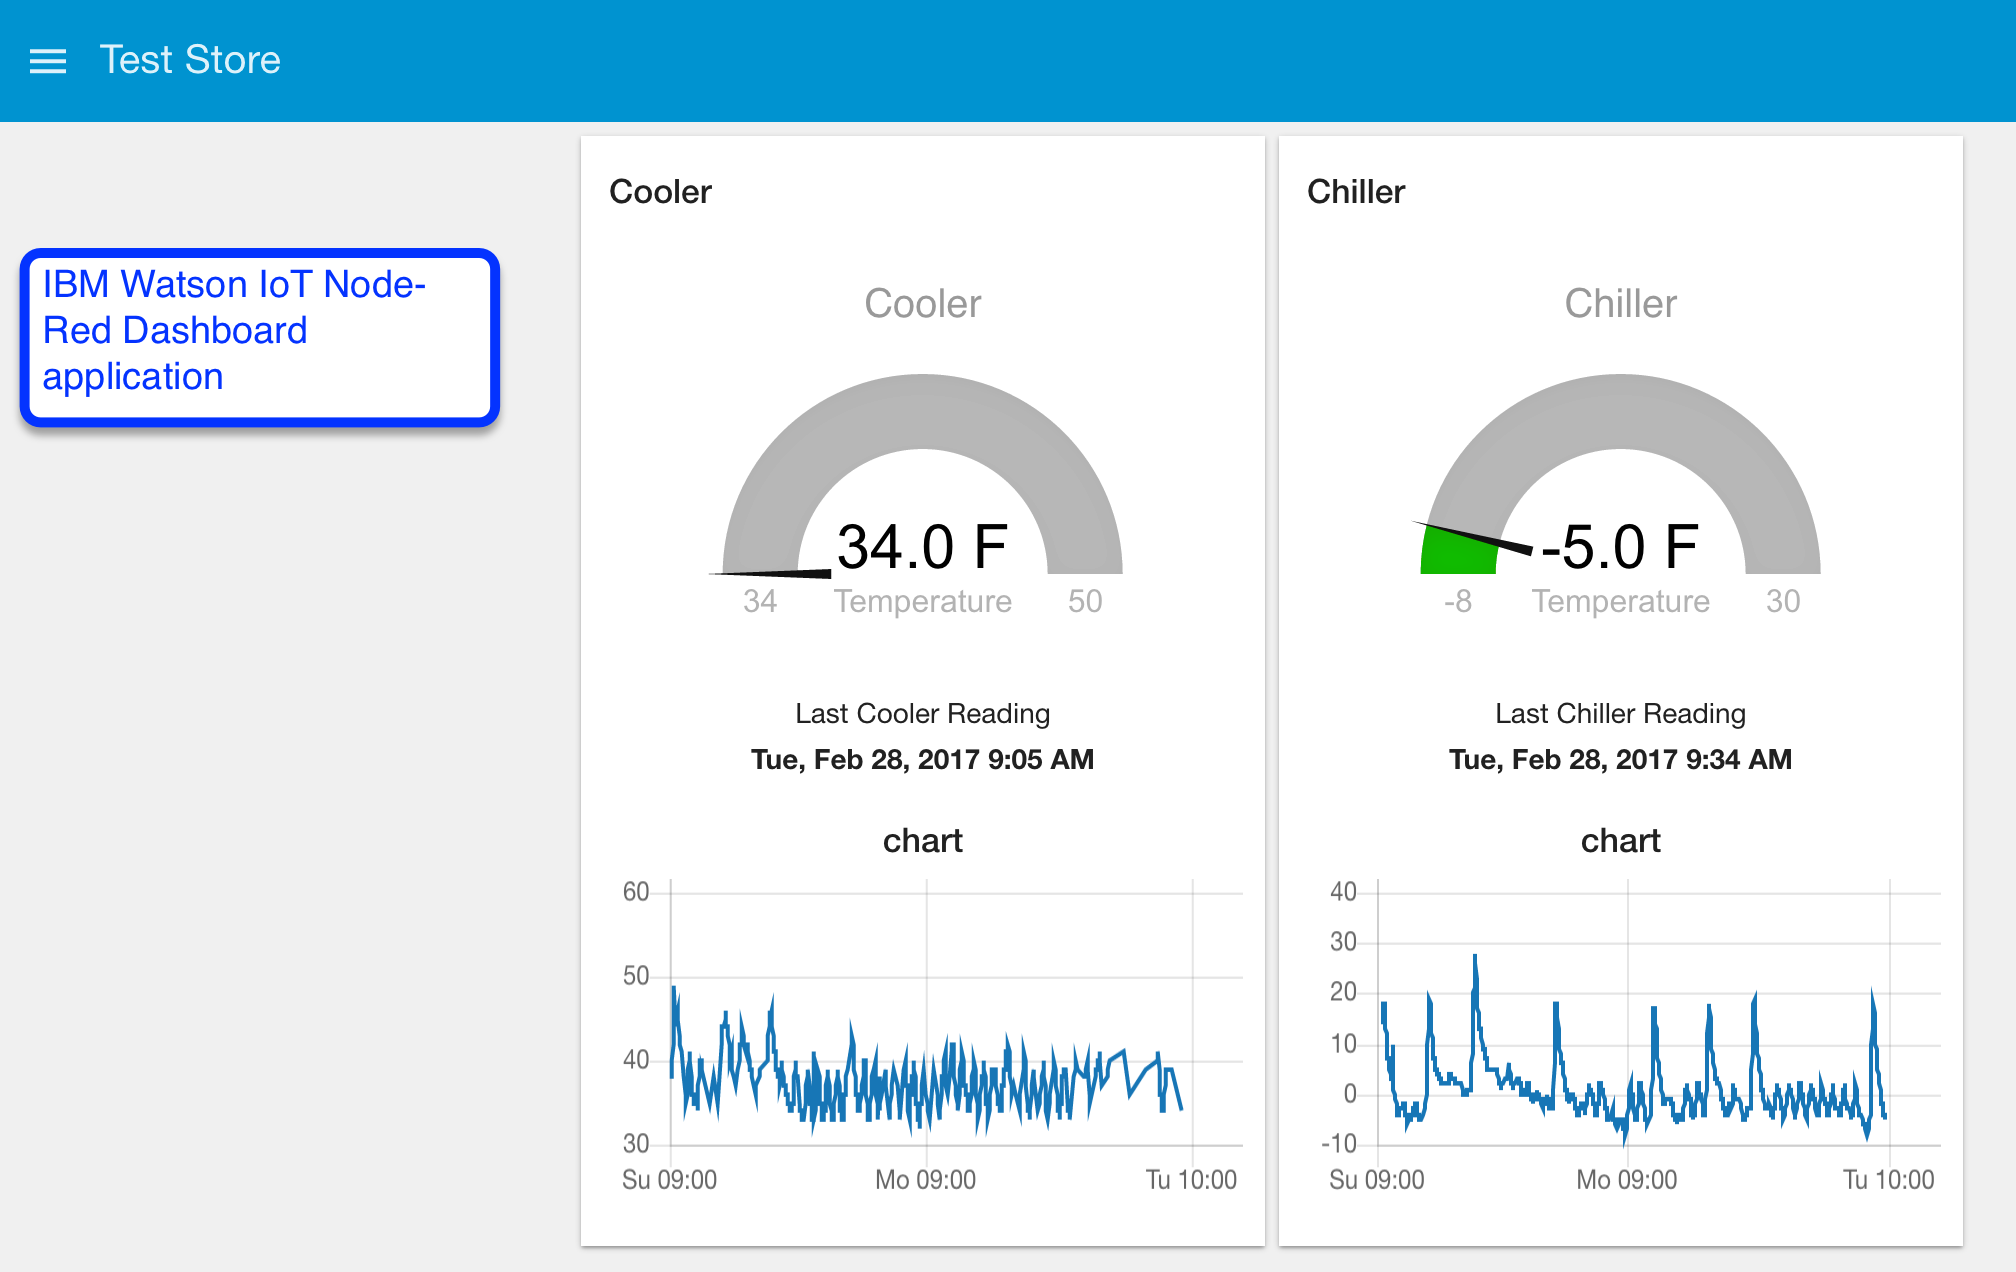
The Raspberry Pi 3 with the NOOBS basic Debian OS comes with Node-Red pre-installed. I already had an IBM Bluemix account and so it was fairly easy to set up the dashboard.
- If you don't already have one, set up a free 30 day trial account on IBM Bluemix. IBM Bluemix Signup
- After 30 days, you can upgrade your account. I set the memory for the application to 256MB and do not get charged for usage as IBM currently allows the first 375GB-hours at no charge (.25 GB X 24 hrs/day X 31 days/month = 186 GB-hours/month).
- Follow the directions on IBM Bluemix to get your RPi communicating with the Bluemix platform and Node-Red. Here is a link: https://developer.ibm.com/recipes/tutorials/deploy-watson-iot-node-on-raspberry-pi/
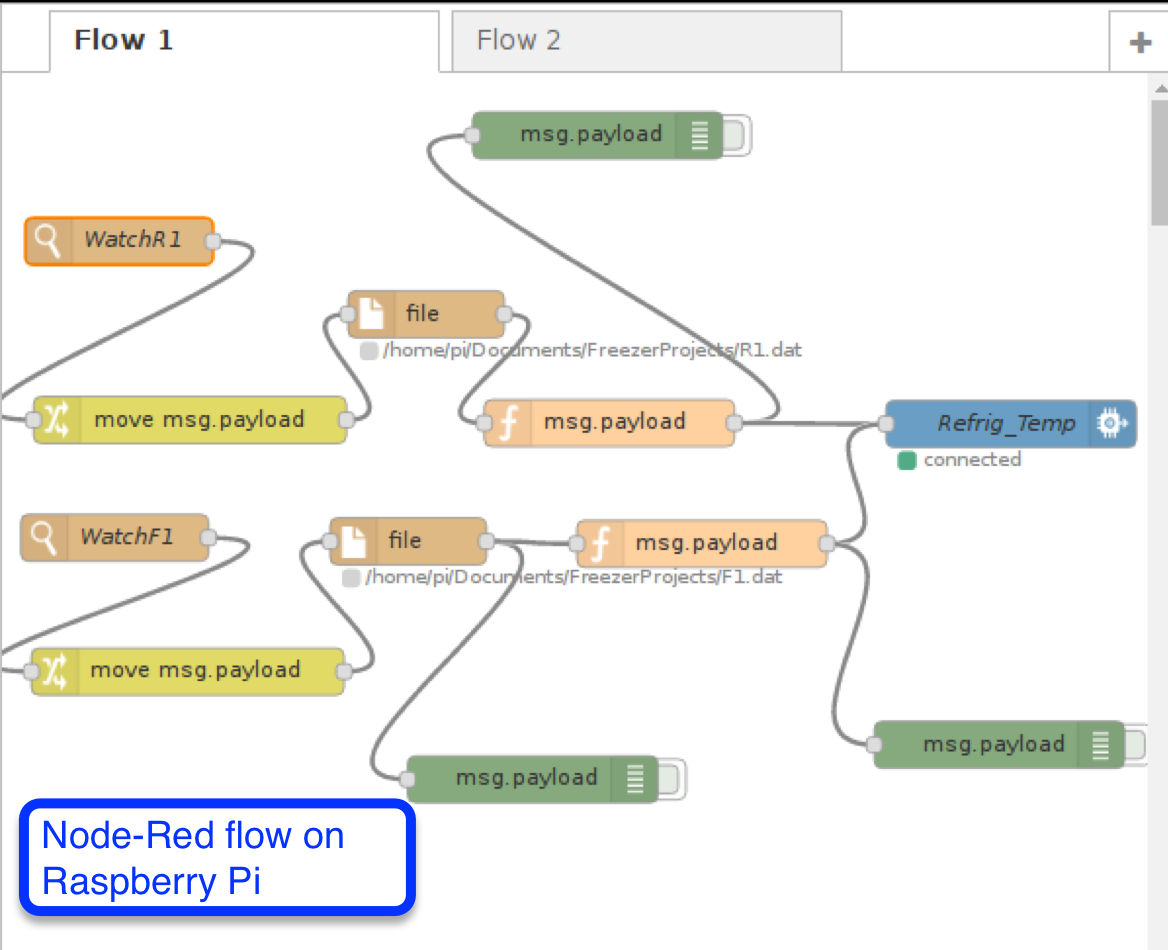
- Refer to the picture of the Raspberry Pi Node-Red Flow 1 and create the nodes and connect them as shown.
- Create 2 Watch nodes to watch the timestamps of the R1 and F1 dat files. Once a reading is received by the python script, the .dat file will have the latest temperature value and trigger the Node-Red flow.
- For each watch node, create a change node to move msg.payload to msg.filename
- For each change node, create a file node to read the temperature values. Output as utf8.
- For each file node, create a function node with the appropriate function:
-
msg.payload = {"d":{"Rtemp":msg.payload.replace("t=","").replace("'C\n","")}};
return msg; -
msg.payload = {"d":{"Ftemp":msg.payload.replace("t=","").replace("'C\n","")}};
return msg;
-
- Connect both function outputs to the Watson IoT node.
- Add any debug messages if you wish.
- You will need to enable the node-red-dashboard if it is not in your node-red starter IBM Bluemix application. This can be accomplished by enabling the continuous delivery and have a tool chain. Add node-red-dashboard to your project dependencies in the package.json file and deploy. Now when you open up your node-red flow editor, you should see 'dashboard' in your palette.
- We will also need node-red-contrib-moment added to package.json if it is missing from the palette as we will use this to format the update date time in the dashboard.
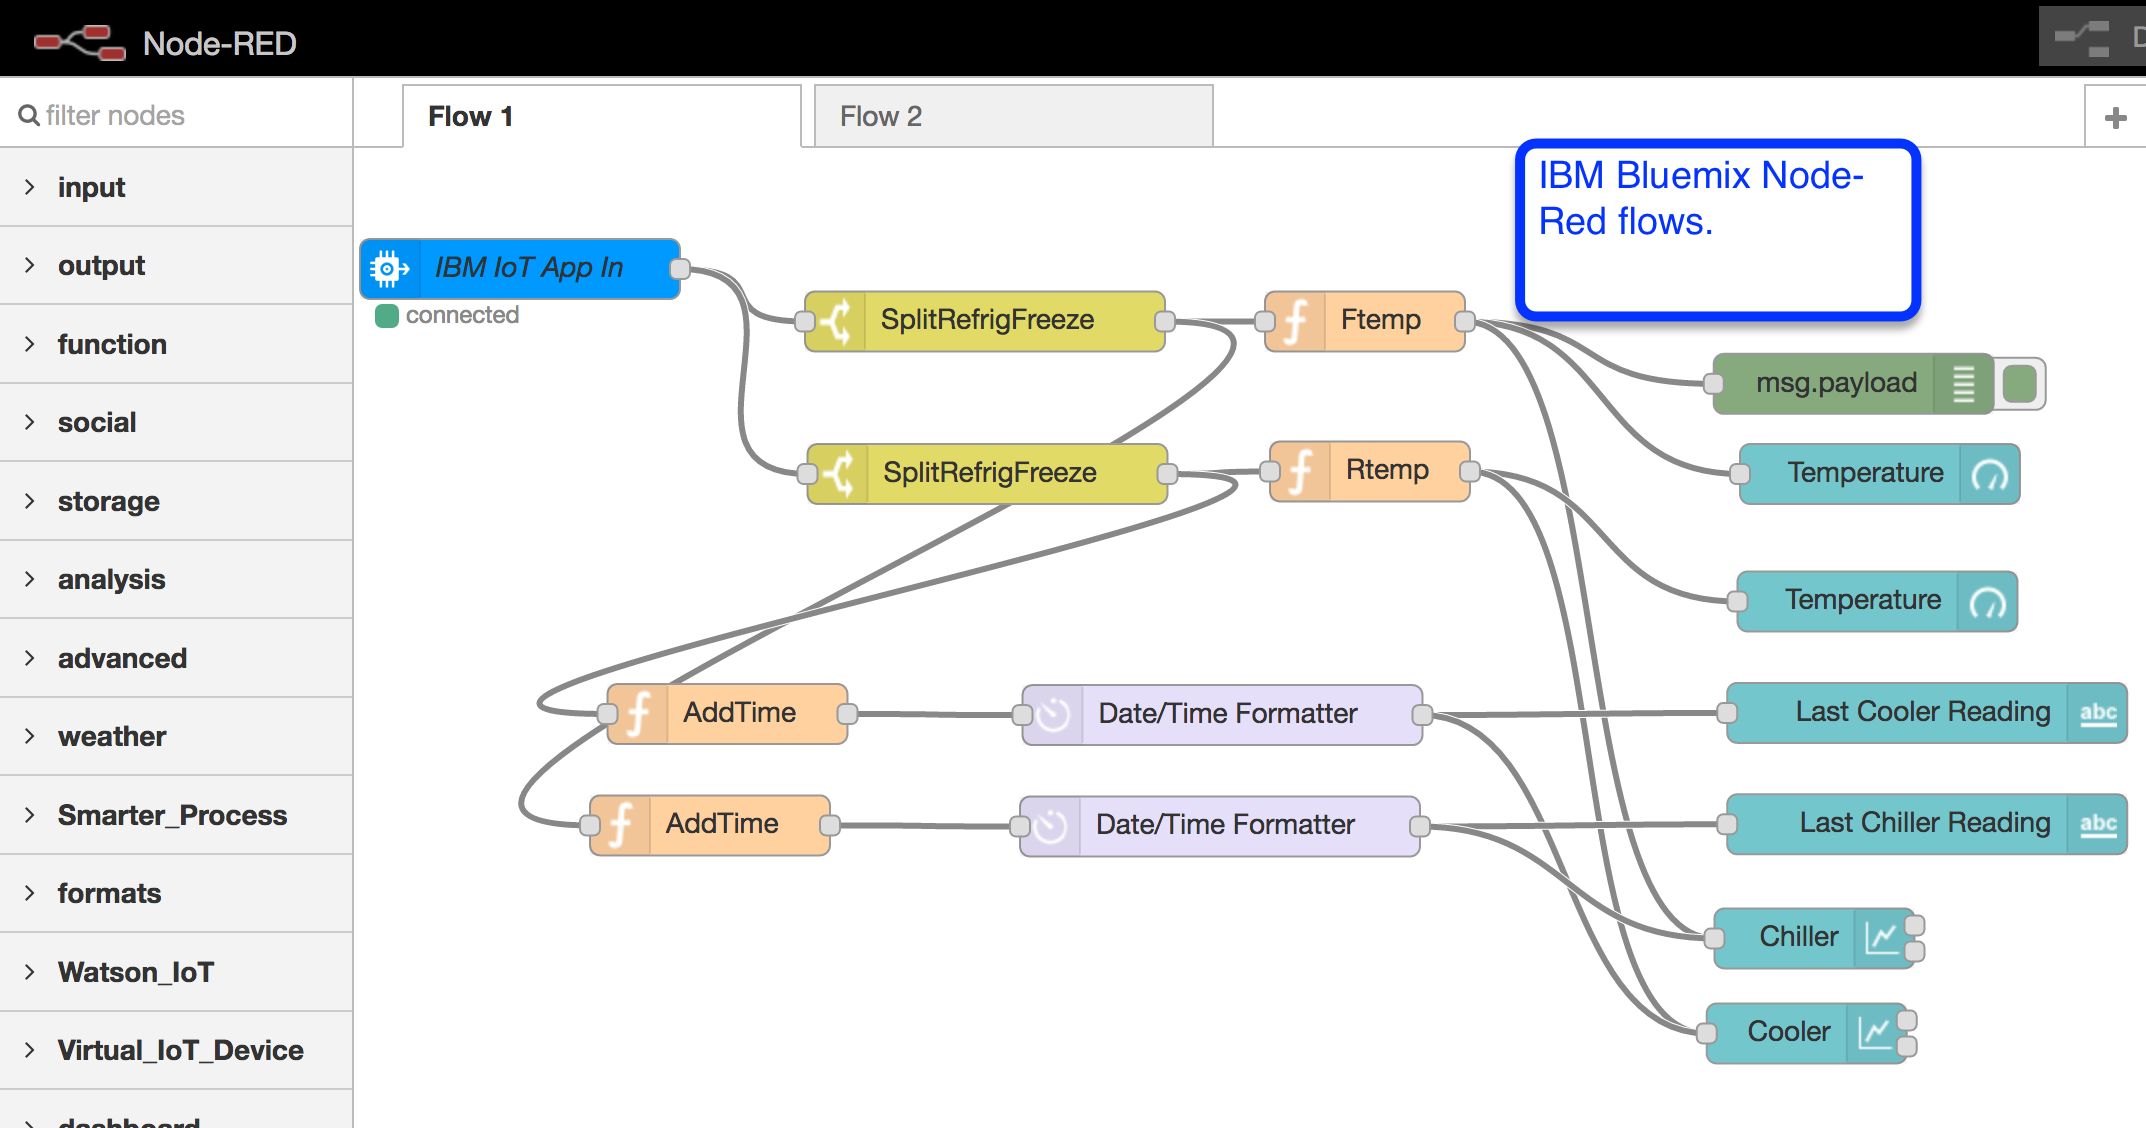
- Refer to the picture of IBM Bluemix Node-Red flows and connect them as shown.
- There should already be a connection from the starter code to begin. This node receives the temperature values from the RPi node-red flow.
- Create 2 switch nodes to separate the R temp and the F temp into separate flows.
-
SplitRefrigFreeze "Property msg.payload.d.Ftemp is not null" for the freezer flow and
-
"Property msg.payload.d.Rtemp is not null" for the refrigerator flow
-
- For each switch node, create a function node to read the temperature value.
-
return {payload:msg.payload.d.Ftemp} and
-
return {payload:msg.payload.d.Rtemp}
-
- For each switch node, create a function node to record the date-time a reading was received.
-
msg.timestamp = new Date().toISOString()
return msg;
-
- Create a moment node to format the date time to your timezone and preference. I am using "llll" for my format.
- Next create gauges, charts and text and connect up the temperatures and moment output as shown. Use the dashboard sidebar tab to manage the widget layout. See https://github.com/node-red/node-red-dashboard
Remote Access (optional)
Since this will be located in a store, I ended up using TeamViewer on my home PC and Raspberry Pi. There is a beta version for the RPi and it appears to work pretty well.
Sometimes the RPi TeamViewer would 'hang' so I set a crontab to reboot it every other day at 2:00 am so I could still get to it remotely without having to have someone "unplug - plug it back in" onsite.
https://www.teamviewer.com/en/
RPi beta:
https://pages.teamviewer.com/published/raspberrypi/
Remote Reboot Using Node-Red (optional)
Sometimes I may want to reboot my Raspberry Pi remotely. I created an additional flow in my IBM Bluemix Node-Red app to send a reboot command to the RPi.
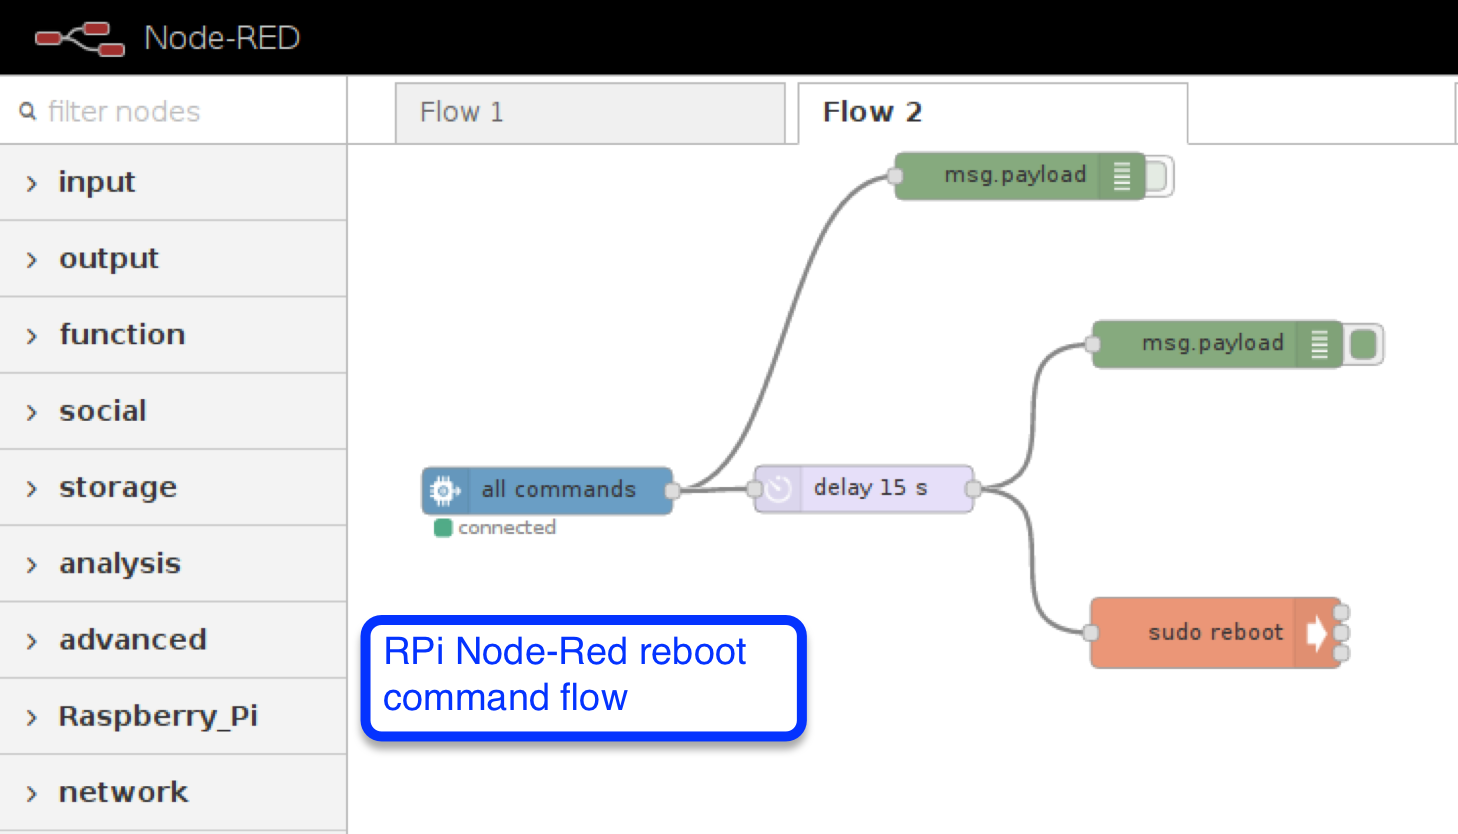
On the Raspberry Pi create the following Flow 2:
- See the RPi Node-Red reboot flow picture for the connections.
- Create a watson iot input node and fill it in with the appropriate credentials to communicate with watson iot.
- Create a delay node and set it for 15 seconds (optional)
- Create a exec node with 'sudo reboot' command
- Add any debug messages if you want
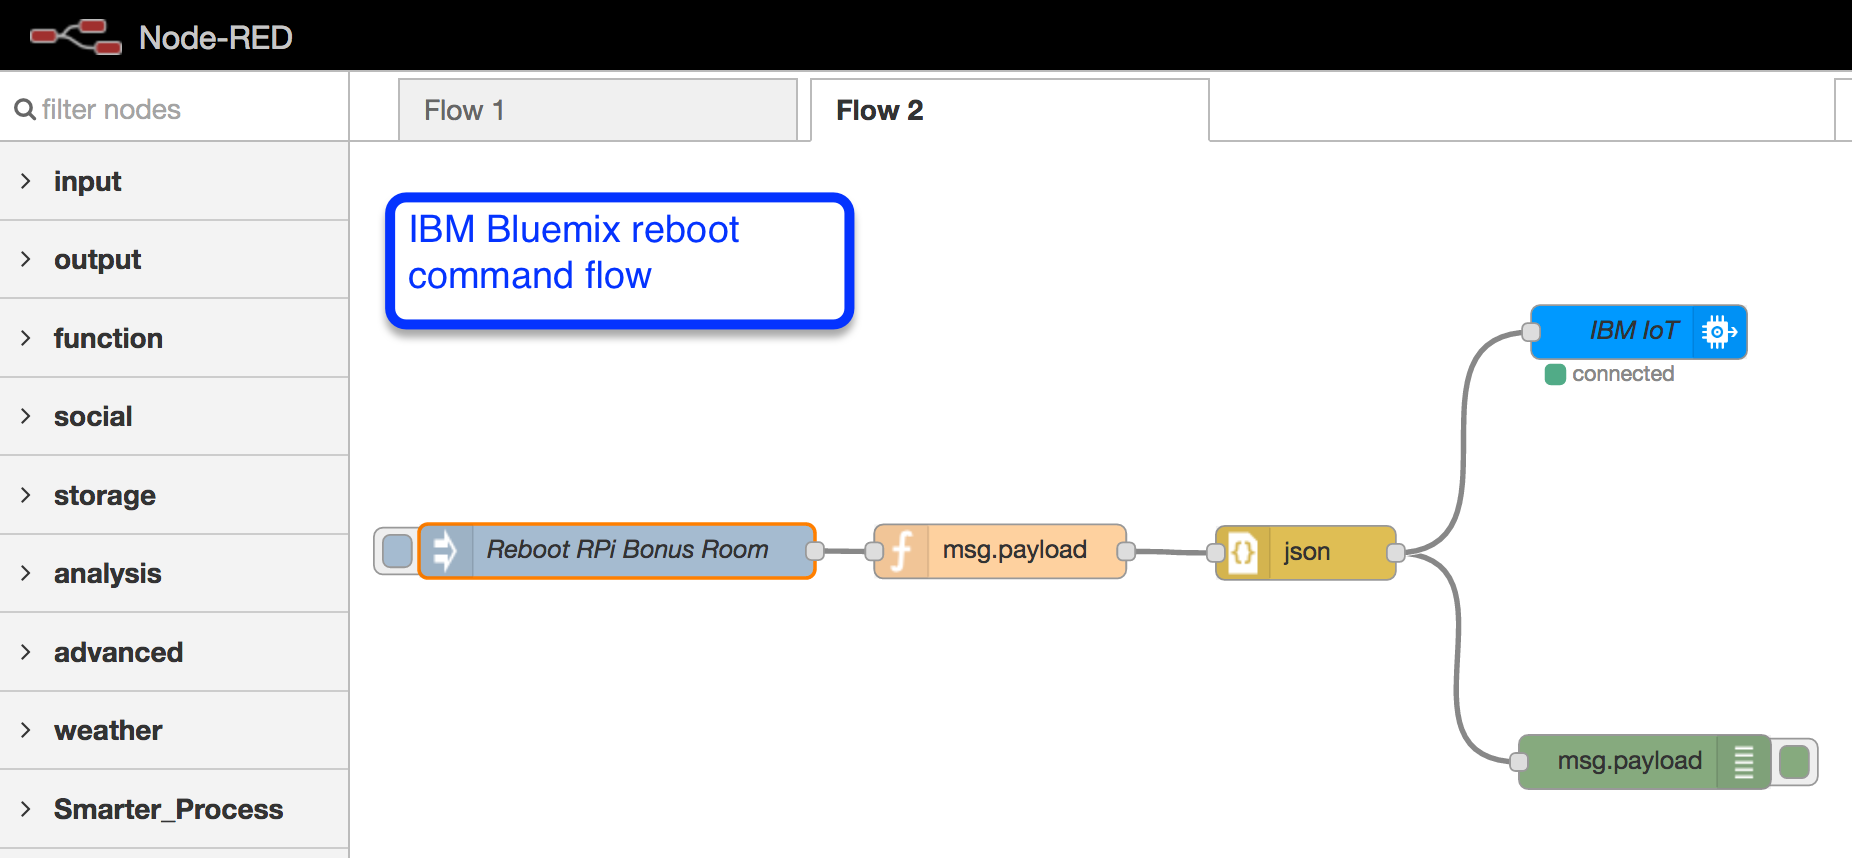
On the Bluemix Node-Red application, create the following Flow 2:
- See the IBM Bluemix Node-Red reboot flow picture for the connections
- Create an injector node to kick off the flow
- Connect the injector node to a function node with this function:
-
msg.payload = '{"delay": 2}'
return msg;
-
- Create a json node
- Create a watson iot output node and fill it in with the appropriate credentials to connect to the Raspberry Pi.