Raspberry Pi - Data Visualization
by AdrieSentosa in Circuits > Raspberry Pi
12356 Views, 56 Favorites, 0 Comments
Raspberry Pi - Data Visualization
In this project, we will learn how to visualize data from Raspberry Pi using Plotly Platform which communicate information clearly via the statistical graphics, plots, and selected charts.
It’s a quite quick project and can be used either on its own or part of something bigger (Check it Out >> Integrated Weather Station).
RaspberryPi Setup
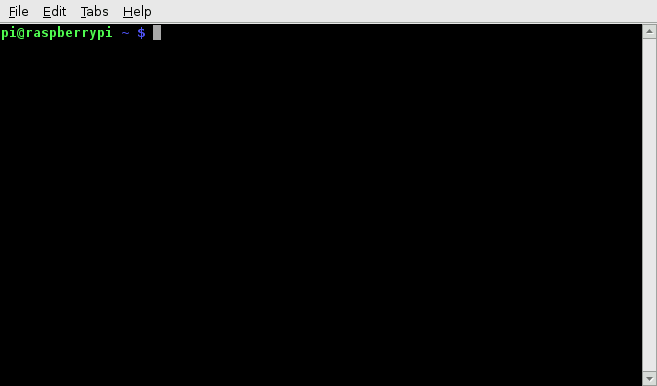
Run these command in Raspberry Pi terminal to install necessary program :
sudo apt-get install python-dev
sudo apt-get install python-pip
sudo pip install rpi.gpio
sudo pip install plotly
RaspberryPi Programming
- Change some code ('your_plotly_username' and 'your_apkey') depend on yours*,
- Run the Module ( sudo python basic-line.py) ,
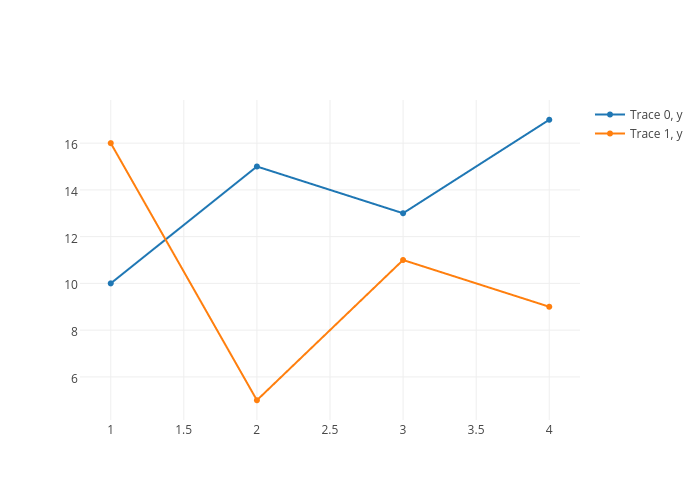
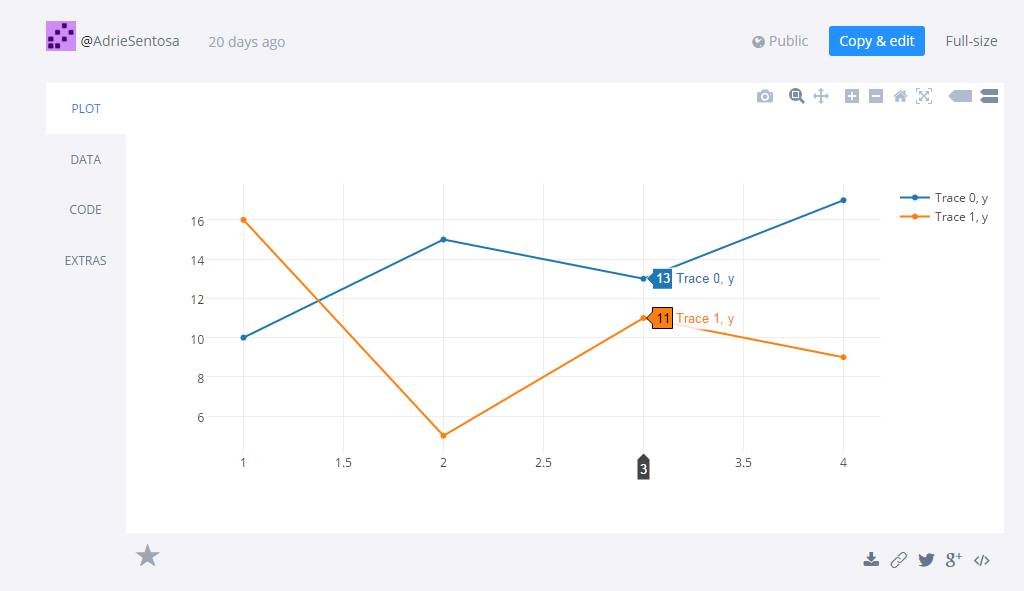
- After a few minutes, check your filewell on Plotly, and you will see your data graph!
import plotly.plotly as py

py.sign_in('your_plotly_username', 'your_api_key')
import plotly.graph_objs as go
trace0 = go.Scatter(
        x = [1, 2, 3, 4],
        y = [10, 15, 13, 17]
)
trace1 = go.Scatter(
        x = [1, 2, 3, 4],
        y = [16, 5, 11, 9]
)
data = [trace0, trace1]
plot_url = py.plot(data, filename='basic-line')
*Sign up to get your username, api_key, and stream_token
Downloads
Enjoy!
After making sure that everything works smoothly, you can take this project into bigger project (check it out >> Integrated Weather Station)!
Power through batteries or a plug and you’re good to go!