Pie's Pie Chart

Let's make attractive pie chart in Microsoft Excel.
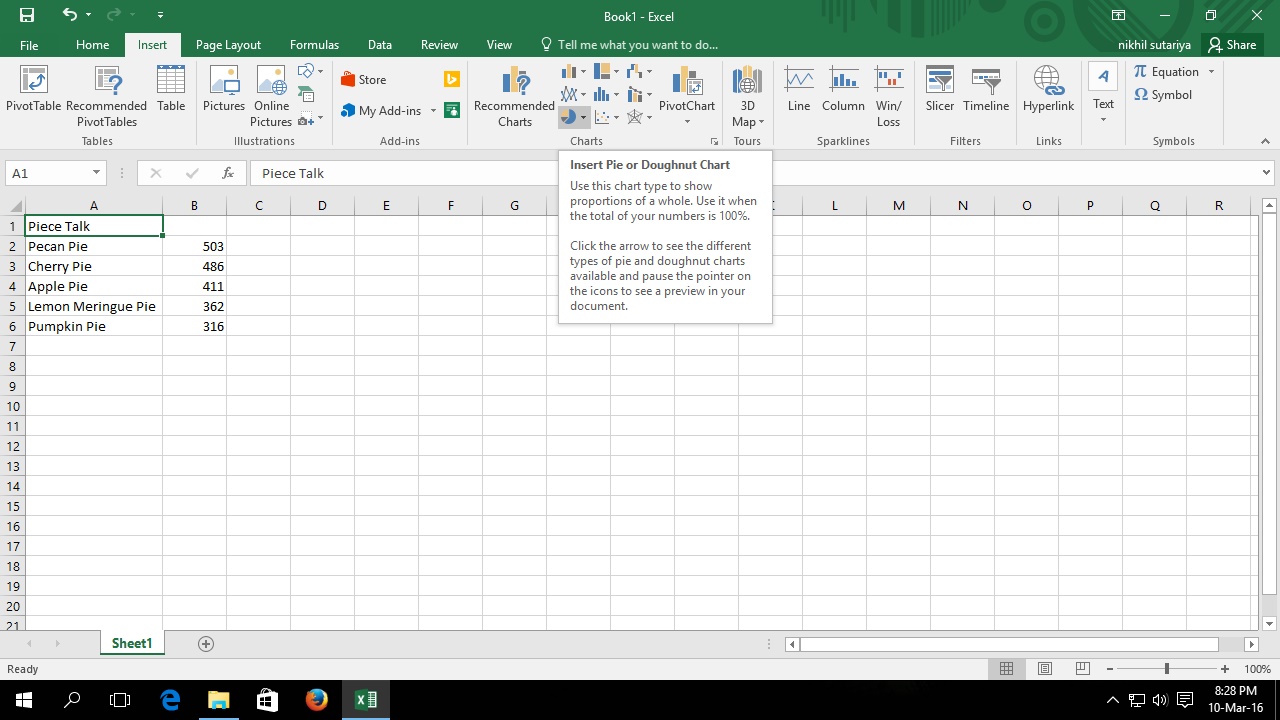
Open your Microsoft Office and select Excel.
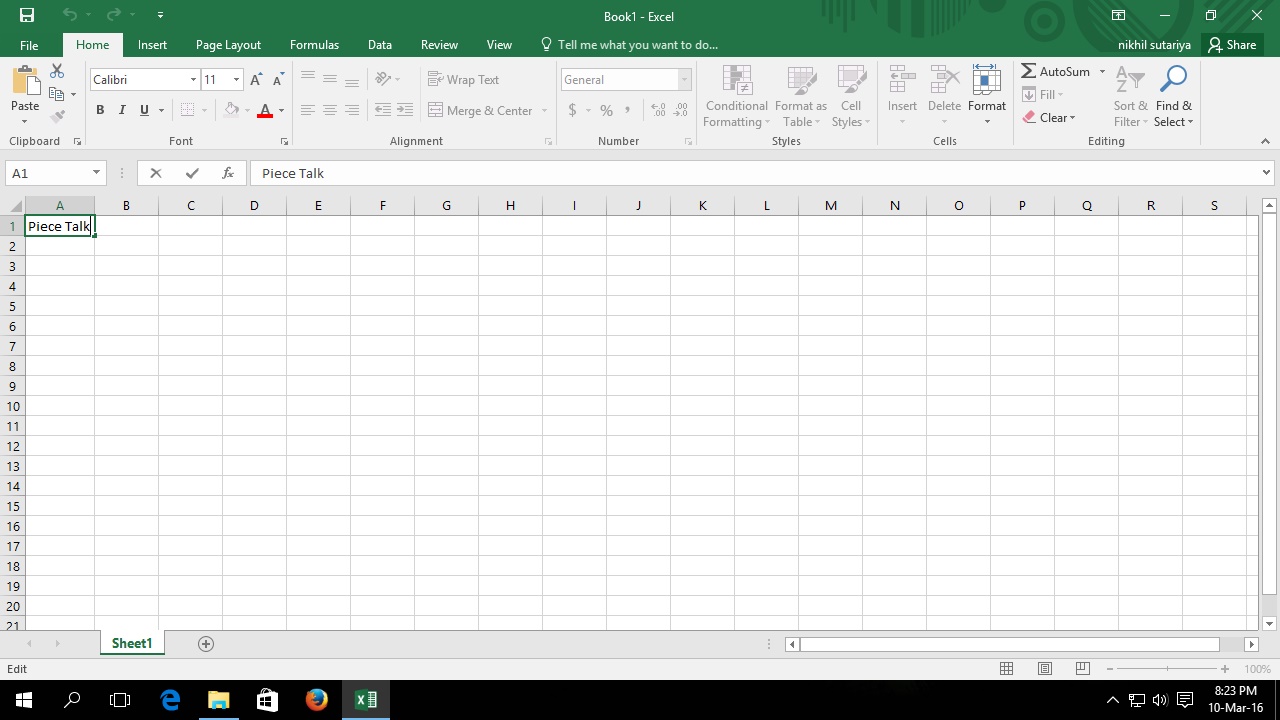
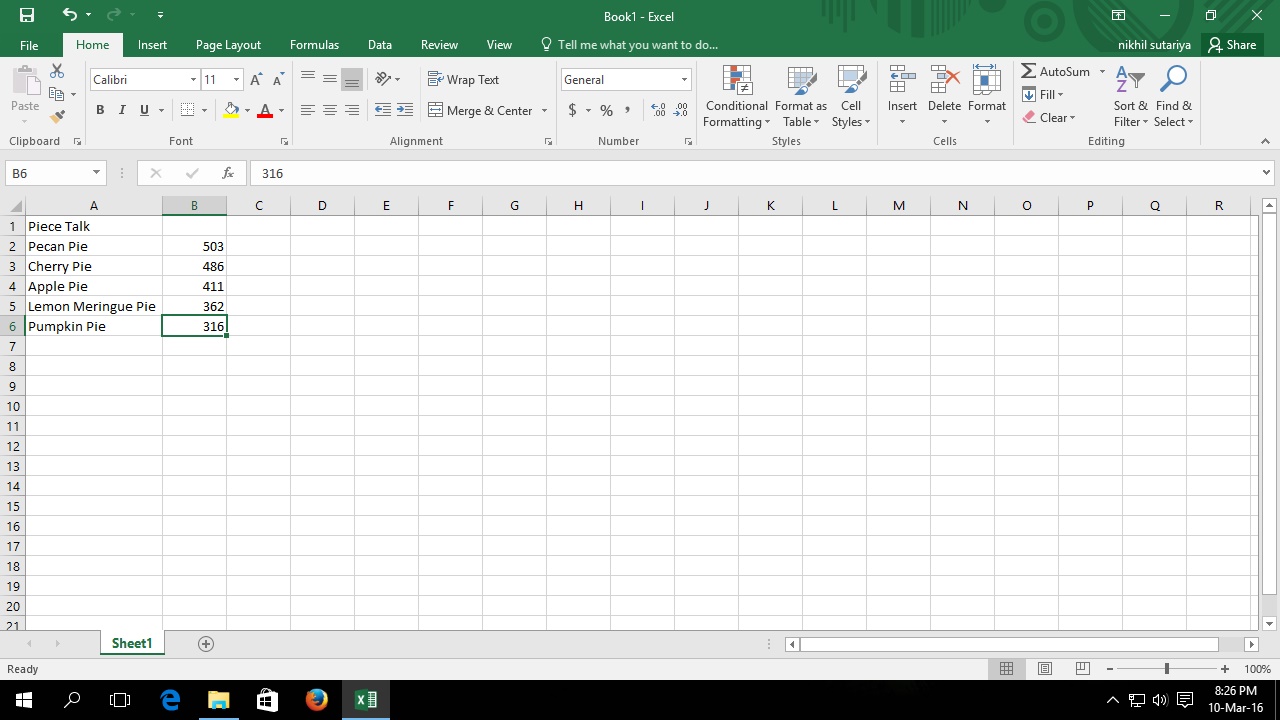
Write your data in it.
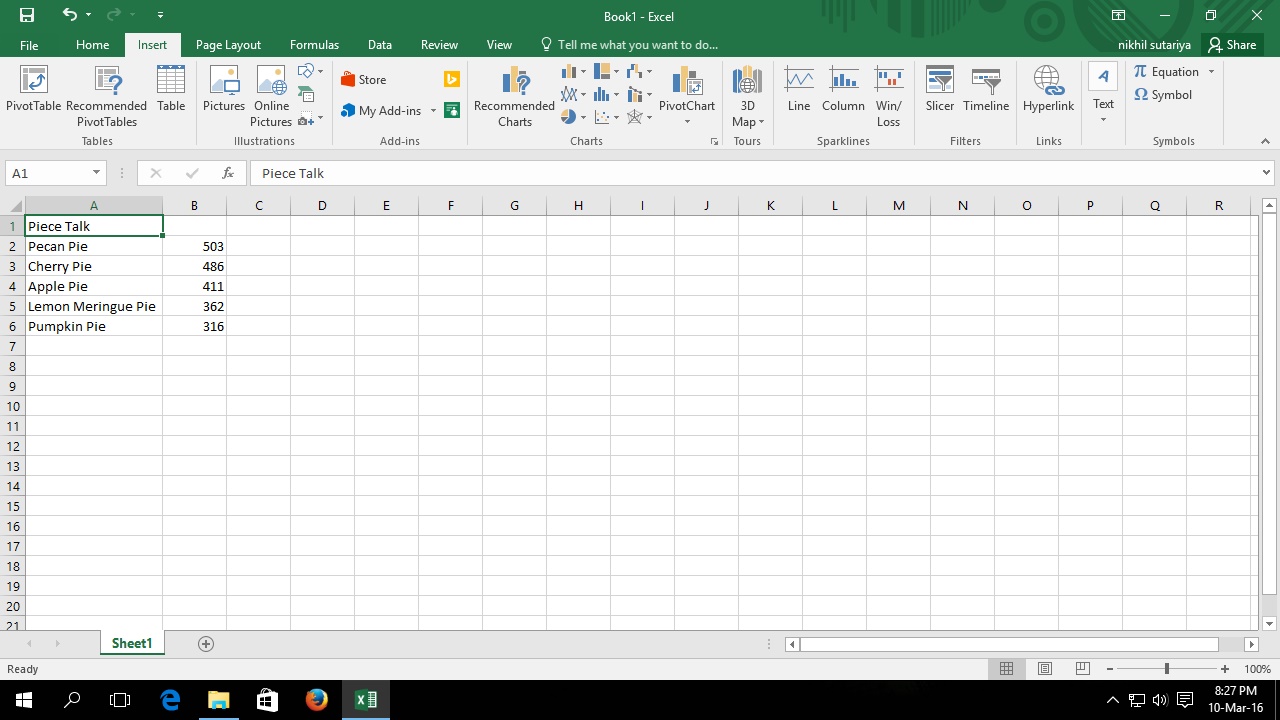
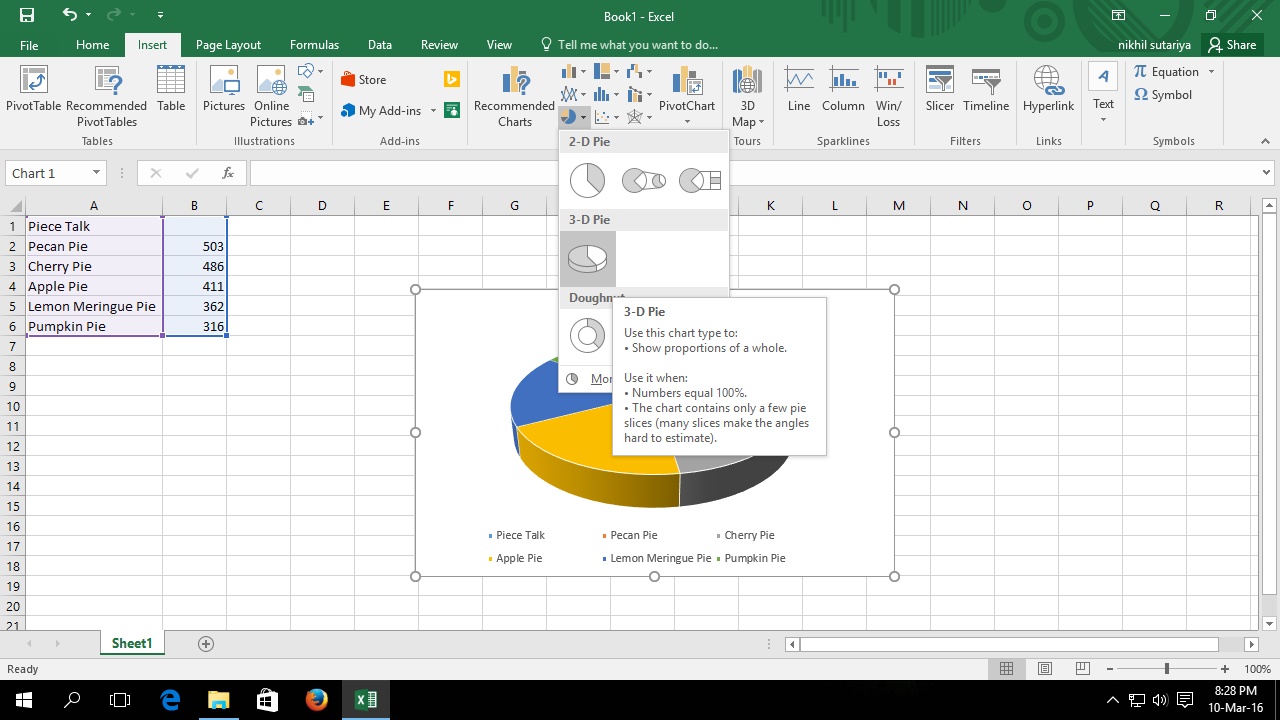
Go to Insert menu and select Insert Pie Chart under the Charts section.
In list menu select 3-D Pie option.
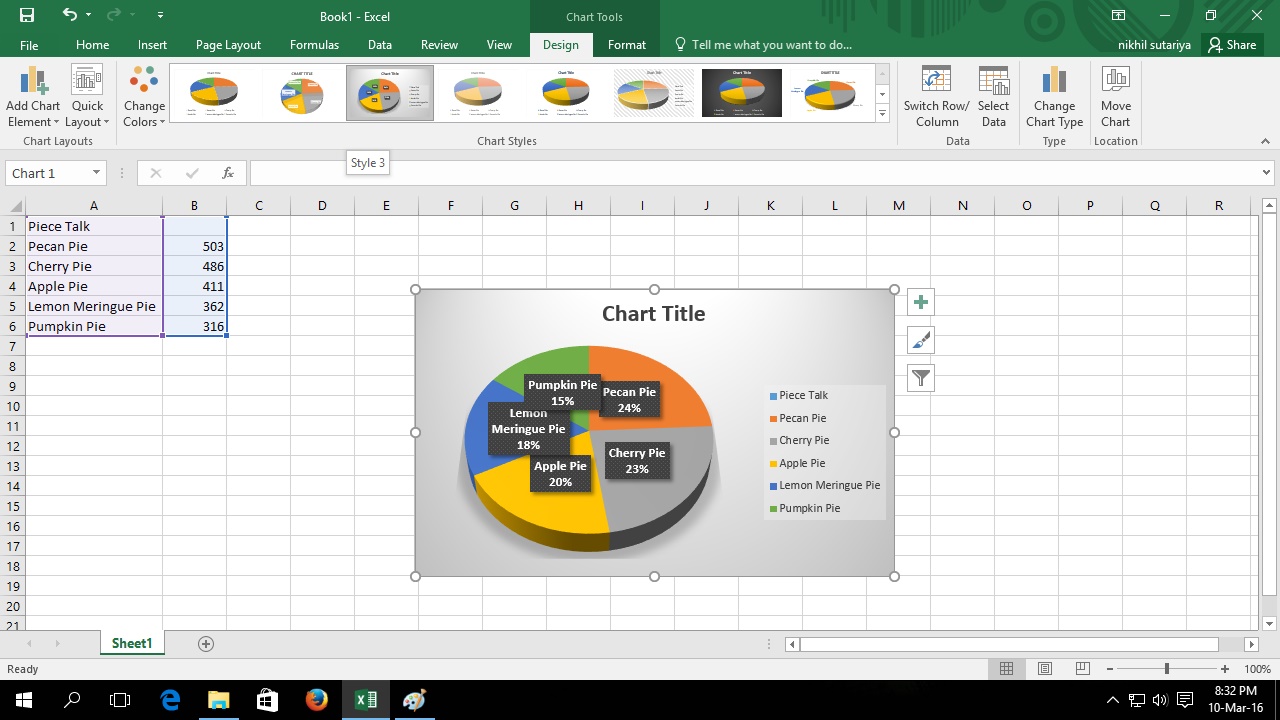
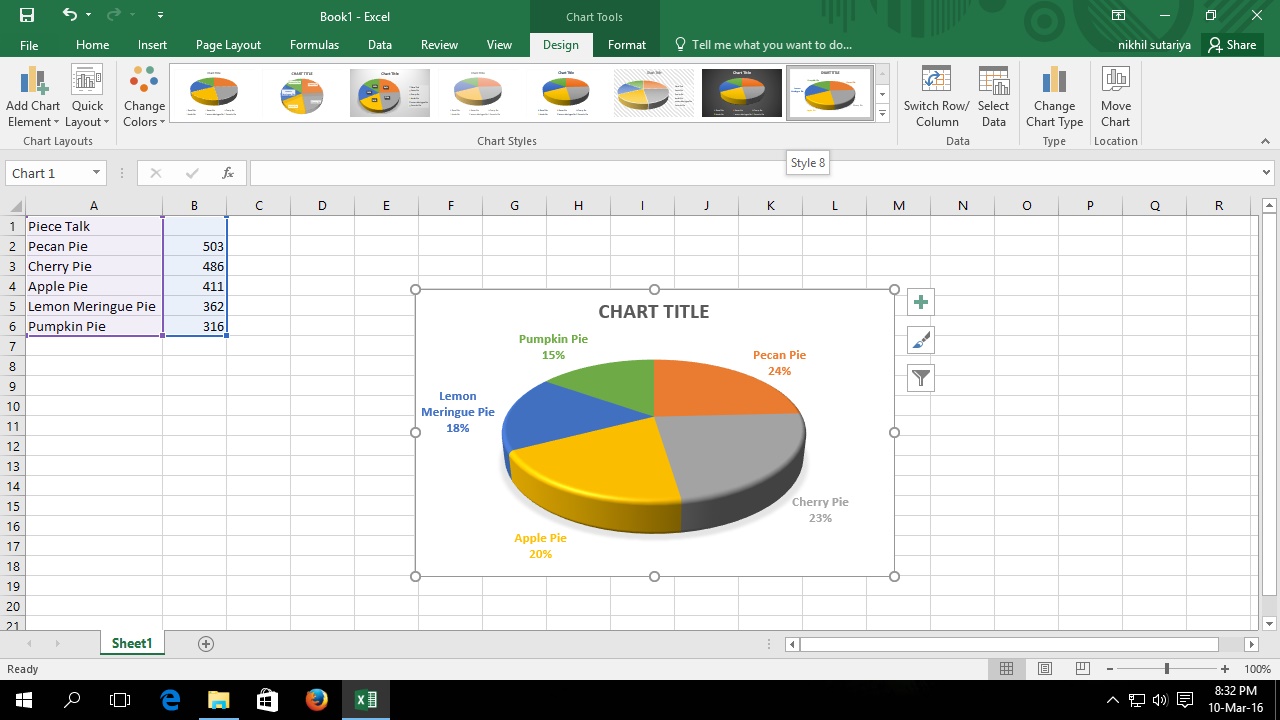
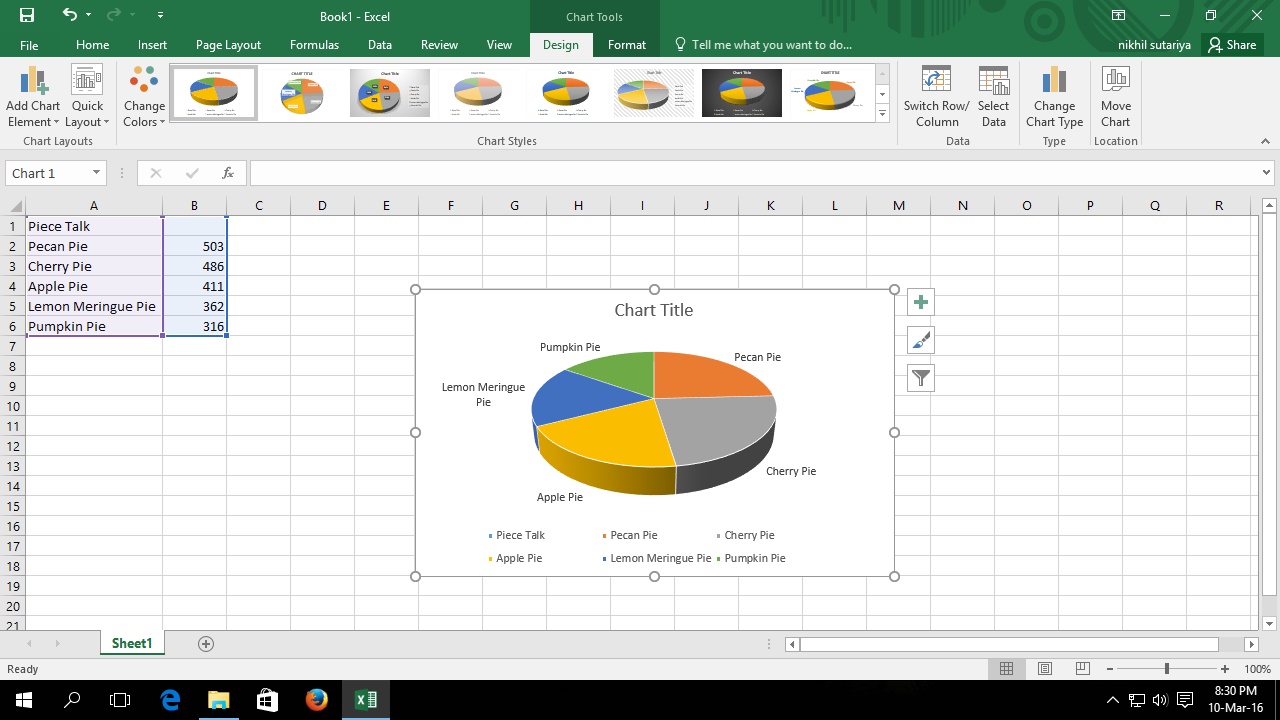
To show percentage, first select Style 3 and then select Style 8 from Chart Styles.

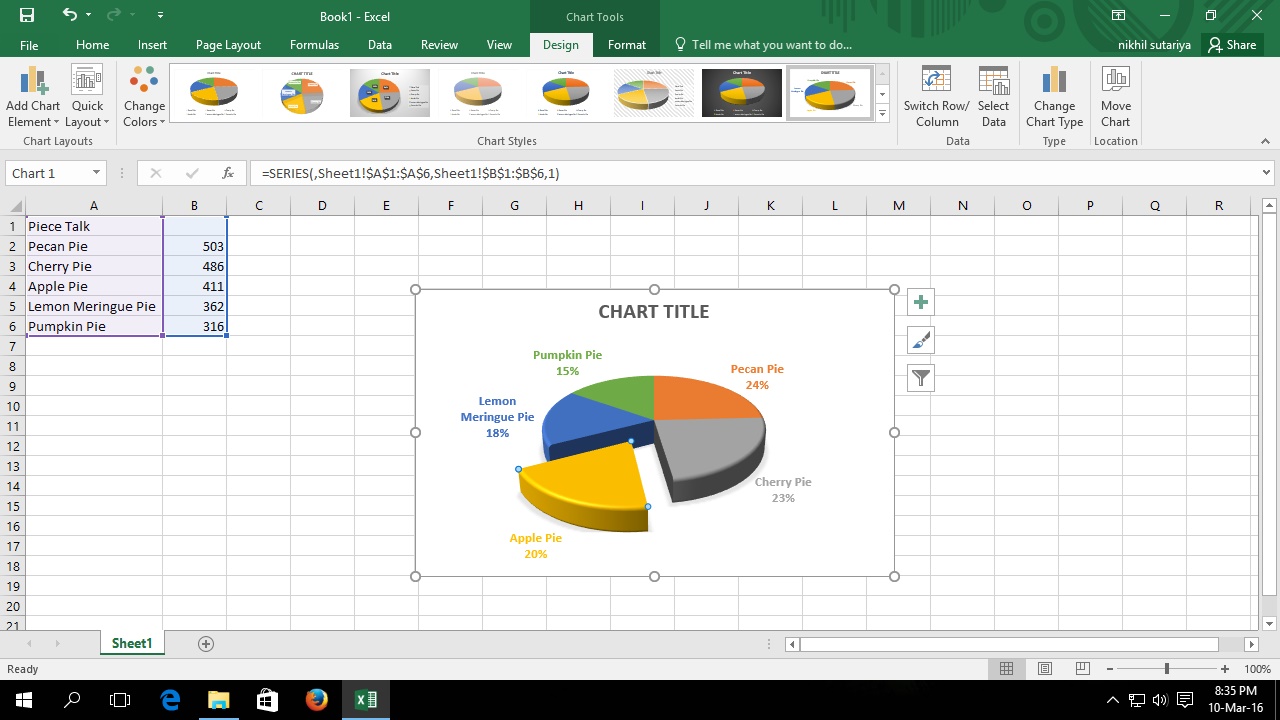
To show any part more specifically like a piece of pie, click on chart and then select a particular piece of pie and then drag it out.
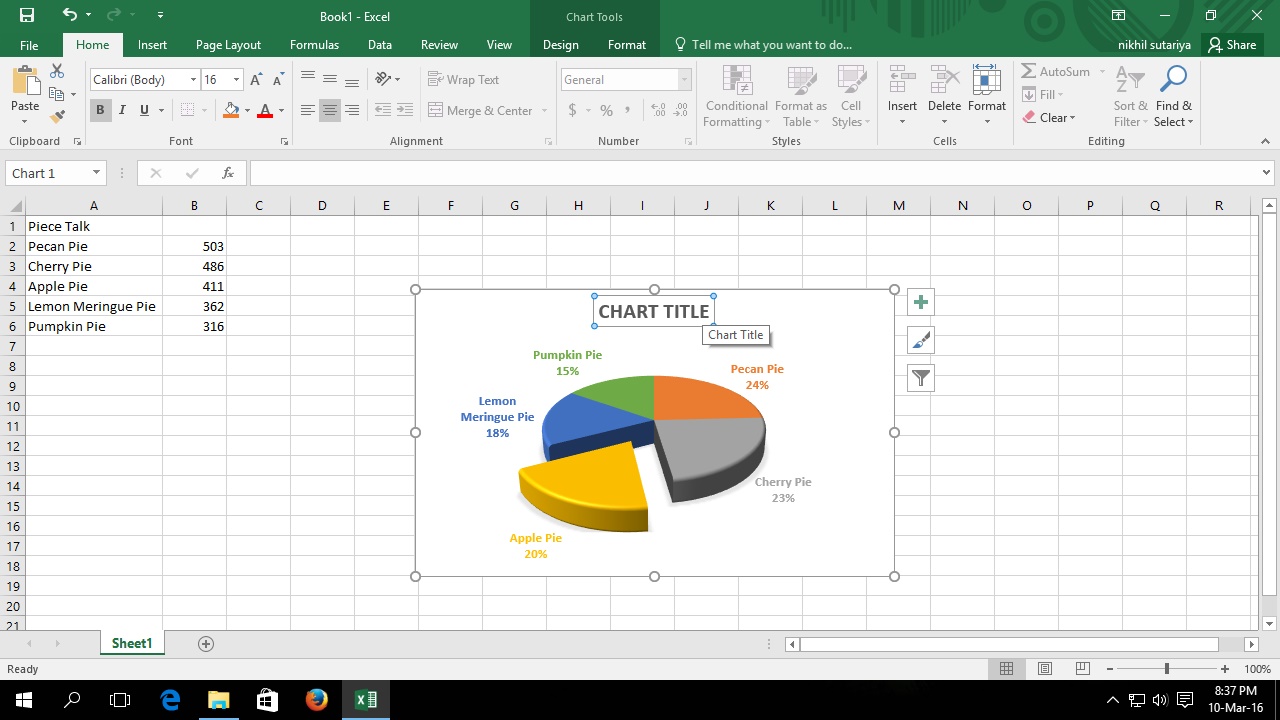

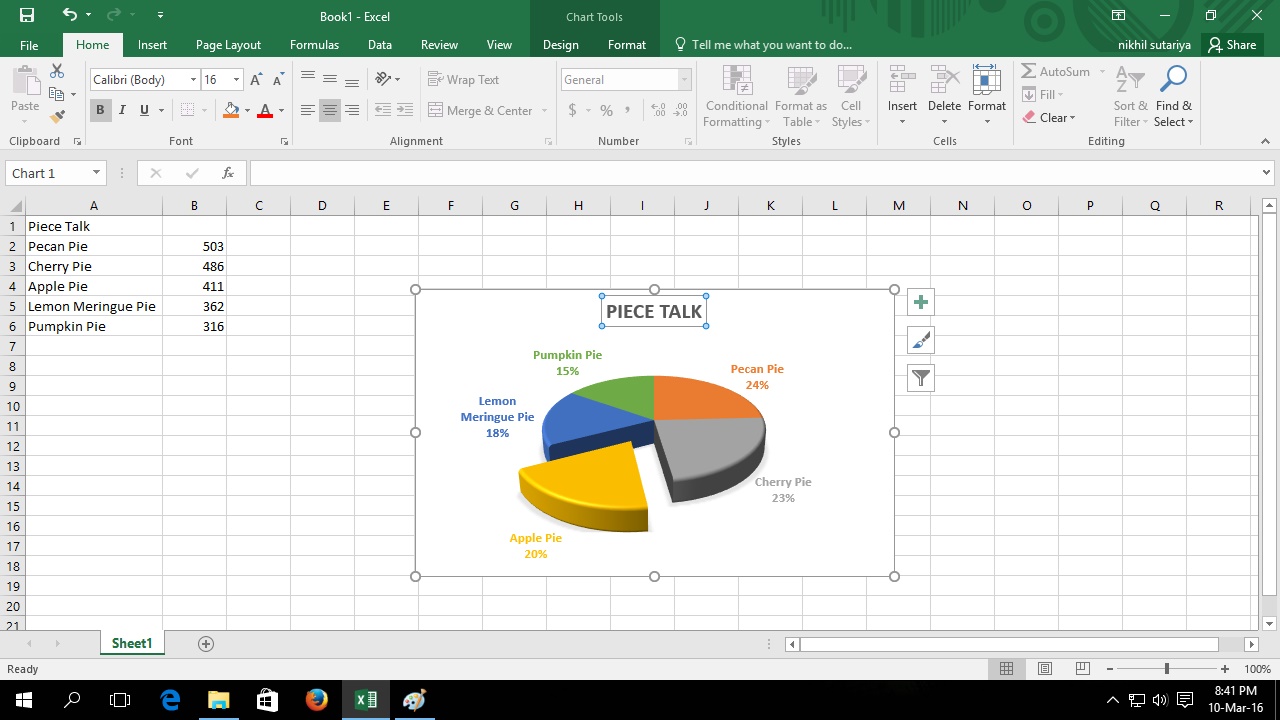
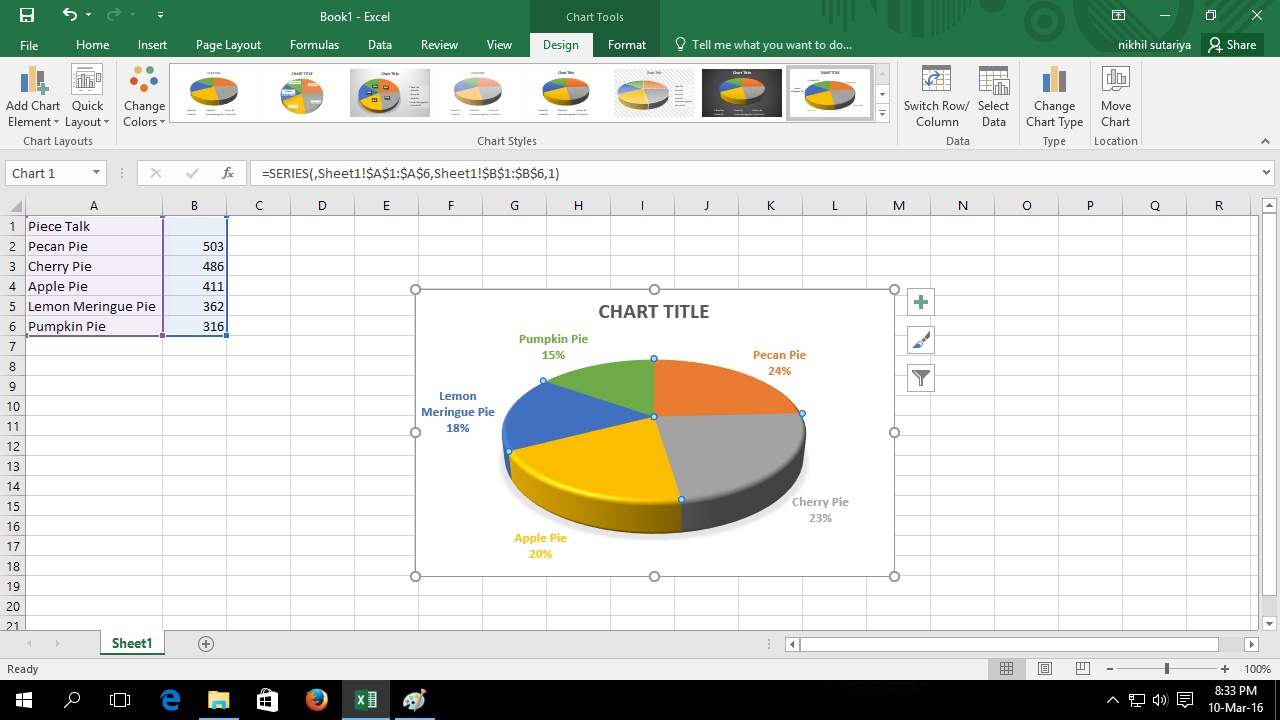
Finally, click on Title in our chart to change it and write your chart title and then press enter.
Now your chart is ready and save your file by pressing Ctrl+S