Pi Health Dashboard

Raspberry Pi's are being used to drive a large number of projects. Pi's were first adopted by teachers and hobbyists, but now manufacturing and businesses have caught on to the amazing power of Pi. Despite being small, user-friendly, and inexpensive, your Pi contains an impressive number of complex subsystems that must work to keep your project running. This makes being able to monitor the health of your Pi important in many applications from ongoing maintenance of a long-term project to profiling the performance of a new prototype.
We are going to build our own browser-based dashboard to monitor the health and performance of a web-connected Raspberry Pi. To accomplish this task, we will run a simple Python script that will collect system information from the Pi and send it to a cloud platform that specializes in dashboards, analytics, and visualizations.
In this step-by-step tutorial, you will:
- learn how to collect system information from your Pi via a simple Python script
- learn how to use Initial State to build your own system health/performance dashboard for your Pi
Initial State

We want to stream all of our Pi system utilization data to a cloud service and have that service turn our data into a dashboard. Our data needs a destination so will use Initial State as that destination.
Register for Initial State Account
Go to https://iot.app.initialstate.com and create a new account. You get a 14 day free trial and anyone with an edu email address can register for a free student plan.
Install the ISStreamer
Install the Initial State Python module onto your Raspberry Pi. In the command prompt, run the following command:
$ cd /home/pi/
$ \curl -sSL https://get.initialstate.com/python -o - | sudo bash
Make Some Automagic
After Step 2 you will see something similar to the following output to the screen:
pi@raspberrypi ~ $ \curl -sSL https://get.initialstate.com/python -o - | sudo bash
Password:
Beginning ISStreamer Python Easy Installation!
This may take a couple minutes to install, grab some coffee :)
But don't forget to come back, I'll have questions later!

Found easy_install: setuptools 1.1.6
Found pip: pip 1.5.6 from /Library/Python/2.7/site-packages/pip-1.5.6- py2.7.egg (python 2.7)
pip major version: 1
pip minor version: 5
ISStreamer found, updating...
Requirement already up-to-date: ISStreamer in /Library/Python/2.7/site-packages
Cleaning up...Do you want automagically get an example script? [y/N]
Where do you want to save the example? [default: ./is_example.py]

Please select which Initial State app you're using:
1. app.initialstate.com
2. [NEW!] iot.app.initialstate.com
Enter choice 1 or 2:
Enter iot.app.initialstate.com user name:
Enter iot.app.initialstate.com password:
When asked if you want to automagically get an example script put "y" for yes and press enter to save your script in the default location. For the question about which app you are using, select 2 (unless you signed up before November 2018) and enter your username and password.
Run the Example Script
Run the test script to make sure we can create a data stream to your Initial State account. Write the following command:
$ python is_example.py
Example Data
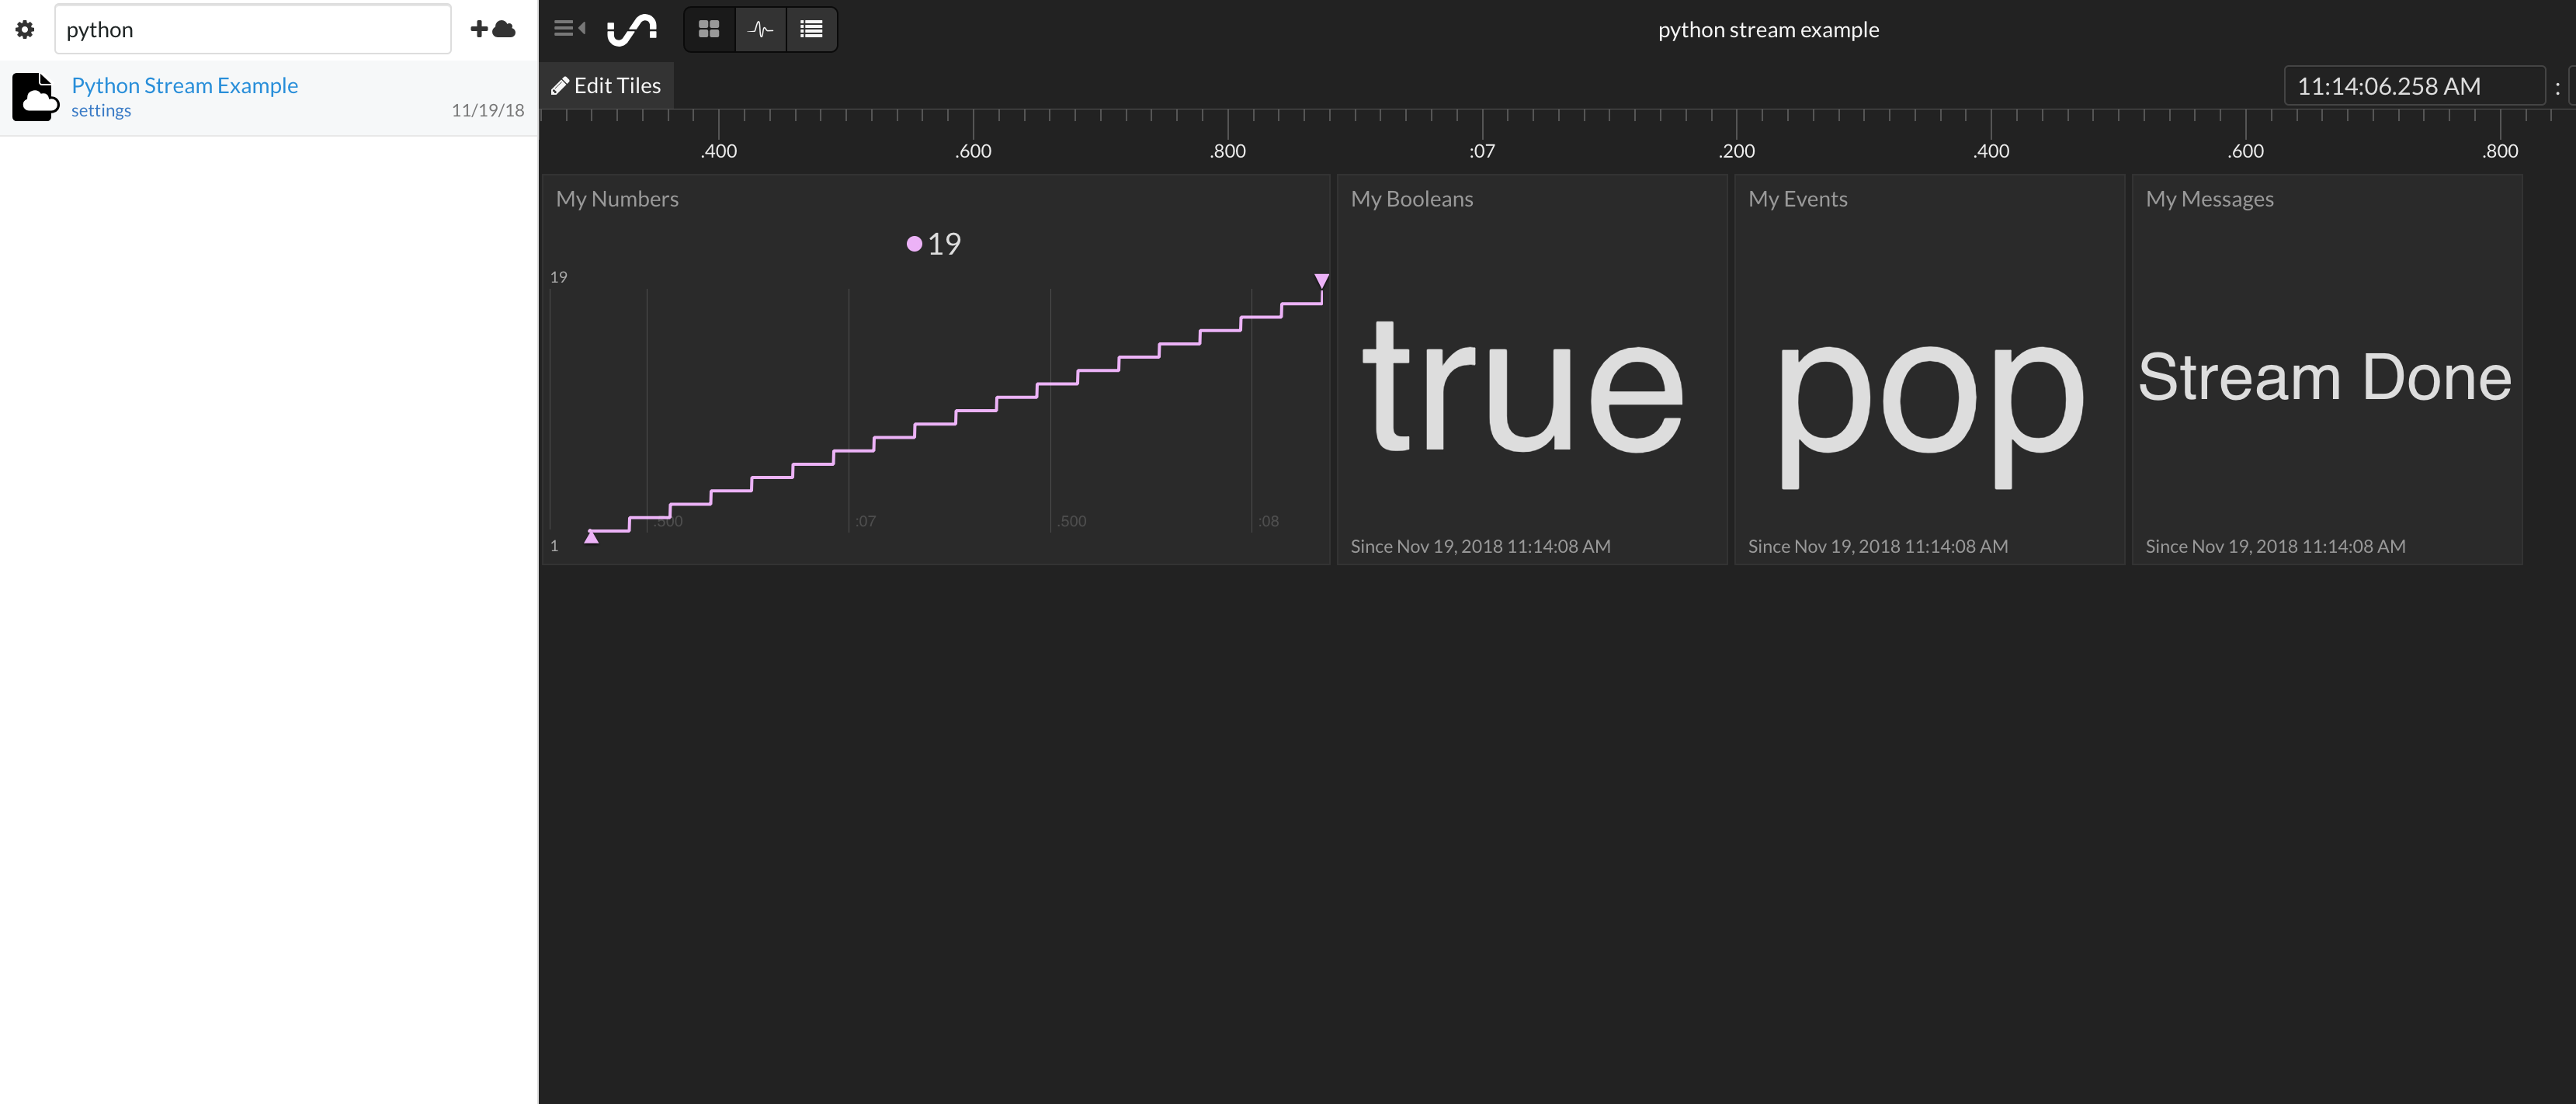
Go back to your Initial State account in your web browser. A new data bucket called “Python Stream Example” should have shown up on the left in your log shelf (you may have to refresh the page). Click on this bucket to view your data.
Psutil
We will use psutil to get easy access to the majority of the system information we will use to build our dashboard. To install the psutil Python library, go to a terminal on your Pi and type:
$ sudo pip install psutil
After installation completes, we simply need to run a Python script to begin data collection. Let's put this script in its own directory as follows:
$ cd /home/pi/
$ mkdir pihealth
$ cd pihealth
Once in the new directory, create a script by doing the following:
$ nano pihealth.py
This will open a text editor. Copy and paste the code from this Github repository into the text editor.
On line 8, you will see the User Settings section:
# --------- User Settings ---------
# Initial State settings
BUCKET_NAME = ":computer: Pi3 Performance"
BUCKET_KEY = "pi0708"
ACCESS_KEY = "PUT YOUR INITIAL STATE ACCESS_KEY HERE"
# Set the time between checks
MINUTES_BETWEEN_READS = 1
METRIC_UNITS = False
# ---------------------------------
You will need to place your Initial State access key in the ACCESS_KEY variable assignment. To find this go to your Initial State homepage, click your username on the top right, go to my settings and find a streaming access key there. If you do not do this, your data will not be streamed into your Initial State account, making you very sad and frustrated.
The MINUTES_BETWEEN_READS variable is important to set based on your application. If you are going to run this script over the course of days/weeks/months, you will want to make this a larger number like every 2-5 minutes. If you are running this script to monitor the performance of a short-term application, you may want an update every few seconds.
Once you have updated the text, save and exit the text editor. We are ready to start collecting system data. To run the python file type the following command:
$ python pihealth.py
Tip: If you want to run this script in the background and be sure that it doesn't exit if your SSH connection is broken or the terminal is closed, you can use the following command:
$ nohup python pihealth.py &
python.h error: If you get an error referencing python.h whenever you try to use psutil in a script, installing the python development libraries may resolve the error:
$ sudo apt-get install gcc python-dev
$ sudo pip install psutil
Customize Your Dashboard


Go to your Initial State account and click on the new data bucket called Pi3 Performance. This is your dashboard. Let's customize and organize the data on this dashboard into something useful.
There are a lot of Tiles and data streams in this dashboard. Let's make the Tiles smaller and get all of the information onto a single screen. Click on the Edit Tiles button in the top left corner and deselect "Always Fit Tiles". This puts our dashboard layout into manual mode. Next, resize each tile to 1/4 its original size by clicking and dragging the corner of each Tile while in edit mode. You can drag each Tile to whatever position you like on the screen.
One of the many nifty things you can do with this dashboard is create multiple Tiles and data views per data stream. For example, you can create Tiles to see the line graph for CPU Temperature as well as a gauge graph and the last value. To add a new tile, click on Edit Tiles then +Add Tile. The new Tiles configuration box will popup. Select the data stream that will drive this Tile in the SignalKey box, then choose the Tile Type, and create a title for this tile.
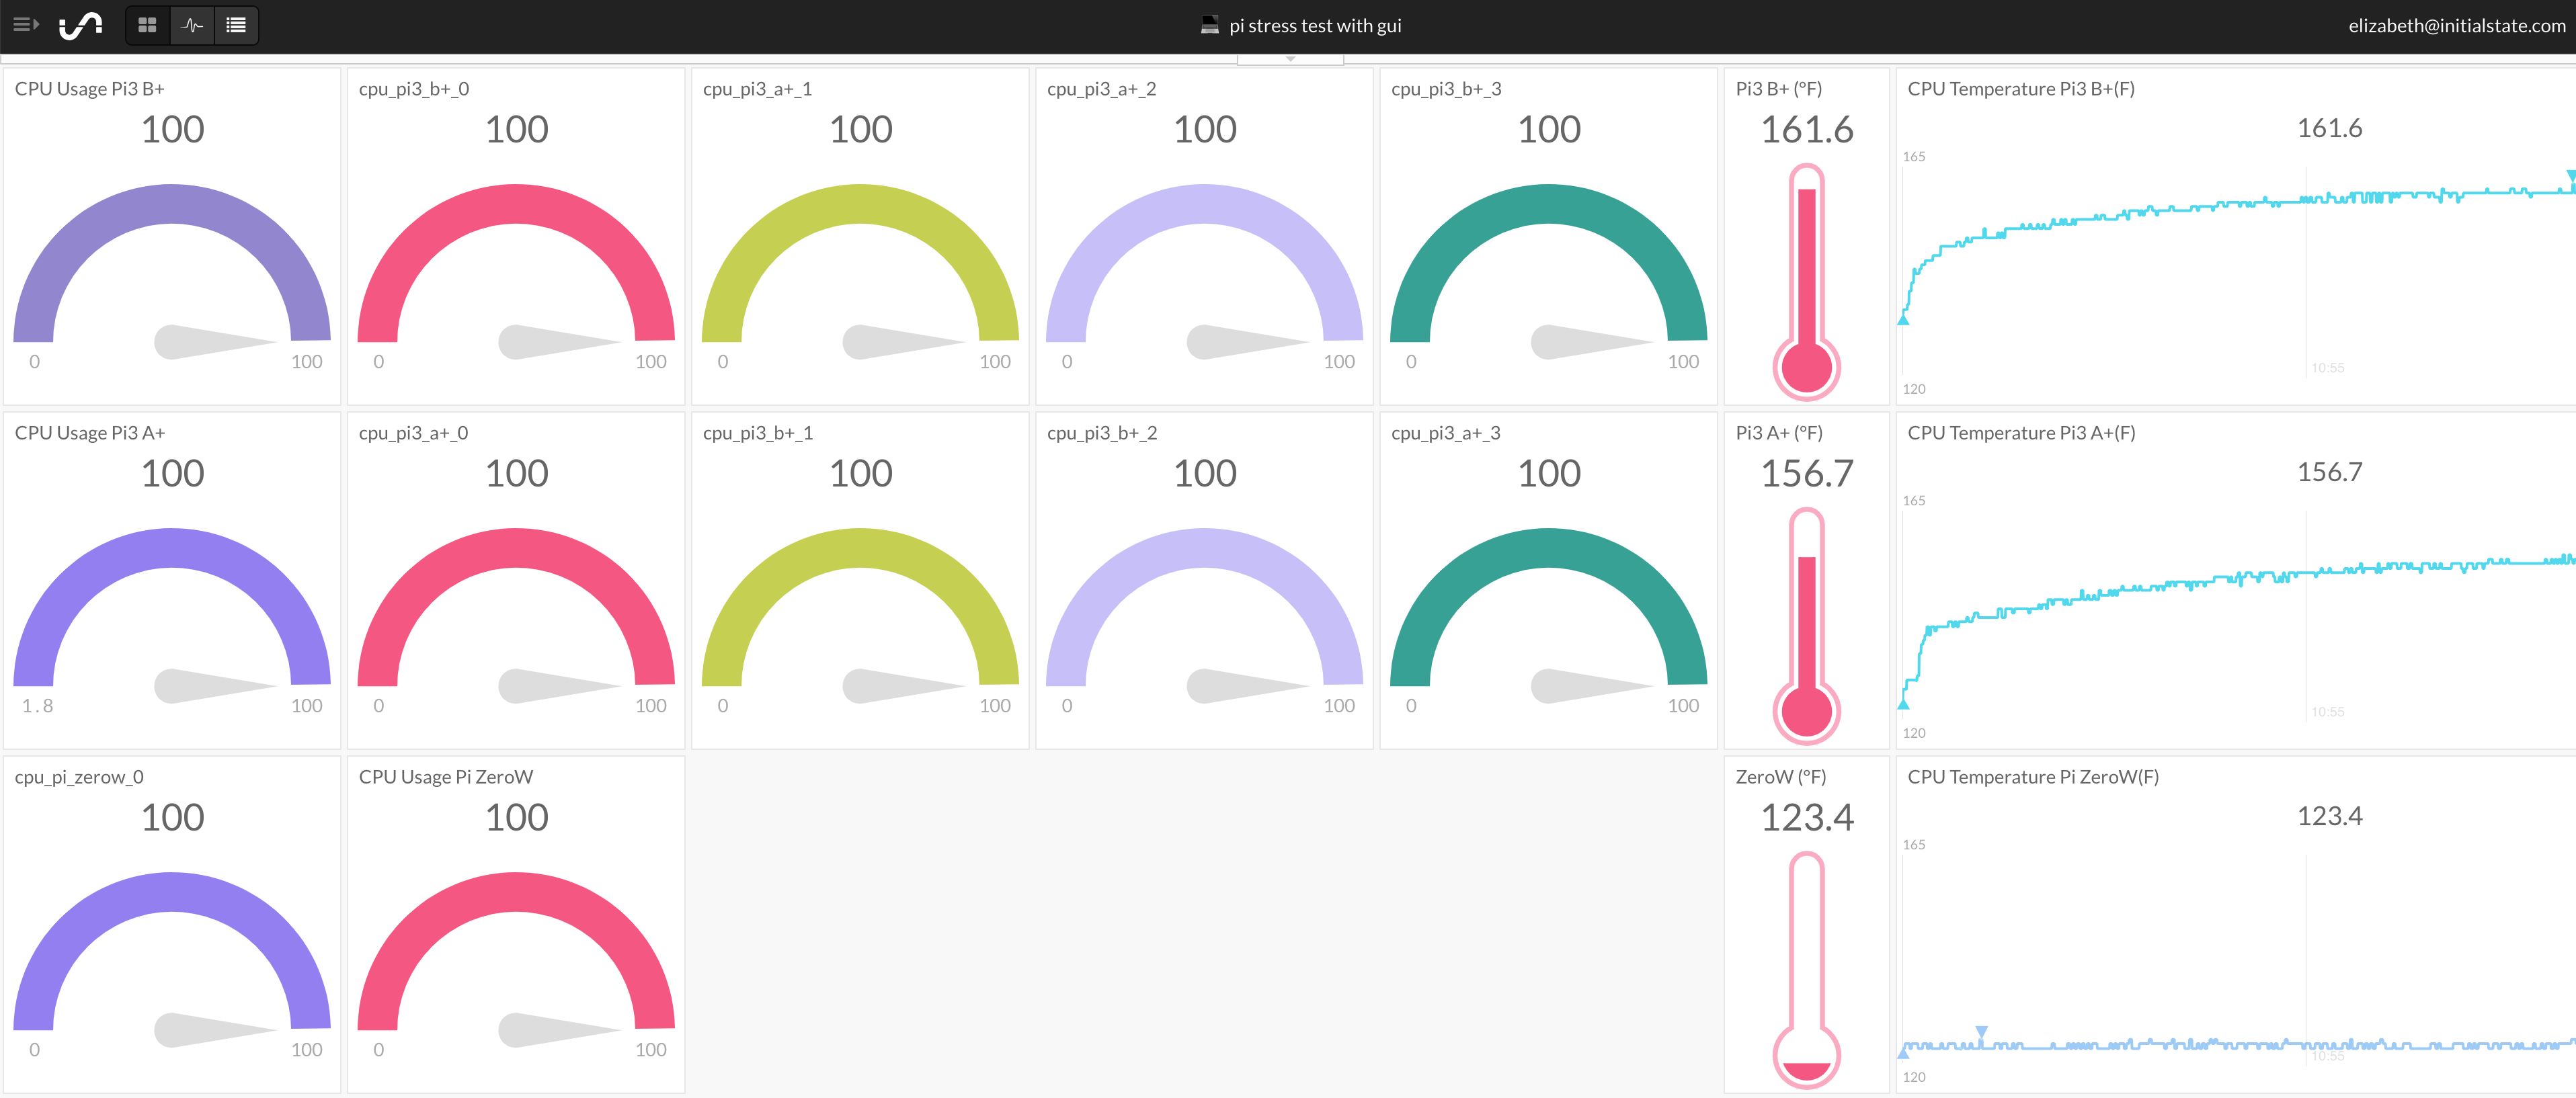
In my dashboard, I streamed three Pi's into a single dashboard to compare CPU usage and temperatures.
The gauge graph is extremely useful for data streams such as Disk Usage(%) and CPU Usage(%). When you select a gauge graph view, you can set the min and max value for the gauge in the Tile Configuration. It is important to set the min/max to 0/100 for Disk Usage(%) and CPU Usage(%) gauges so that the Tiles make sense.
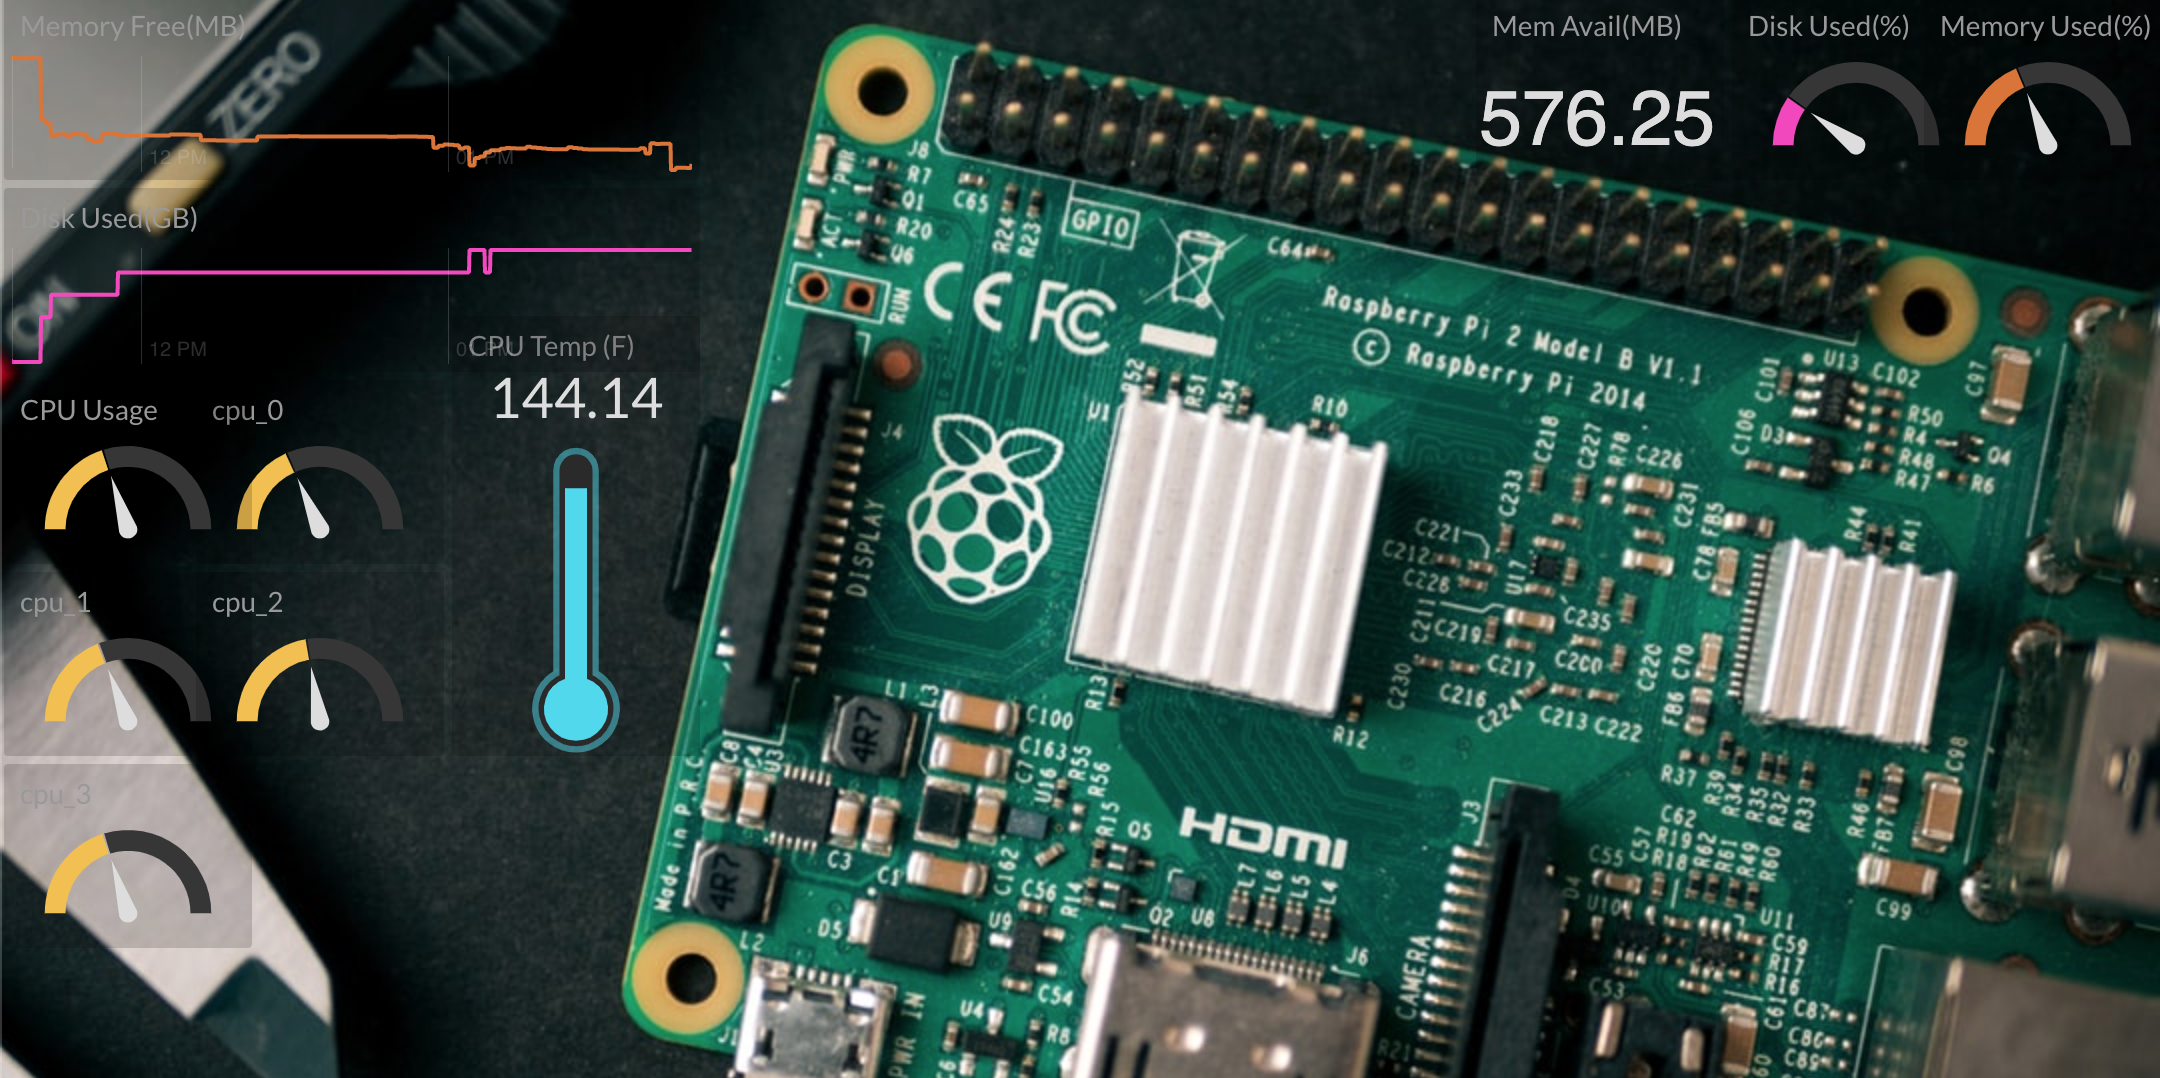
You can add a background image to your dashboard to give you data more context.
Here is the public shares of two dashboards I created: