Particle Powered Air Quality Monitor
by jaredwolff in Circuits > Arduino
1689 Views, 7 Favorites, 0 Comments
Particle Powered Air Quality Monitor

Air quality.
You probably think about it more now that our clean air has turned into a permanent haze across the sky.
Yuck.
One thing you do have control over is the air quality inside your home. In this tutorial, I'll show you how to build an air quality sensor in a few short steps.
Gather the Goods
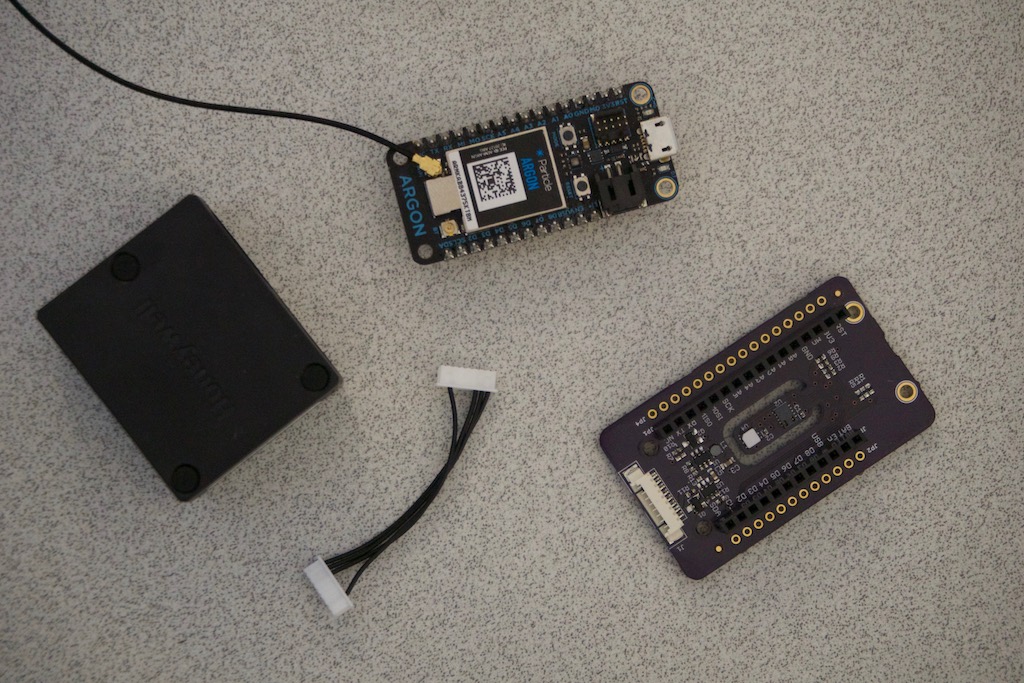
Get everything together that you'll need for this project.
This includes:
- A Particle Mesh board (Argon, Boron, Xenon). You can get them almost anywhere. Buying direct always works too.
- Particle^2 Air Quality Sensor.
- Honeywell HPMA115S0 Particle Sensor.
- Cable for HPMA115S0 Sensor. (The last three you can get here.)
Assemble Them
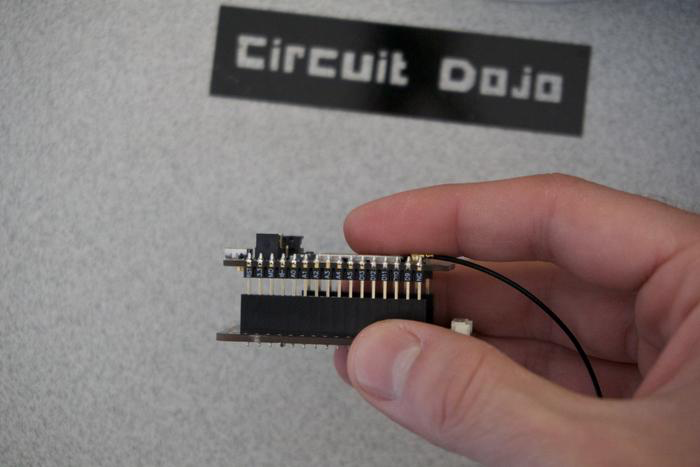
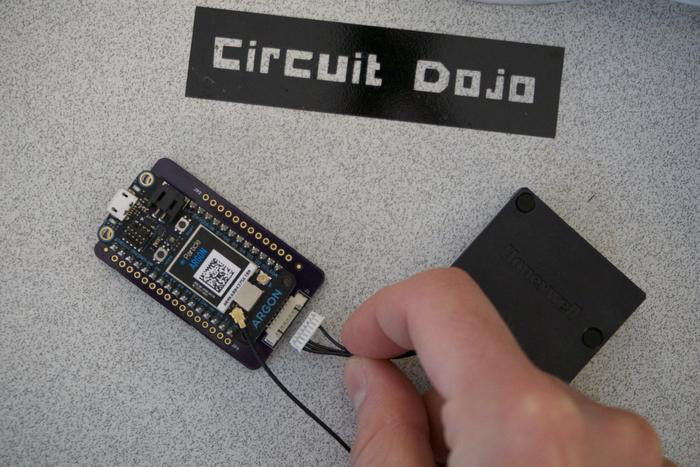
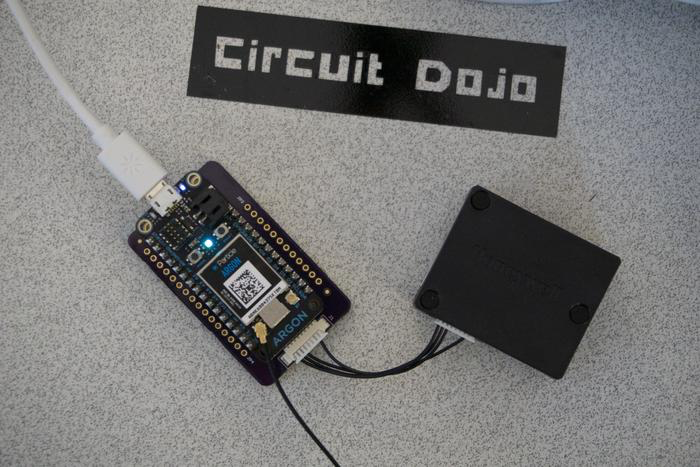
- Attach the Particle to the Particle^2 board
- Connect the HPM Particle sensor to the Particle^2 using the cable
- Plug in USB!
Configure Google Docs - Create the Script
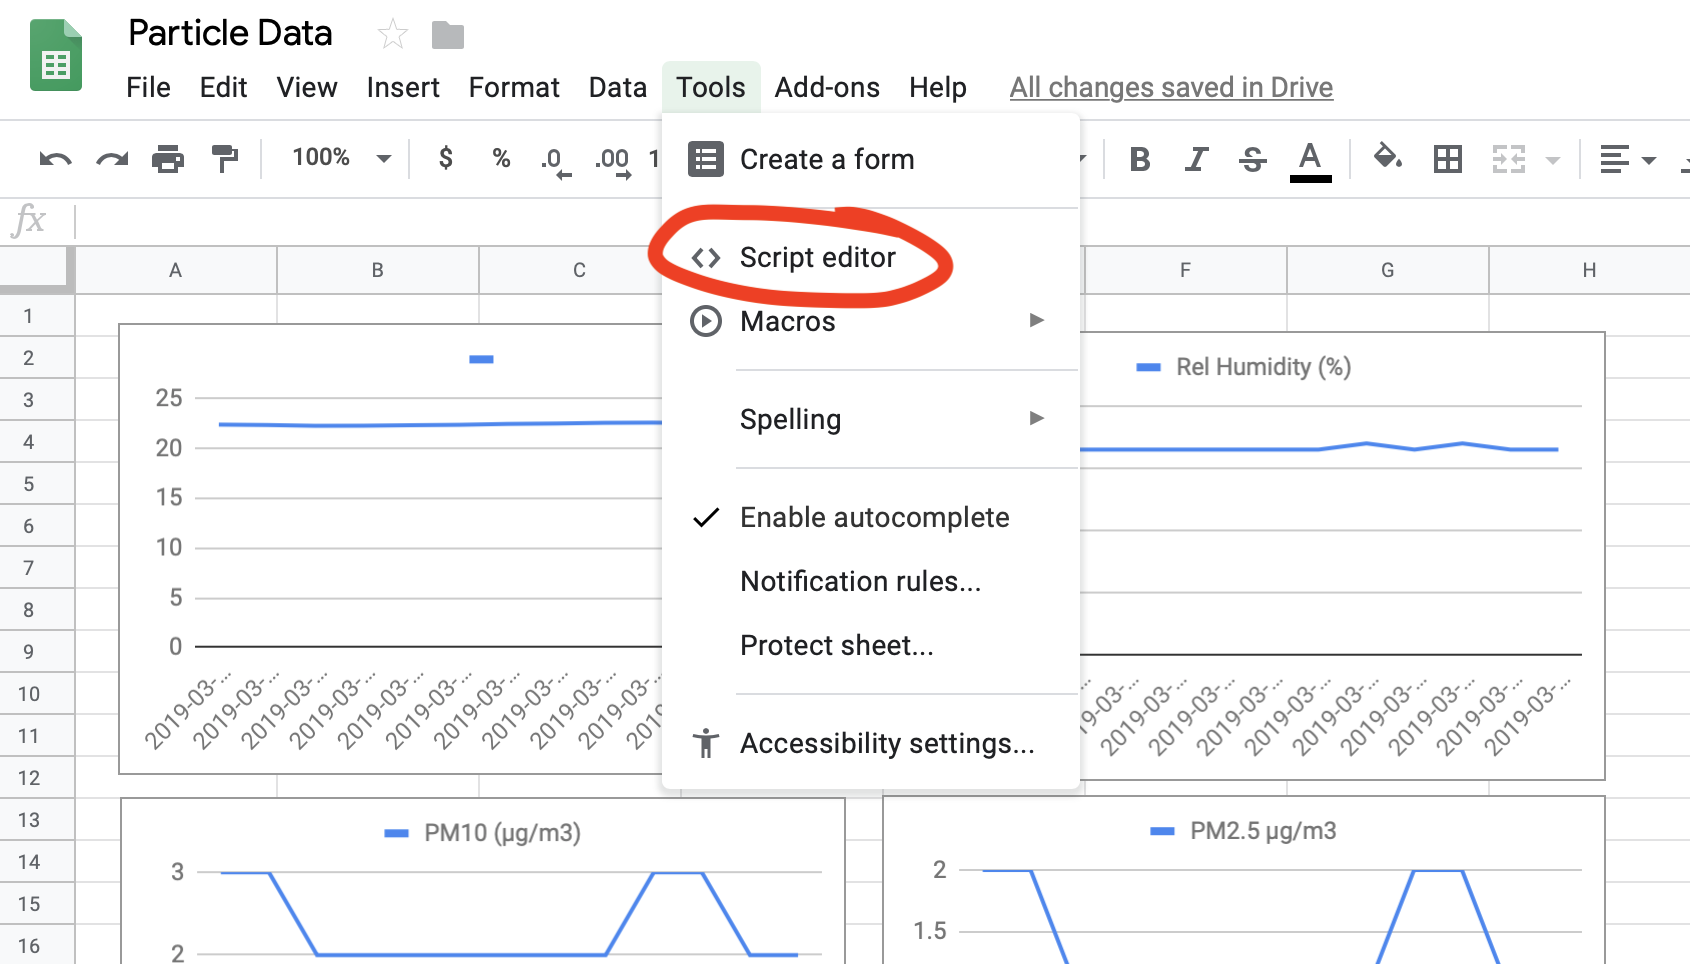
- Create a new Google Sheet
- Then click the Tools menu and click Script Editor
- Create a new script
- Insert the below code into the script:
//this is a function that fires when the webapp receives a POST request
function doPost(e) {//Return if null if( e == undefined ) { Logger.log(“no data”); return HtmlService.createHtmlOutput(“need data”); }
//Parse the JSON data var event = JSON.parse(e.postData.contents); var data = JSON.parse(event.data);
//Get the last row without data var sheet = SpreadsheetApp.getActiveSheet(); var lastRow = Math.max(sheet.getLastRow(),1); sheet.insertRowAfter(lastRow);
//Get current timestamp var timestamp = new Date();
//Insert the data into the sheet sheet.getRange(lastRow + 1, 1).setValue(event.published_at); sheet.getRange(lastRow + 1, 2).setValue(data.temperature); sheet.getRange(lastRow + 1, 3).setValue(data.humidity); sheet.getRange(lastRow + 1, 4).setValue(data.pm10); sheet.getRange(lastRow + 1, 5).setValue(data.pm25); sheet.getRange(lastRow + 1, 6).setValue(data.tvoc); sheet.getRange(lastRow + 1, 7).setValue(data.c02);
SpreadsheetApp.flush(); return HtmlService.createHtmlOutput(“post request received”); }
Configure Google Docs - Configure the Webhook
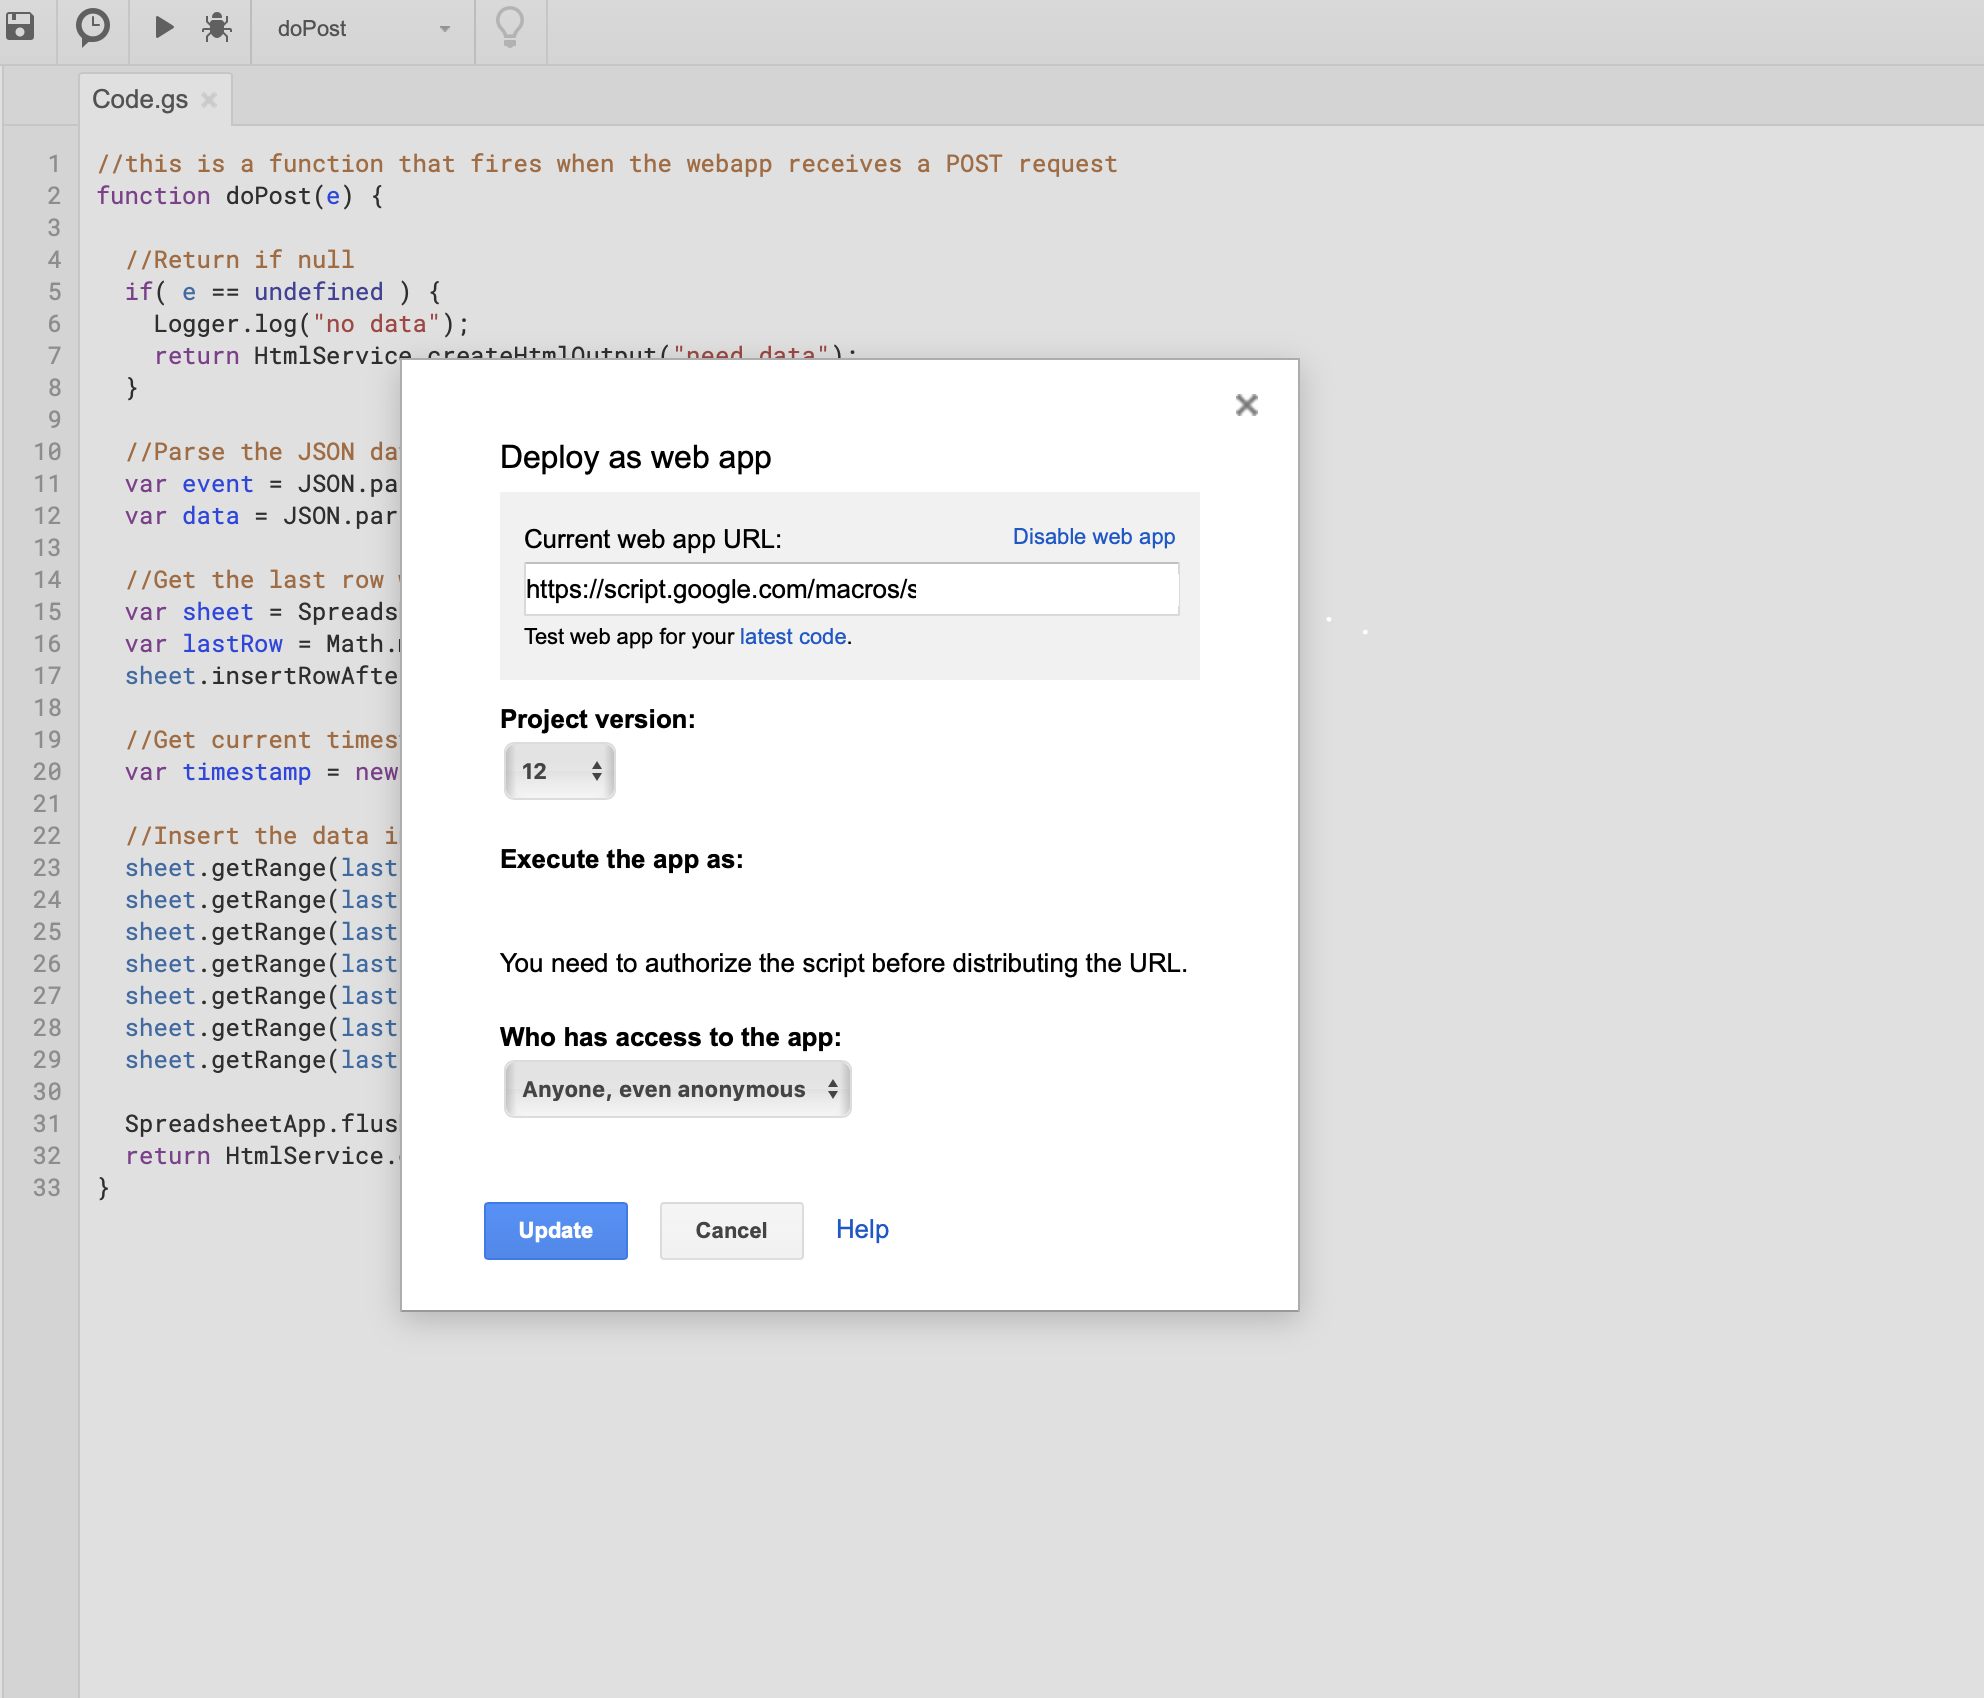
Then,
- Go to Publish and click Deploy as Web App
- Set Execute the app as yourself
- Then set Who has access to the app to Anyone, even anonymous. (Important: if you're working with. mission critical data, you may want a more robust and custom solution. This allows anyone, if they have your web hook link to post data to that page!)
- Change the Project Version to new and deploy!
- Copy the Current App URL that the output provides.
Configure Particle Cloud
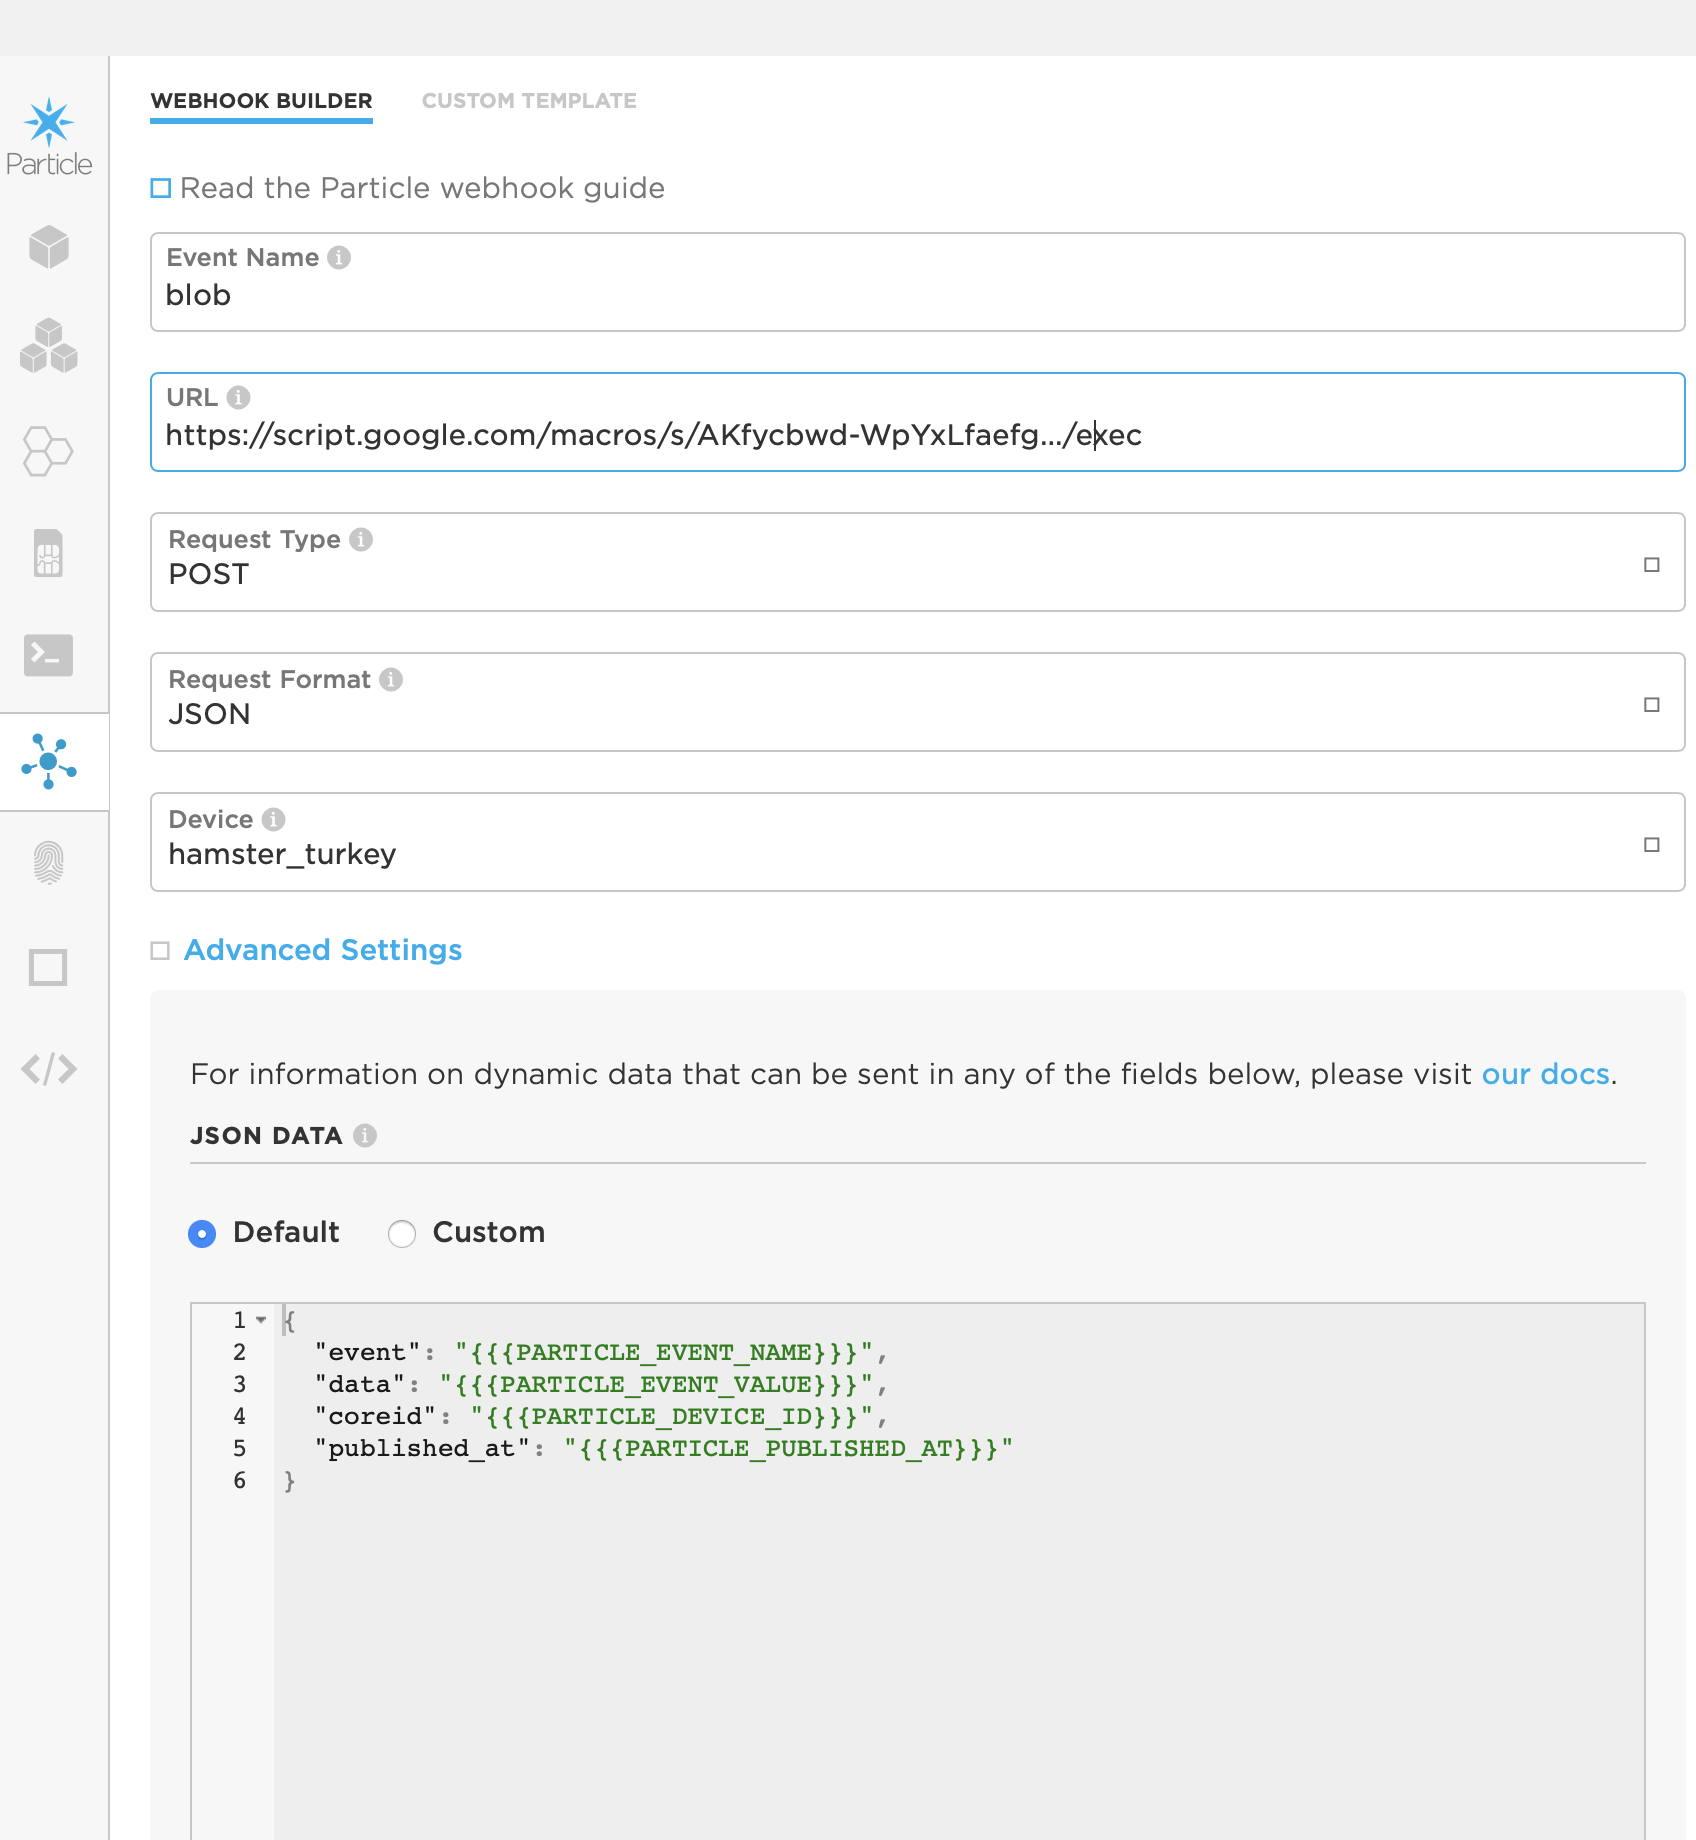
- In the Particle.io console, go to the Integrations section and Create a New Webhook
- Fill in the name of the event that get's forwarded from the code (in this case it's blob)
- Enter the Current App URL from the last step in the URL Box
- Set the request type to POST
- Set the request format to JSON
- Target the device you'll be using (or leave it as is if you only have one device)
- Click save
Program the Board
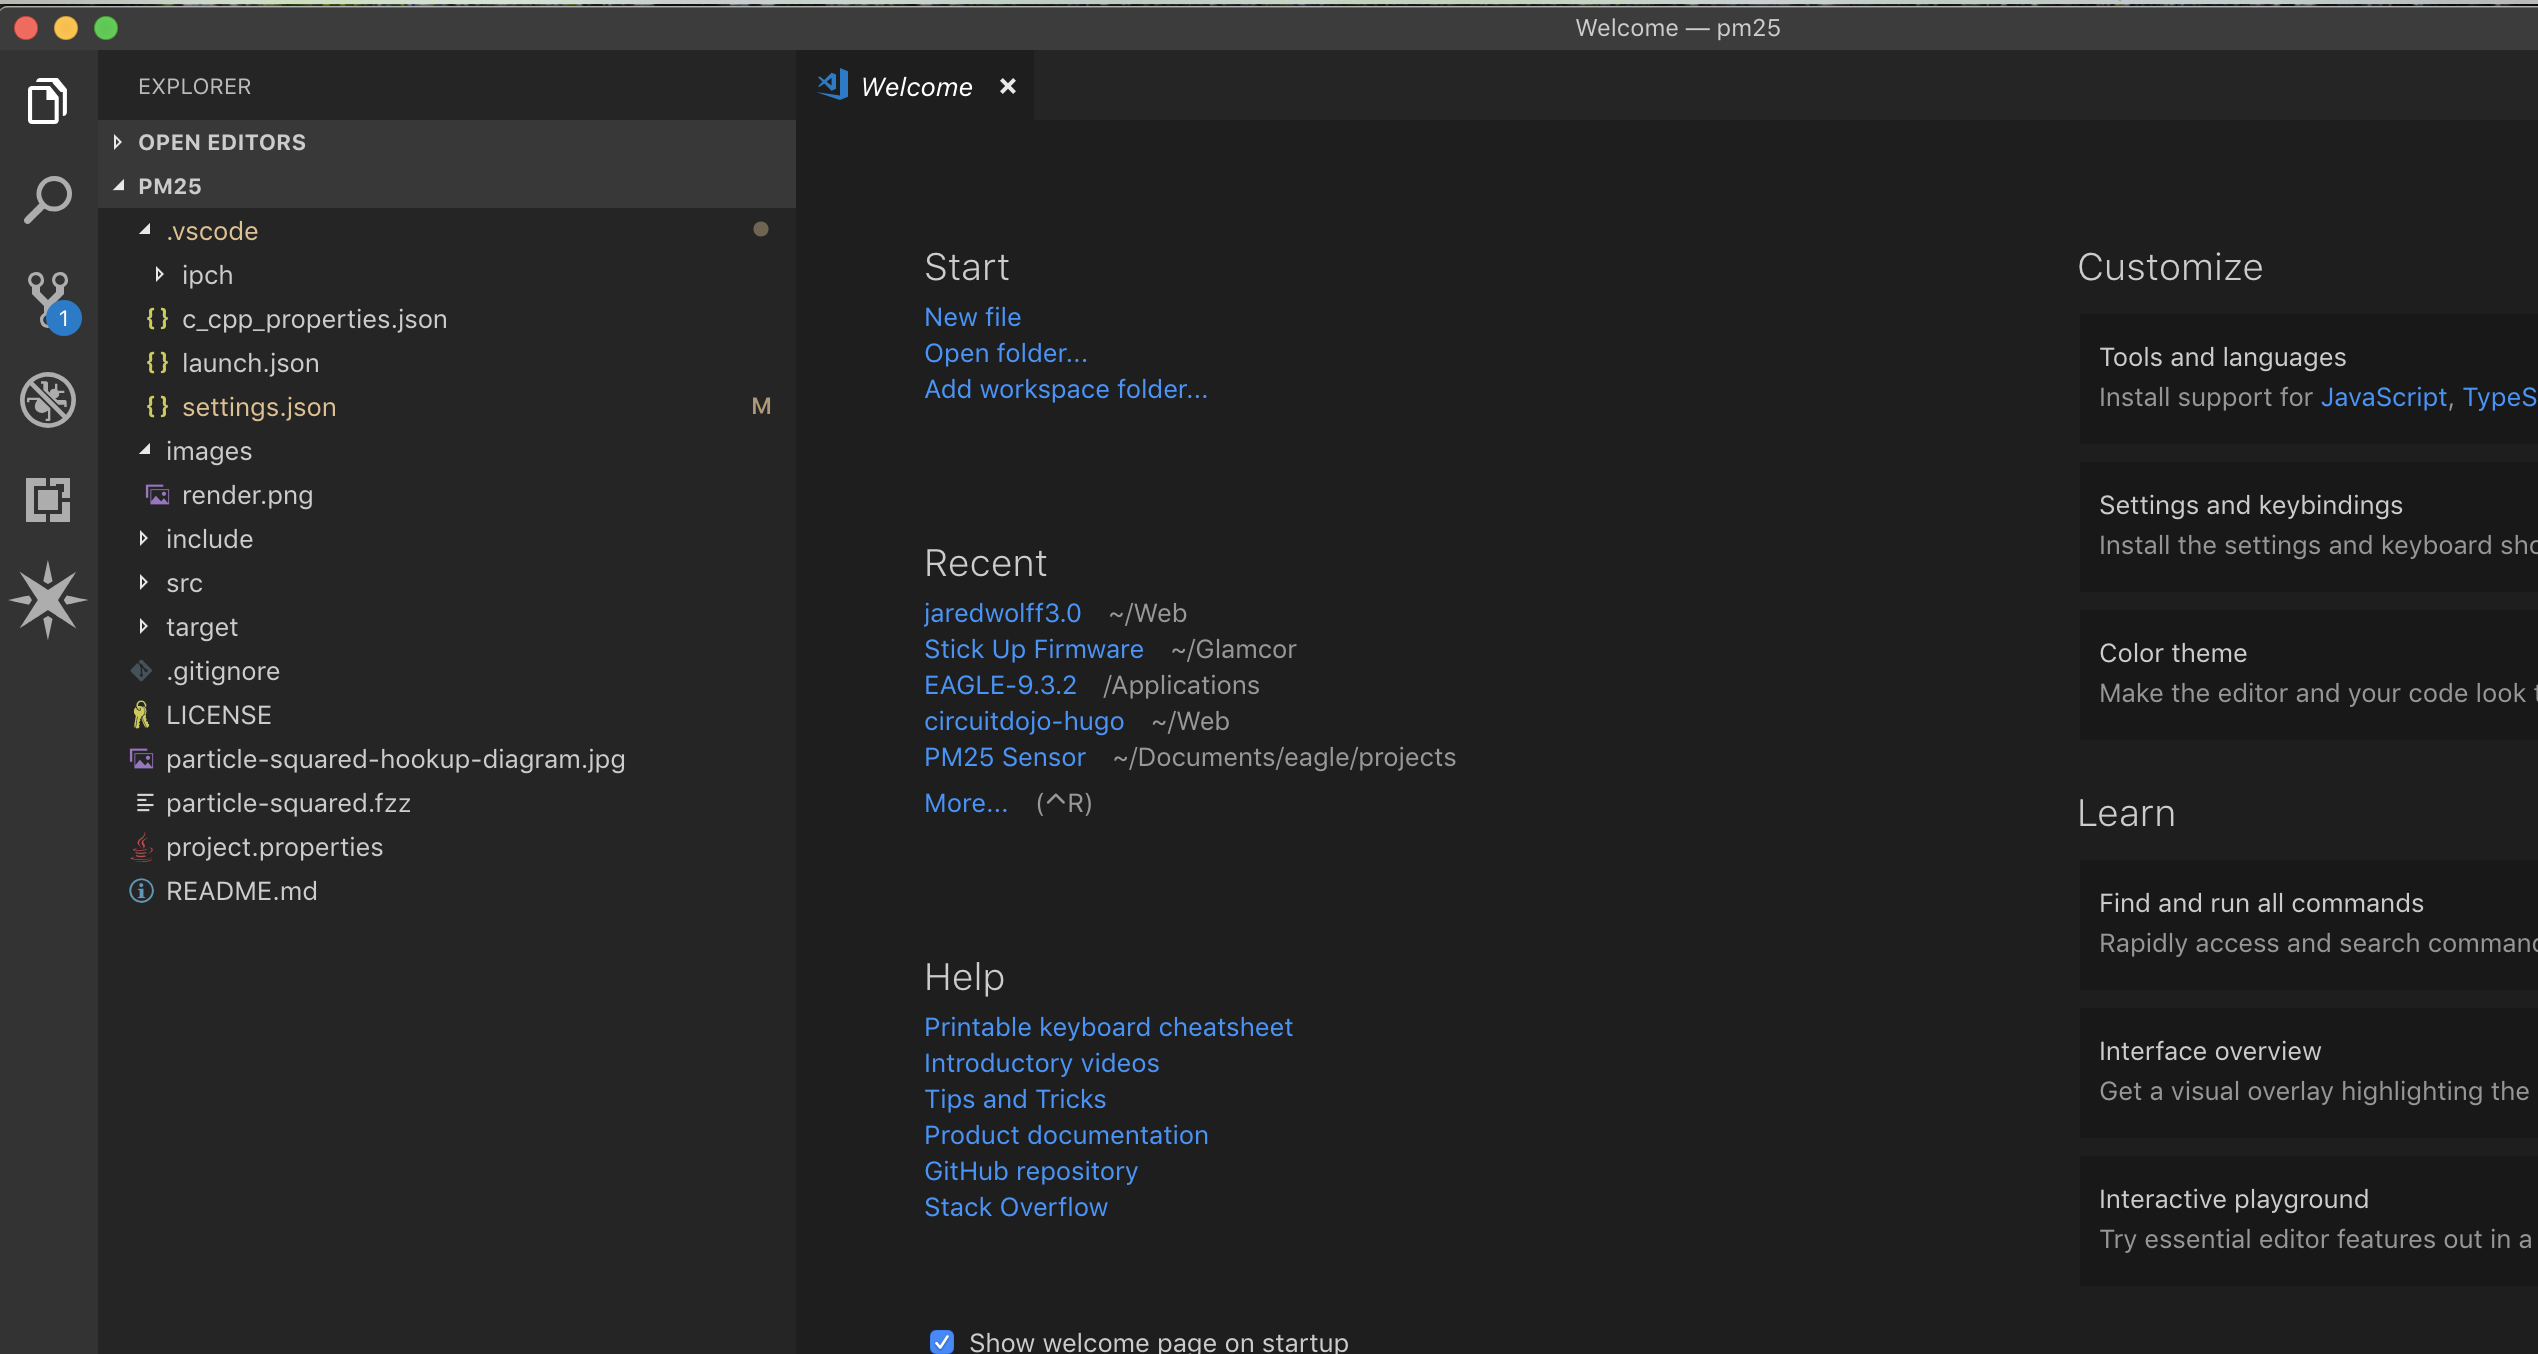
- Setup your Particle Account and Particle Mesh device. Use the Quickstart if you haven't done this before.
- Download Particle Workbench and install if you haven't already. Instructions here.
- Get the code here.
- Once the code is downloaded, open it with Visual Code (that you installed in Step 1)
- Login to Particle if you haven't already (The fastest way is to hit Command + Shift + P to open the command window. Then start typing login)
- Publish to Particle Cloud - Again this uses the command window. Use the same Command + Shift + P as above and type Cloud Flash.
- Once you've found the Cloud Flash option, press enter.
- Your board should be programmed shortly. You can watch the LEDs for changes during this time. Once it's glowing blue, you're good to go!
Graph Everything
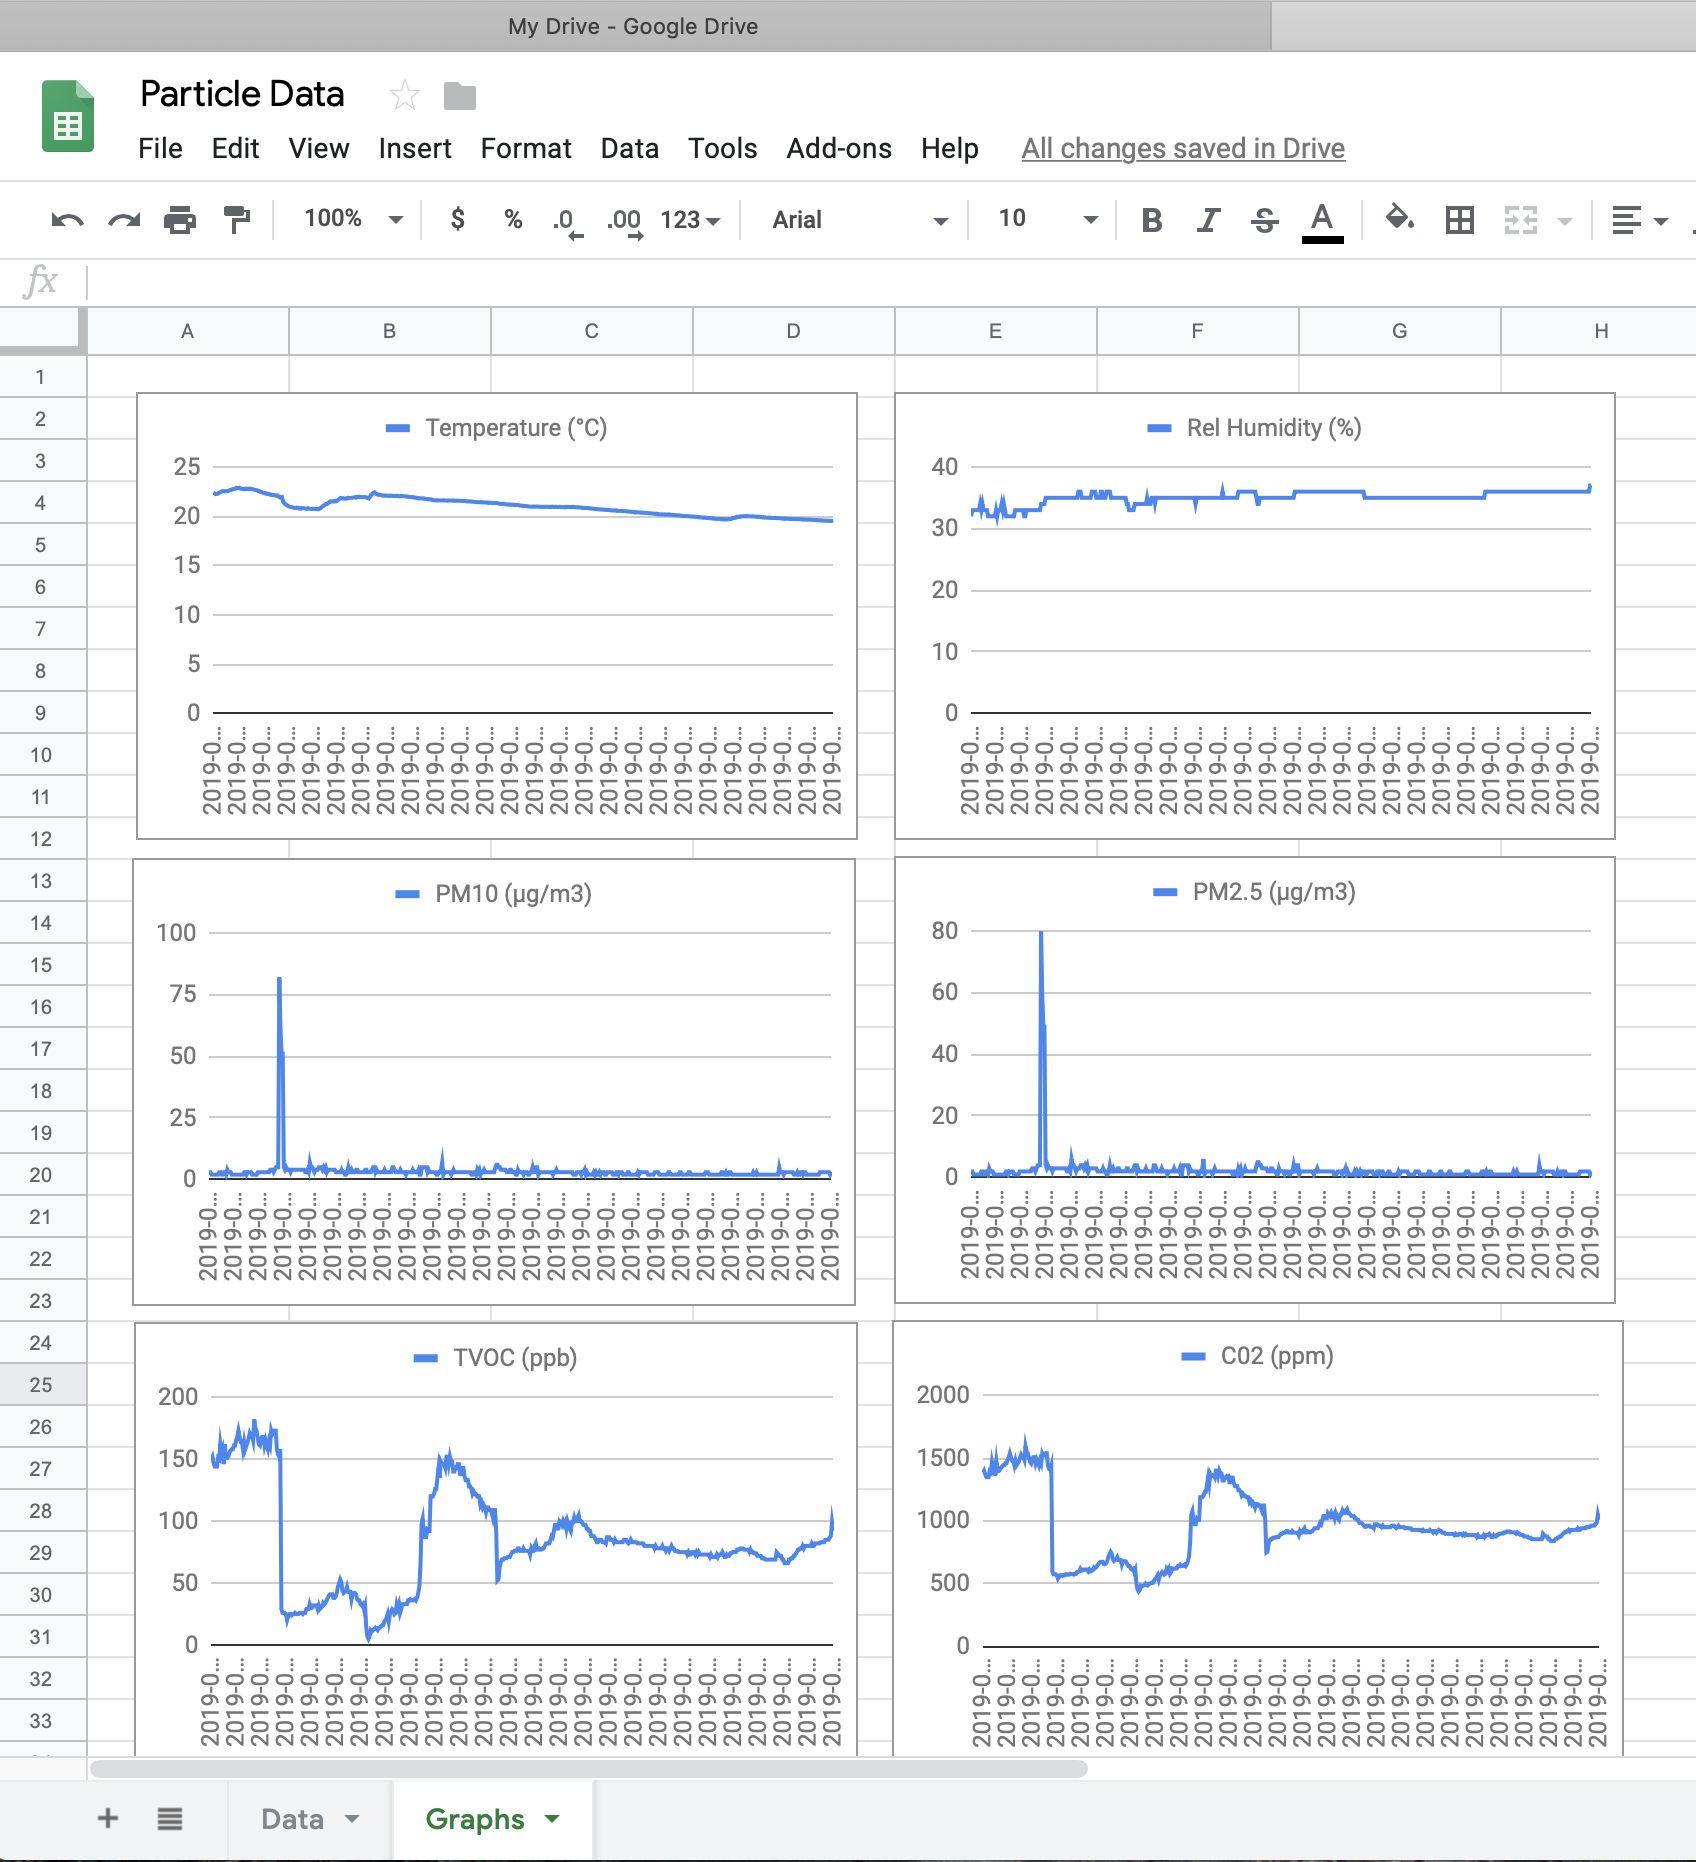
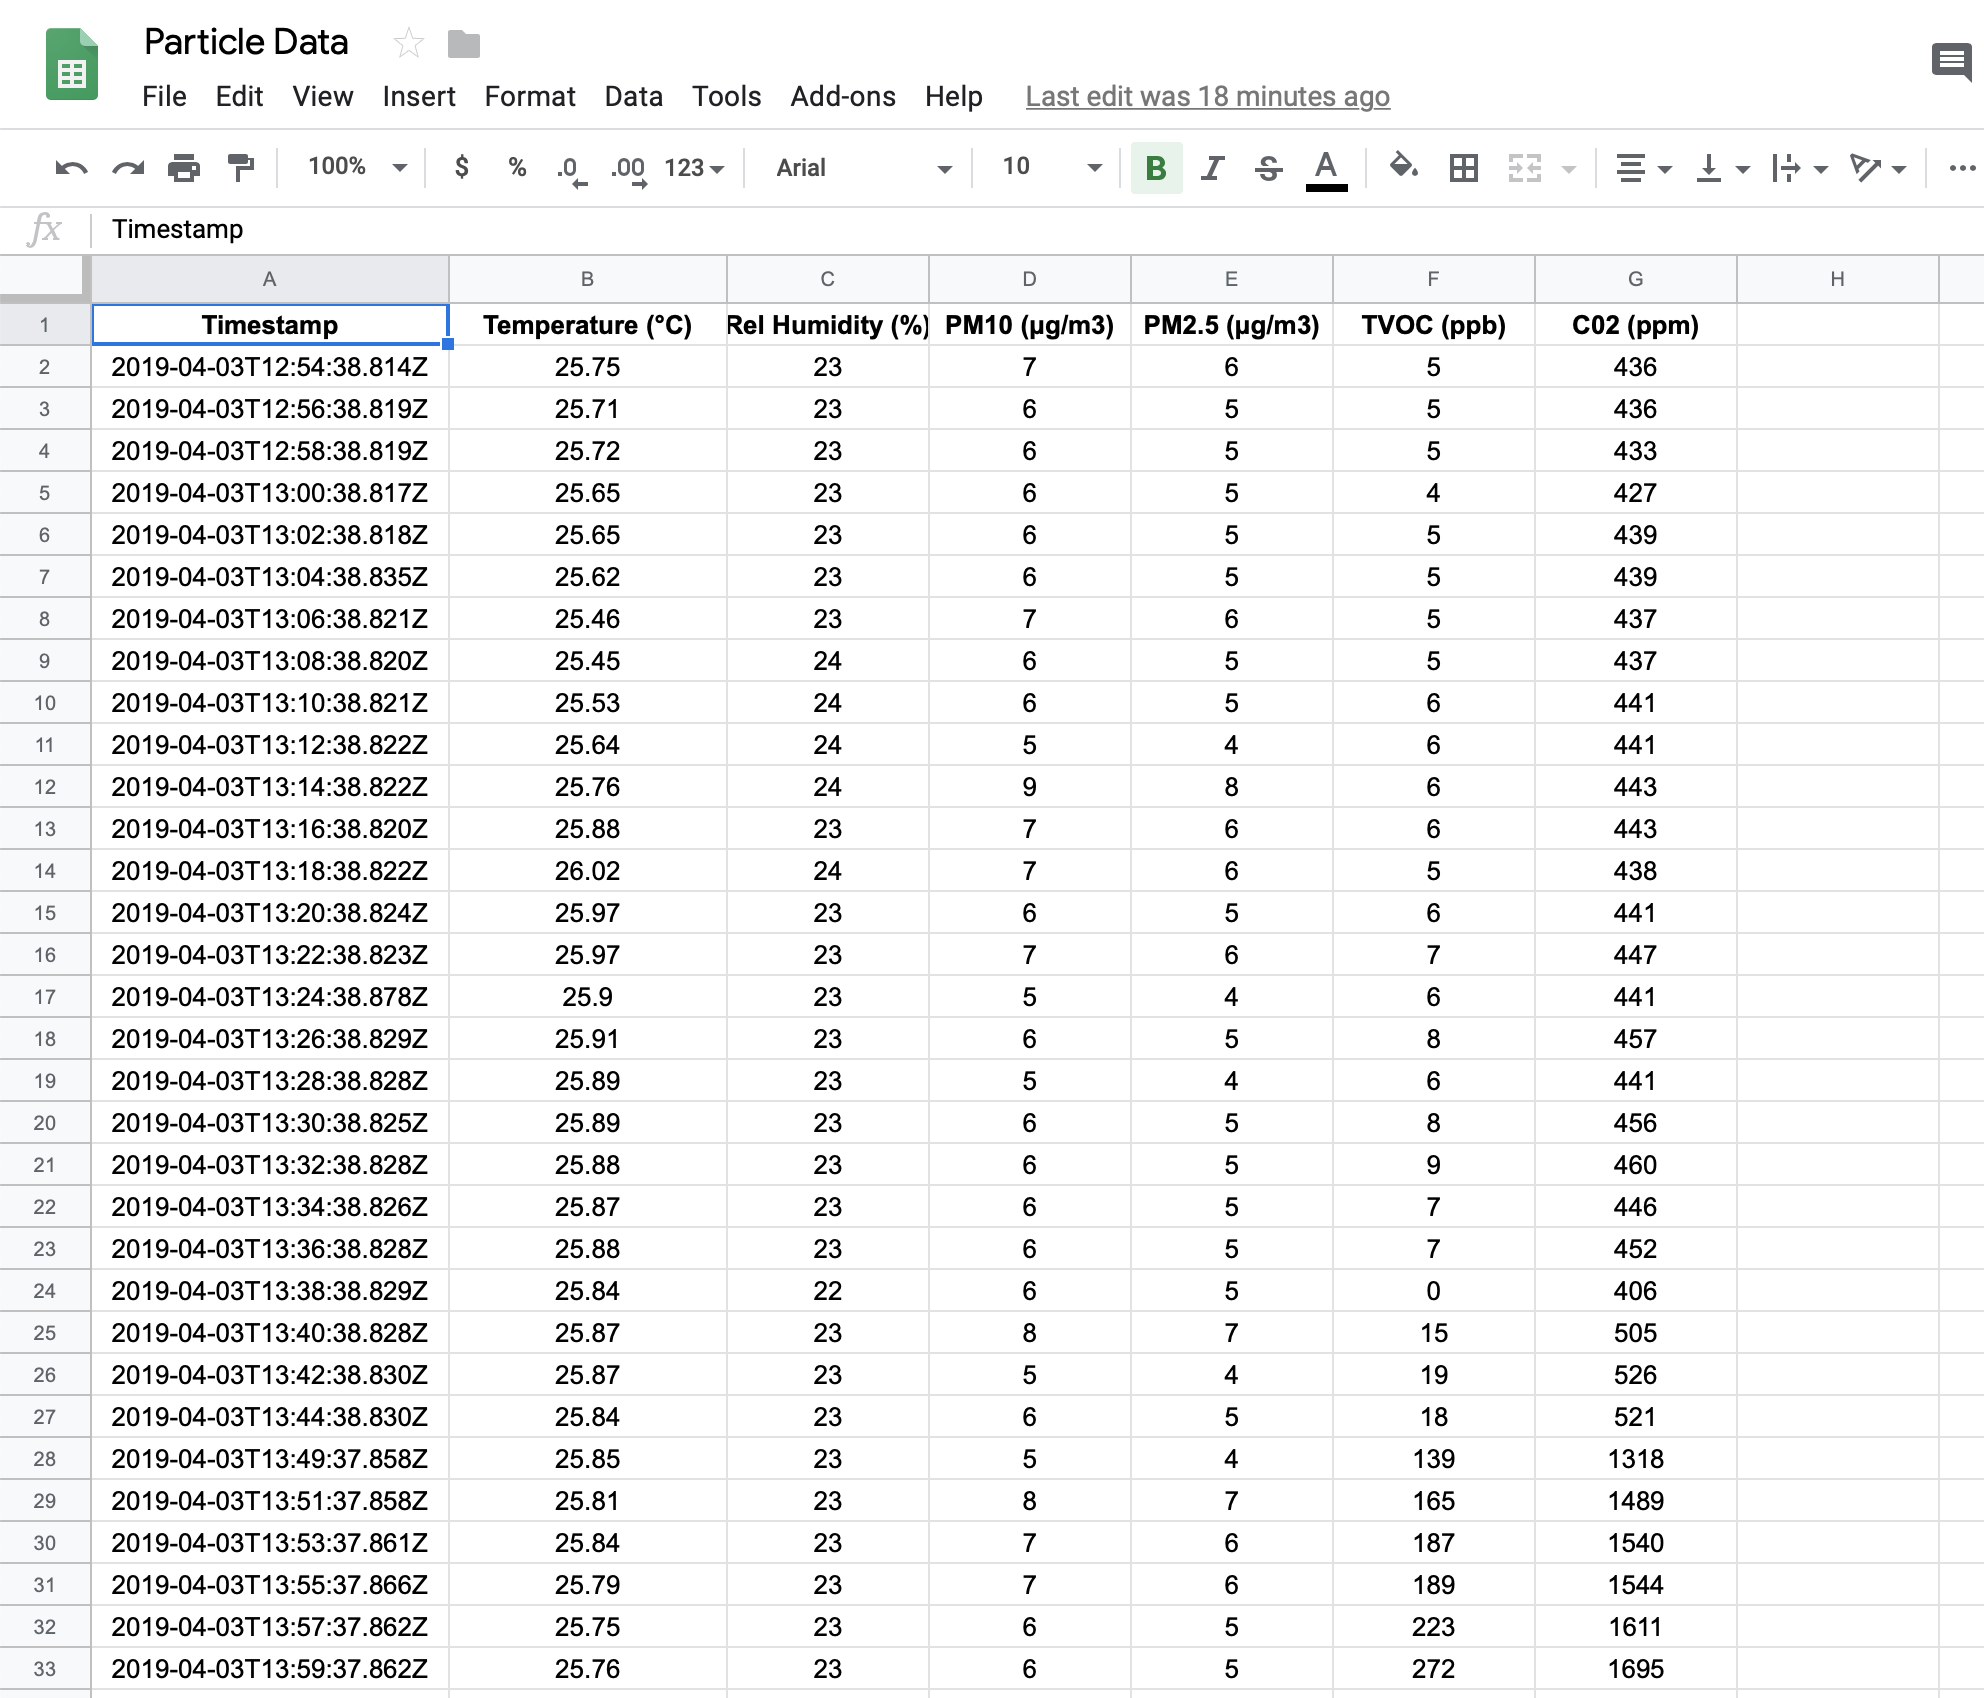
- In the Google sheet you can create a header in the first row with all the labels. (See the screenshot above)
- You should notice by now that new data is showing up in the sheet (if you set everything up correctly). Go back to the previous steps if you don't see it.
- You can graph the data by selecting a full column and creating a new chart from it.
- You can graph everything in one or in separate like I've done above.
If everything is working and you have some pretty graphs, congrats!! If you're ready to move on to the next step using an IoT service like Adafruit's check out my full guide here.