Measure Water Pollution and Plot Data Online
by Digijeunes in Circuits > Arduino
369 Views, 1 Favorites, 0 Comments
Measure Water Pollution and Plot Data Online


In this tutorial you will learn how to use a DIY water probe.
You will find information about what the water probe is for, how it works, what experiments you can run with the water probe in order to understand what water pollution is. Finally, you ll learn how to plot the data recorded by the water probe on a shared online map, so that your work will be visible to anyone.
For a full tutorial on assembling your own water probe based on arduino uno, click here
Plotting Data on a Shared Online Map

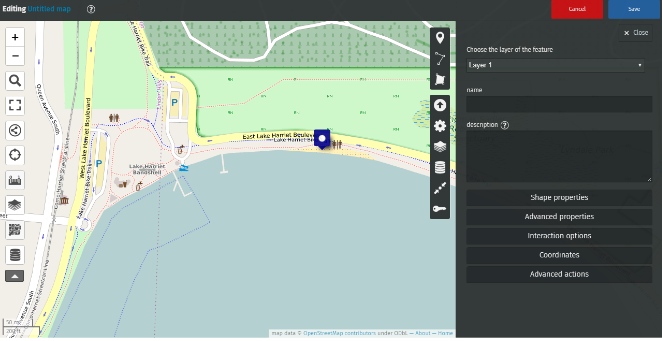

You will be sharing the data recorded by your water probe on UMap, which allows users to create their own maps embedding the data of their choice.
First, head to https://umap.openstreetmap.fr/fr/
You ll need to create an account to be able to edit your own maps.
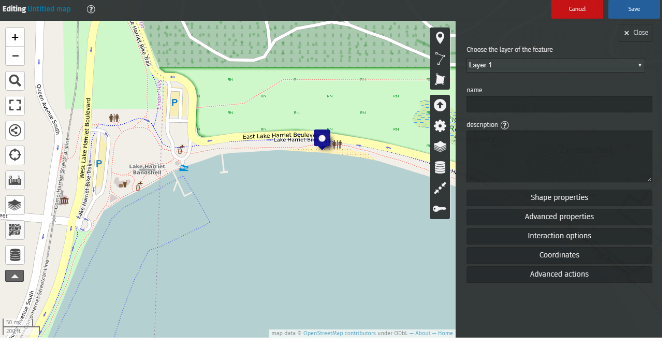
Once you ve successfully logged in, hit the “Create a map” button.
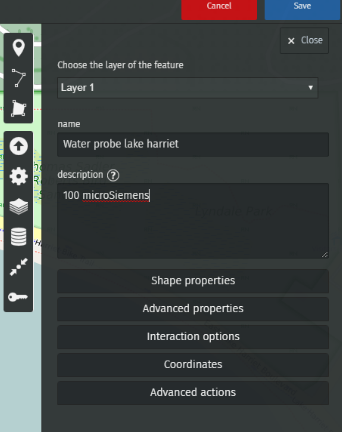
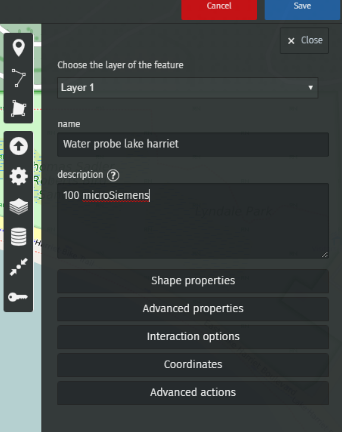
You can now draw markers and enter the description you wish to publish.
For example, let’s enter the value recorded by our water probe at Lake Harriet, in Minneapolis.
We’ve recorded 100 microsiemens, which by the way means that it is safe to bathe in Lake Harriet!
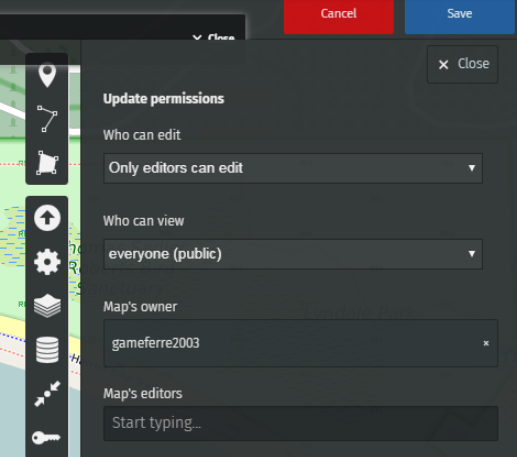
To share this map with anyone, you just need to provide them with the appropriate link.
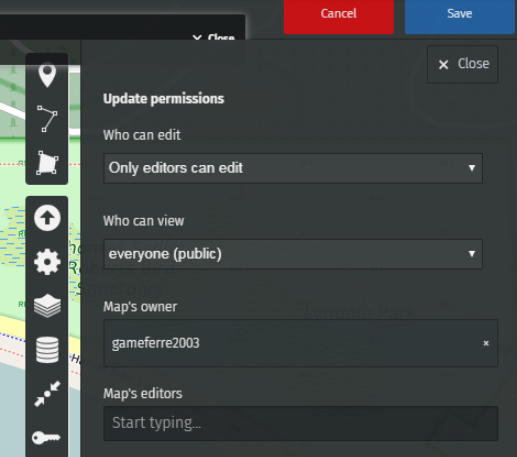
Go to Update permissions and editors.
You can choose who can view and who can edit this map.
To enable editors to edit the map, copy the link of your map (the web address of your map) and share it with whoever you want.