Play With Math: Make Animated GIF and HTML5
by Laxap in Workshop > Science
25859 Views, 207 Favorites, 0 Comments
Play With Math: Make Animated GIF and HTML5
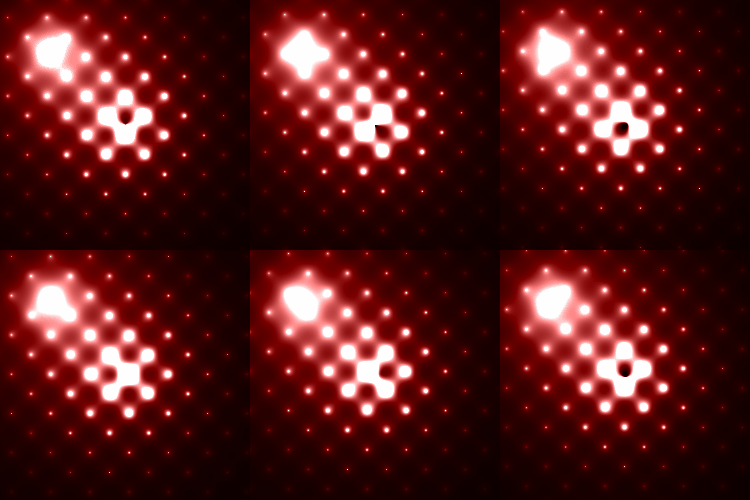
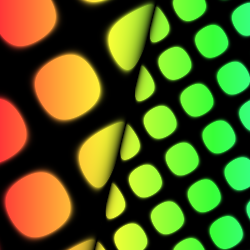
UPDATE: This was posted in 2014 and is kept as a curiosity. Meanwhile there is a new version using C, WASM and FFmpeg.
Many social web sites now allow to post animated pictures (GIF). Instructable does. Facebook does not (as of now).
In this Instructable, you will learn how to:
- generate images with math (contour plot type),
- define colors,
- generate an animation,
- let images interact with the user.
- You will also learn elements of the Processing programming language.
This Instructable is to be viewed from a web browser, as the apps do not handle the animated GIFs.
I hope you will enjoy the examples, get an idea of the endless possibilities, and of course, try it, and share your results!
Get and Start the Software
Visit this link.
Firefox and Chrome work best.
Safari does not work well for saving files.
Internet Explorer needs more testings...
Find some bug? just PM me!
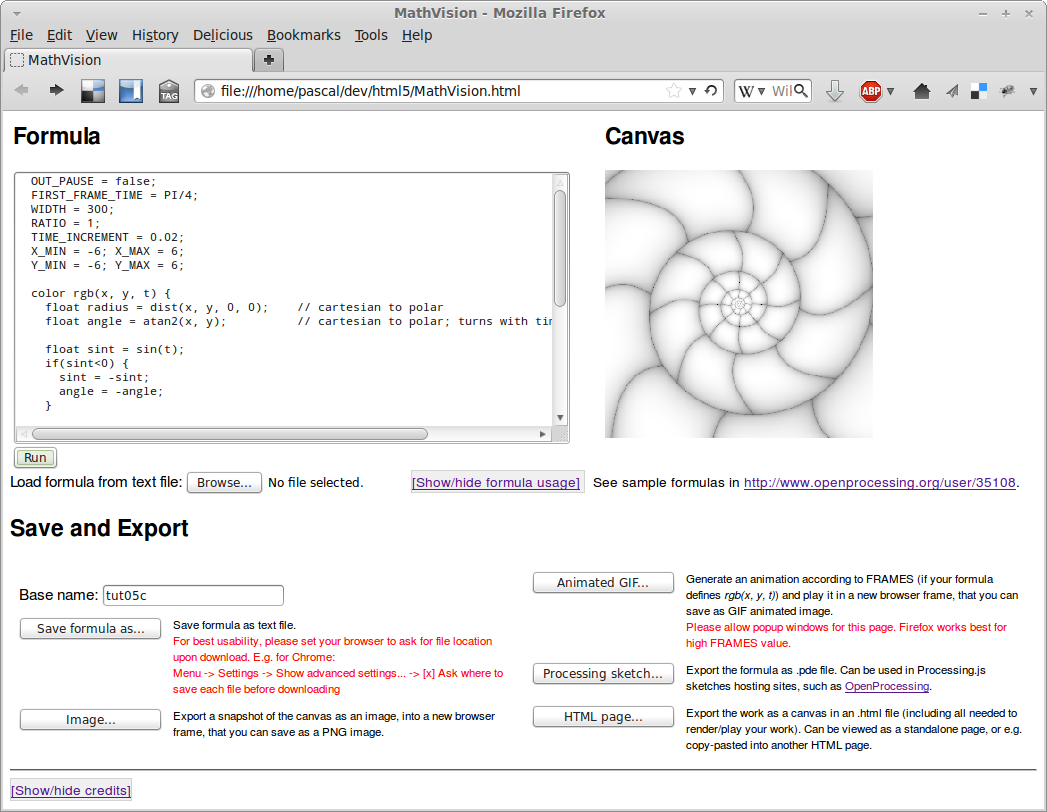
You should then see the page as represented in the picture of this step.
- Formula area: where to write your formula, or paste formulas copied from the next steps.
- Canvas area: where your image or animation will appear.
- Save and Export section: offers various ways of saving your work, and will be covered in one of the last steps.
Formula Basics
For the impatient ones
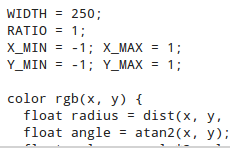
Get your MathVision.html page up and running as described before. Skip the rest of this step and copy-paste the formula code blocks of the next steps into the Formula box, to try them.
Creating Formulas
MathVision.html is based on Processing.js, which is a particular implementation of Processing, to run in a web browser. The syntax is hence a simplified flavor of the Java programming language.
You will need to learn three things:
- Assigning values, like WIDTH = 300;
- Using functions, like color(...), dist(...), cos(...)
- Defining the rgb(...) function
A typical formula consists of two parts:
Part 1: Defining the parameters
WIDTH = 300;These parameters determine the image size in pixels, its size proportion, and the x and y ranges. Click [Show/hide formula usage] to get a list of possible parameters.
RATIO = 1;
X_MIN = -16; X_MAX = 16;
Y_MIN = -16; Y_MAX = 16;
Part 2: Defining the rgb() function
color rgb(x, y) {
  return color(x*x+y*y);
}
Simply put, the rgb() function defines the color for a pixel at a given (x, y) coordinate.Comments
Comments are prefixed by a double slash //. In the next steps, I insert comments in the formula to mark locations deserving explanations. Comments are just ignored when the formula is executed.
// this is a commentVariables
int a = 234;Variables are storages to receive temporary work values. Usual types are integers (int) and floating-point numbers (float).
float b = cos(PI/3);
In the above example, we have created a variable named a, of integer type, initialized with 234. Then we have created a variable named b,of floating point type, and initialized with the cosine of π/3.
Calling functions
You will likely use math functions, see http://processingjs.org/reference/ and look for the Math group.
Running your formula
Once you have either pasted a formula into the entry box, or created and typed your own one, click the Run button below the entry area.
It is easy to make syntax errors. In such a case, after clicking Run, MathVision will alert you by a message box. Unfortunately, the alert message may not be very obvious to locate the issue.
Save your work periodically
Define a base name for your exports and saves. Save your work by clicking Save Formula as...
Basics - Stripes
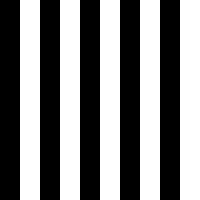
First let's start with a simple example: vertical stripes. For this, we will only consider the x coordinate.
Run MathVision.html in another tab of your browser, and copy-paste the sample formulas that you will find below.
Formula
WIDTH = 200;
RATIO = 1;
X_MIN = 0; X_MAX = 10;
Y_MIN = 0; Y_MAX = 10;

color rgb(x, y) {
  int value = (int)x % 2; // (a)
  int luma = value * 255; // (b)
  return color(luma);     // (c)
}
Explanation
(a) We take the integral part of x (the (int)x here), and determine whether it is odd or even (the % 2 means modulo 2). This yields a value that is either 0 or 1.
(b) We multiply the value by 255 to obtain a greyscale luma number (from 0 to 255). Because value is either 0 or 1, luma will be either 0 or 255 here.
(c) We return a greyscale color, by calling the color() function with only one parameter.
Exercises
- Make diagonal stripes. Hint: use also y.
Basics - Checkerboard
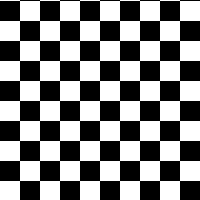
This is quite similar to the previous step, but this time, y is also considered.
Formula
WIDTH = 200;
RATIO = 1;
X_MIN = 0; X_MAX = 10;
Y_MIN = 0; Y_MAX = 10;

color rgb(x, y) {
  float value = (int)x % 2 == (int)y % 2; // (a)
  float luma = value * 255;               // (b)
  return color(luma);                     // (c)
}
Explanation
(a) In the previous step, we have seen how to determine whether x is even or odd. Now we do the same for x and y, and compare (the == operator) if they are equally odd or even. The result is either 0 or 1.
- Then, it is exactly like in the previous step: -
(b) We multiply the value by 255 to obtain a greyscale luma number (0 to 255). Because value is either 0 or 1, luma will be either 0 or 255 here.
(c) We return a greyscale color, by calling the color() function with only one parameter.
Exercises
- Make larger squares.
- Make black and red squares. Hint: use color(luma, 0, 0).
- Make red and white squares.
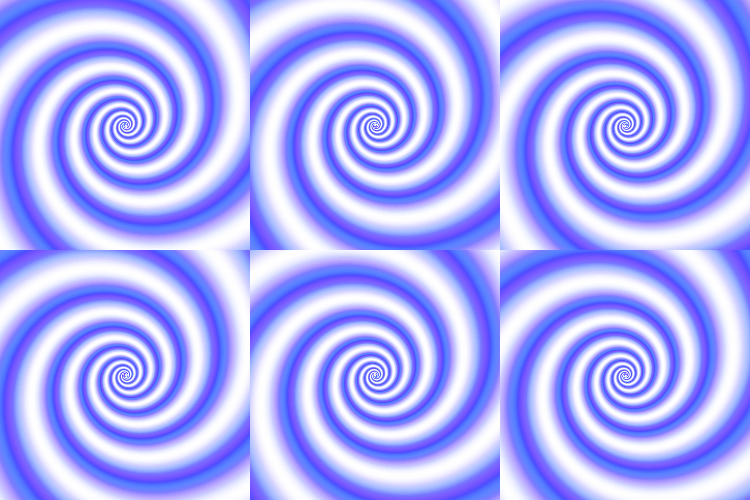
Basics - Spiral
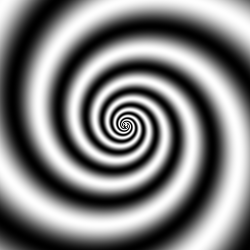
Now let's draws a spiral.
Formula
WIDTH = 250;
RATIO = 1;
X_MIN = -1; X_MAX = 1;
Y_MIN = -1; Y_MAX = 1;

color rgb(x, y) {
  float radius = dist(x, y, 0, 0);        // (a) Cartesian to polar
  float angle = atan2(x, y);              // (a) Cartesian to polar
  float value = angle*3 - log(radius)*12; // (b) the spiral
  float stripe = cos(value);              // (c) the smooth stripes
  float luma = (stripe + 1) * 127;        // (d) map to luma range
  return color(luma);
}
Explanation
(a) Convert Cartesian coordinates (x,y) to polar coordinates (angle,radius).
(b) Determine the color by using the angle and the logarithm of the radius.
(c) Apply a cosine in order to generate smooth greyscale stripes.
(d) Map stripe (-1 to 1) to luma range (0 to 255).
Note:
You can also generate black and white (instead of greyscaled) stripes by replacing the two lines (c) and (d) by this single one:
float luma = cos(value)>0 ? 0 : 255;
Then, notice how the stripes borders are jagged. Not so nice, so let's stick with greyscales!
Exercises
- Make the spiral turn in opposite direction.
Basics - Colors
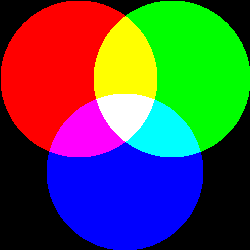
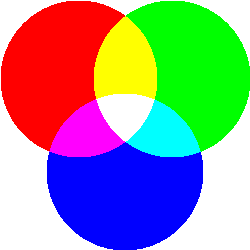
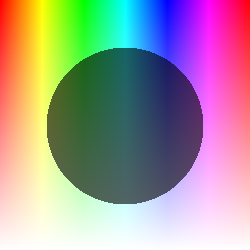
There are two very common ways of defining a color: the RGB and HSB models. The two are supported by MathVision, and their usage is described in this step.
RGB Model
With the so-called RGB model, a color is defined by its Red, Green and Blue components.
To use the RGB color model, you shall define your formula as rgb(x,y) or rgb(x,y,t).
In the previous steps, remember that your rgb function used color(luma) with one single argument, to produce black and white or gray scales. Now, for color output, you should call rgb with three arguments: color(red,green,blue). Each argument should range from 0 to 255.
- color(255,0,0) is primary red, color(0,255,0) is primary green, color(0,0,255) is primary blue;
- color(0,0,0) is black, color(255,255,255) is white;
- color(127,0,0) is dark red.
Formula 1 (RGB)
WIDTH = 250; RATIO = 1;The above formula generates the first image of this step.
X_MIN = 0; X_MAX = 255;
Y_MIN = 0; Y_MAX = 255;
color rgb(x, y) {
int radius = 80;
int d1 = dist(x, y, 80, 175);
int d2 = dist(x, y, 175, 175);
int d3 = dist(x, y, 127, 80);
int r = d1 < radius ? 255 : 0;
int g = d2 < radius ? 255 : 0;
int b = d3 < radius ? 255 : 0;
return color(r, g, b);
}
- For the red circle, we have full-red contribution (255) if we are inside a circle centered at x=80 and y=175, otherwise we have 0.
- Similar for green and blue, with different centers.
- If we are outside any circle, r, g and b are all zero; we get black, because color(0, 0, 0) is black.
Formula 2 (RGB)
WIDTH = 250; RATIO = 1;The above formula is similar to the previous one, with this change in the last line:
X_MIN = 0; X_MAX = 255;
Y_MIN = 0; Y_MAX = 255;
color rgb(x, y) {
int radius = 80;
int d1 = dist(x, y, 80, 175);
int d2 = dist(x, y, 175, 175);
int d3 = dist(x, y, 127, 80);
int r = d1 < radius ? 255 : 0;
int g = d2 < radius ? 255 : 0;
int b = d3 < radius ? 255 : 0;
return r+g+b ? color(r, g, b) : color(255);
}
- If all components are zero (i.e. r+g+b is zero) then we are outside any circle, and we return color(255) which is white (and which is the same as color(255,255,255) );
- otherwise. return color(r,g,b) as before.
HSB Model
For the HSB model, instead of using red, green and blue components, a color is defined by three other kind of arguments:
- H, the hue -- the pure color in the range of possible colors: 0=red, 150=blue;
- S, the saturation -- how the color is vivid or faded: 50=pastel, 255=vivid;
- B, the brightness: 50=dark, 255=lightest.
Formula 3 (HSB)
WIDTH = 250; RATIO = 1;In the above formula, which yields the third picture of this step, we do the following:
X_MIN = 0; X_MAX = 255;
Y_MIN = 0; Y_MAX = 255;
color hsb(x, y) {
int radius = 80;
int b = dist(x, y, 127, 127) < 80 ? 64 : 255;
return color(x, y, b);
}
- Vary the hue with x (horizontally), and the saturation with y (vertically). The top of the picture is vivid, whereas the bottom is so faded that it becomes white.
- In addition, we darken a disc centered at the middle of the image at (127,127); if we are outside the disk, we set b to 255 (full brightness), otherwise to 64 (quite dark).
Basics - Animated Spiral
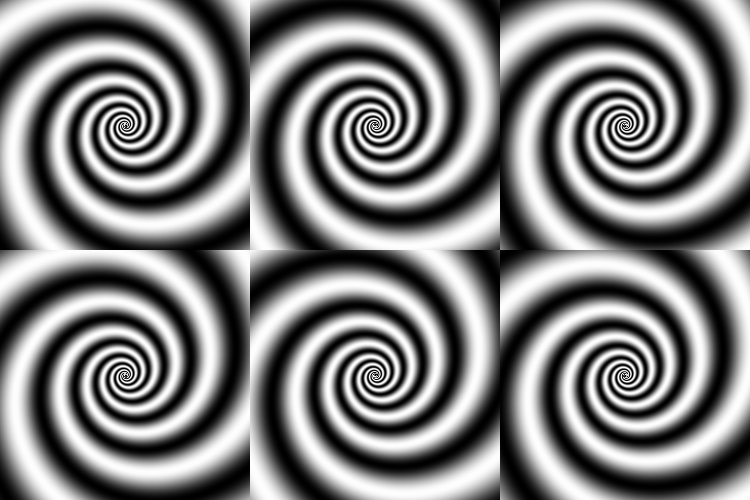
(link to HTML5 animated version)
So far so good, but weren't animated GIF images promised in the intro?
For animation, there are three new ingredients:
- t: the time value. You just have to add t to the arguments of rgb() or hsb(). Then of course, t shall be used smartly in the formula.
- TIME_INCREMENT: the time leap between each frame.
- FRAMES: the number of frames for the animated GIF. If you don't want to export as animated GIF, you may leave that out.
Formula
TIME_INCREMENT = 0.2; // (a)The non-animated spiral was explained in the previous tutorial. We will here only cover the modifications necessary to generate an animation.
FRAMES = 10; // (b)
FRAMES = TWO_PI / TIME_INCREMENT / 3; // (b2)
OUT_PAUSE = false;
WIDTH = 250;
RATIO = 1;
X_MIN = -1; X_MAX = 1;
Y_MIN = -1; Y_MAX = 1;
color rgb(x, y, t) { // (c)
float radius = dist(x, y, 0, 0);
float angle = -atan2(x, y);
angle = angle + t; // (d)
float value = angle*3 - log(radius)*12;
float stripe = cos(value);
float luma = (stripe + 1) * 127;
return color(luma);
}
- (a) TIME_INCREMENT defines the time increment, i.e. how the time varies from one frame to the next one.
- (b) FRAMES defines the number of frames that we want to pack into the animation file (anim GIF). The number really depends on your formula. It shall be chosen so that the transition between the last frame and the first frame is smooth. Here in (b2), we compute it to take the TIME_INCREMENT into account (the smaller the increment, the more the number of frames).
- (c) The rgb() function is declared here with the t argument. This states that we want an animation. The rgb() function will be called with various values of t, starting from 0, and incremented with TIME_INCREMENT at each new frame.
- (d) In this formula, this is how we decided to use t. Here, t is added to the angle, making the whole spiral spin with the time.
Exercises
- Make the spiral spin in the opposite direction.
- Make the spiral spin faster or slowlyer.
Basics - User Interaction

Now, the following formula will render a spot following the mouse, and colored after the x position. This is a simple form of user interaction.
Note: To experience the interactivity, follow http://www.openprocessing.org/sketch/138963
Formula
WIDTH = 250;
RATIO = 1;
X_MIN = -20; X_MAX = 20;
Y_MIN = -20; Y_MAX = 20;
MOUSE_MOVE = true;             // (a)

color hsb(x, y) {
  float d = dist(u, v, mouseX, mouseY) / WIDTH * 10;  // (b)
  float shift = mouseX / WIDTH;                       // (c)

  float bright = (1/d) * 255;      // (d)
  float hue = shift * 255;         // (e)

  return color(hue, 255, bright);  // (f)
}
Explanation
- (a) Setting MOUSE_MOVE to true will insure to redraw upon any mouse move.
- (b) We calculate the distance of the current pixel to the mouse. Instead of x and y, u and v are used, as they represent the pixel coordinate. WIDTH is used to normalize and be independent of the actual canvas size. The value 10 controls the size of the spot.
- (c) The color shift is proportional to the mouse horizontal position mouseX. WIDTH is used so that shift ranges from 0 to 1.
- (d) The brightness will be maximal under the mouse, and will tend to zero for pixels away from the mouse.
- (e) For the hue, we scale the color shift, to range between 0 and 255.
- (f) We create the pixel color by using the computed hue, brightness, and a maximal saturation (255, for strong colors).
Notes:
- To draw simple flat shapes following the mouse, MathVision is far less efficient than the usual graphics primitives of Processing.js. This is because MathVision recomputes each pixel (applying the formula to each one) for every redraw of the canvas.
- On the other hand, effects, such as the halo you can see here, are very easily obtained.
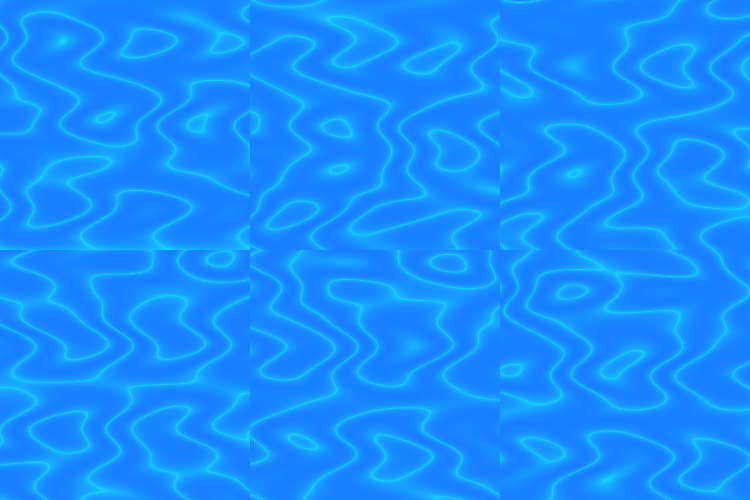
Advanced - Animated Water

(link to HTML5 animated version)
From now on, I will offer you some more complex formulas, with not much detailed explanations -- artistic results often come with lots of tweakings. You can study them and spot some comments within.
This one produces wave effects on the water.
Formula
WIDTH = 200;
float RATIO = 1;
TIME_INCREMENT = .08;
OUT_PAUSE = false;

X_MIN = 0; X_MAX = 30;
Y_MIN = 0; Y_MAX = 30;

float wave(x, y, fx, fy, a, vx, vy) {
  return sin((x+2*sin(y*fx*3))*fx + t*vx) * sin(y*fy + t*vy) * a;
}

float dx, dy;
bool preDraw(t) {
  dx = pow(sin(t/20), 2)/3;
  dy = pow(cos(t/20), 2)/3;
  return true;
}

color rgb(x, y, t) {
  float value = 0;

  //                  fx    fy    a     vx    vy
  value += wave(x, y, 0.20, 0.10, 0.4,  dx ,  dy );
  value += wave(x, y, 0.31, 0.31, 0.4,  0.2,  0.2);
  value += wave(x, y, 0.09, 0.07, 0.4,  0.2,  0.2);

  value = sin(value*7);
  value = pow(value*value, .1);
  float normed = value*255;
  return color(24, 255-normed/2, 255);
}
Notes
- Did you notice the preDraw() function? It is called, if defined, before each frame. It allows to compute variables that do change over frames, and not over pixels. And hence, to do the computation once per frame instead of redoing it uselessly for each pixel.
- The function wave() is an arbitrarily named function, that we call several times per pixel, with different arguments.
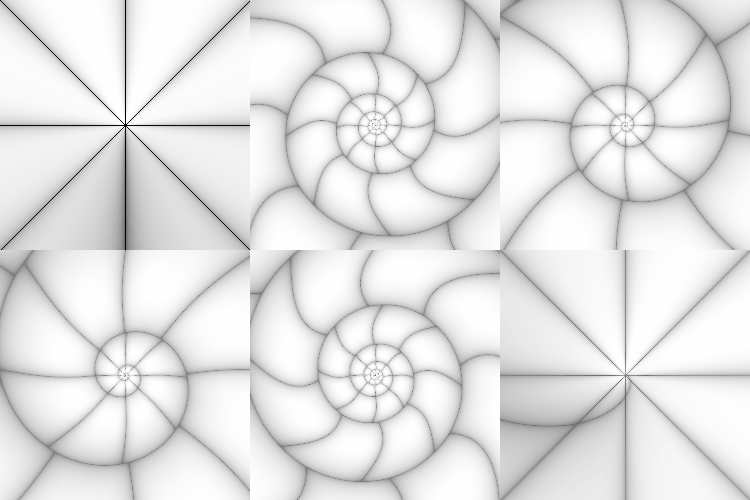
Advanced: - Animated Nautilus

(link to HTML5 animated version)
This is one of my favorites. Making the spiral was easy (as seen in previous steps), but making the chambers divisions was a real challenge.
Formula
OUT_PAUSE = false;
FIRST_FRAME_TIME = PI/4;
WIDTH = 250;
RATIO = 1;
TIME_INCREMENT = 0.02;
X_MIN = -6; X_MAX = 6;
Y_MIN = -6; Y_MAX = 6;
FRAMES = PI / TIME_INCREMENT;

color rgb(x, y, t) {
  float radius = dist(x, y, 0, 0);    // cartesian to polar
  float angle = atan2(x, y);          // cartesian to polar

  float sint = sin(t);
  if(sint<0) {
    // for negative pitch, have sint positive and negate angle
    sint = -sint;
    angle = -angle;
  }

  float lrad = log(radius) * 4 * sint;

  float spiral = cos(angle/2 + lrad);
  float divisions =
    spiral > 0
    ?  sin(sin(angle*4 + sint * lrad * sin(angle/2+lrad - PI/4)/8)*PI/2)
    : -sin(sin(angle*4 - sint * lrad * sin(angle/2+lrad - PI/4)/8)*PI/2 + PI);

  float value = spiral * divisions;
  value = pow(value*value, .05); // make lines thinner

  float luma = value * 255;
  return color(luma);
}
Advanced - Animated Fabric Rolls

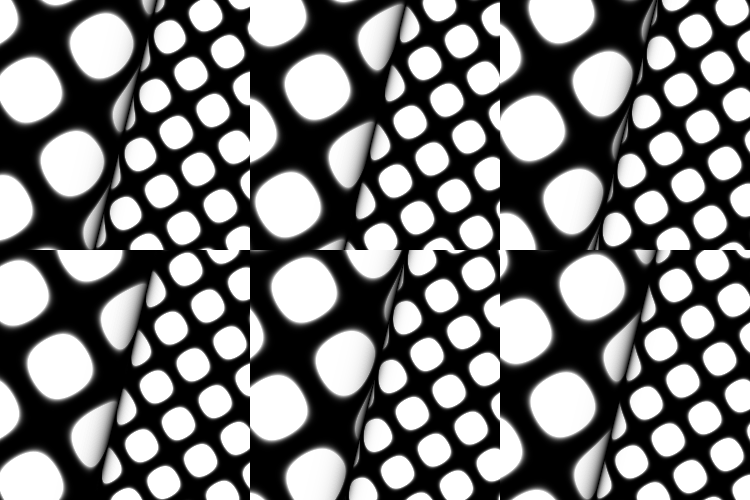
Another crazy one... It is the distort variable which is giving the depth effect.
For best animation colors, please visit http://www.openprocessing.org/sketch/126463
Formula
FRAMES = 40;
WIDTH = 250;
X_MIN = -TWO_PI; X_MAX = TWO_PI;
Y_MIN = -TWO_PI; Y_MAX = TWO_PI;
RATIO = AUTO;
TIME_INCREMENT = PI/2;
OUT_PAUSE = false;

void preSetup() {
    colorMode(HSB, 255);
}

color rgb(x, y, t) {
  float xx, yy;
  xx = x - y/4;
  yy = y + x/4;

  if(xx==0)
    return color(0);

  if(xx<0) {
    xx = -xx;
    yy = yy;
  }
  else {
    xx = xx*2;
    yy = yy*2;
  }
  float distort = 1 - 1/exp(xx*3);
  float tt = xx<0 ? t : t*2;
  xx = cos(xx + distort + tt/10);
  yy = sin(yy + distort + tt/20);

  float value = pow(xx+yy, 6)*2;
  value = value > 1 ? 1 : value;
  float luma = value * 255 * distort;
  return color(u/width*100, 200, luma);
}
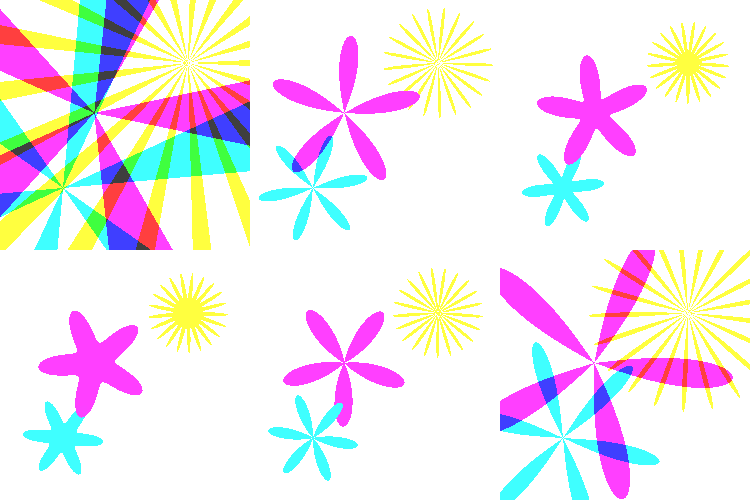
Advanced - Animated Flowers

(link to HTML5 animated version)
For best results when aiming at exporting an animated GIF, you should generate as few different hues (colors) as possible, otherwise the GIF encoder will have troubles building a good color palette.
In this example, the statement (int)(value/127) * 127 is here to limit the color resolution.
Formula
FRAMES = 20;
WIDTH = 150;
RATIO = 1;
X_MIN = -2; X_MAX = 2;
Y_MIN = -2; Y_MAX = 2;
TIME_INCREMENT = PI/10;
OUT_PAUSE = false;

float flower(x, y, t, n, k1, k2) {
  float radius = dist(x, y, 0, 0)/k1;   // cartesian to polar
  float angle = atan2(x, y) + t*k2;      // cartesian to polar; turns with time

  float value = sin(angle*n)-radius + pow(radius, exponent);
  value = min(255, max(0, (1+value) * 127));
  return (int)(value/127) * 127;
}

float exponent;
bool preDraw(t) {
  exponent = cos(t);
  return true;
}

color rgb(x,y,t) {
  float r = flower(x+1, y+1, t, 6, 0.5, -1);
  float g = flower(x+0.5, y-0.20, t, 5, 0.7, .2);
  float b = flower(x-1, y-1, t, 21, 0.5, .5);
  return color(255-r, 255-g, 255-b);
}
Crazy - Alien Sky and Road
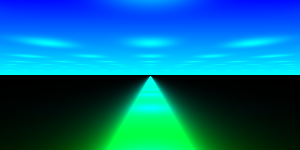
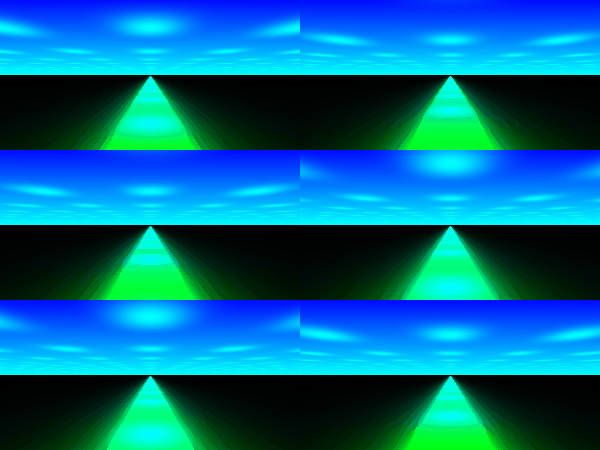
This formula generates a perspective dotted sky and road.
Note: To experience the interactivity, and get the best colors, definitely follow http://www.openprocessing.org/sketch/138961. Moving the mouse up and down changes the color; moving horizontally changes the perspective angle.
Formula
WIDTH = 300;
X_MIN = -1; X_MAX = 1;
Y_MIN = 0.5; Y_MAX = -0.5;
RATIO = 2;
TIME_INCREMENT = 0.5;
OUT_PAUSE = false;
FRAMES = TWO_PI / TIME_INCREMENT;

color hsb(x, y, t) {
  if(y==0)
    return color(0); // avoid zero-divide

  ay = abs(y);
  float direction = ((mouseX - WIDTH/2) / WIDTH) * TWO_PI;
  float val = cos(1/ay+t) * cos(x/ay - direction); // perspective spots raster
  val = 1 - pow(val,4);                            // increase contrast
  val *= y/Y_SPAN*2;                               // fade horizon to avoid moiree
  float band =  sq(1/(x/ay - direction));          // V mask for central band
  float color_shift = mouseY/height;               // H offset

  // pack all into HSV
  float h = 1+sin(val/2) + color_shift;
  float s = 3;
  float v = y<0 ? 3:band;
  return color(h*85, s*85, v*85);
}
Fractals
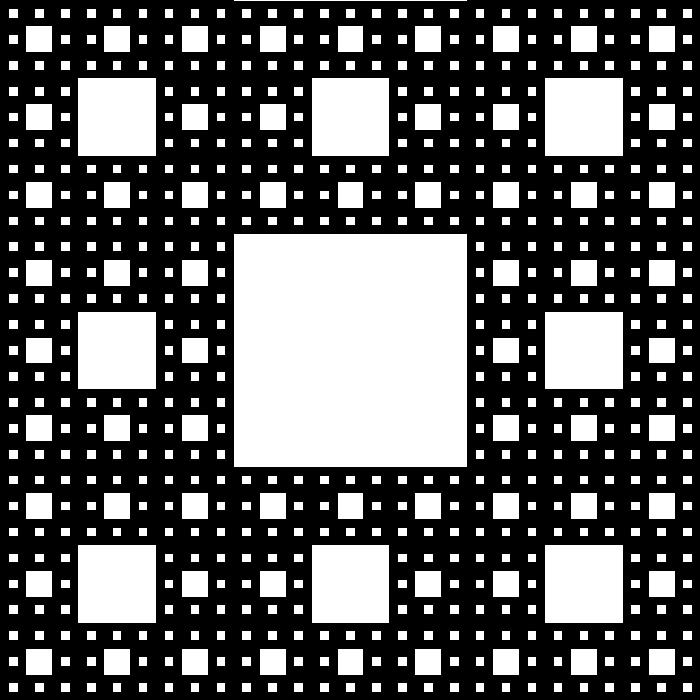
This is an interactive fractal: Moving the mouse horizontally over the image will change the fractal depth.
To experience the interactivity, follow http://www.openprocessing.org/sketch/138956
Formula
WIDTH = 700;
X_MIN = 0; X_MAX = 1;
Y_MIN = 0; Y_MAX = 1;
RATIO = AUTO;
MOUSE_MOVE = true;

// recursion
// ---------
int sierpinski(u, v, w, h, depth, maxdepth) {
  int val = ((int)(u/w * 3) % 2) * ((int)(v/h * 3) % 2);

  if(val==0 && depth<maxdepth) {
    return sierpinski((u*3 % w)/3, (v*3 % h)/3, w/3, h/3, depth+1, maxdepth);
  }
  else
    return val;
}

// start the computation and convert 0/1 to color
// ----------------------------------------------
color rgb(x, y) {
  return color(sierpinski(x,y,X_SPAN,Y_SPAN, 1, maxdepth) * 255);
}

// redraw only on effective maxdepth change
// ----------------------------------------
int maxdepth = -1;
bool preDraw(t) {
  int d = (int)(mouseX/width*6) +1;
  bool doit = maxdepth!=d;
  maxdepth = d;
  return doit;
}
Exporting Your Work
Formula
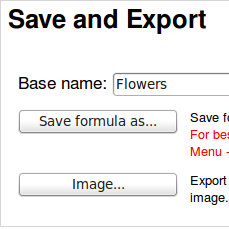
Text file containing the formula text (= your design work). You can load such files by clicking Load formula from text file.
Image
Image of the current canvas state. Gets loaded in another browser window or tab; then it is up to you to save it (e.g. as .PNG) using your browser (Save page as...)
Animated GIF
For formulas designed for animation, compute all frames, and load the resulting animated image in another browser window or tab; then it is up to you to save it (as .GIF) using your browser (Save page as...)
Processing sketch
A sketch that you can use in http://www.openprocessing.org. Formulas designed for animation yield animated sketches; user mouse interaction is supported.
HTML page
An HTML5 page that is standalone and full-featured: formulas designed for animation are animated; user mouse interaction is supported.
Thank you for reading. Now try MathVision, and post your work!
Create formulas, export static or animated images, and post them along with your formula code!
Visit this link to run MathVision.
Visit this link on Github for more information.