Mapping Streetlight Illuminance
by mxchelle in Workshop > Science
3871 Views, 30 Favorites, 0 Comments
Mapping Streetlight Illuminance
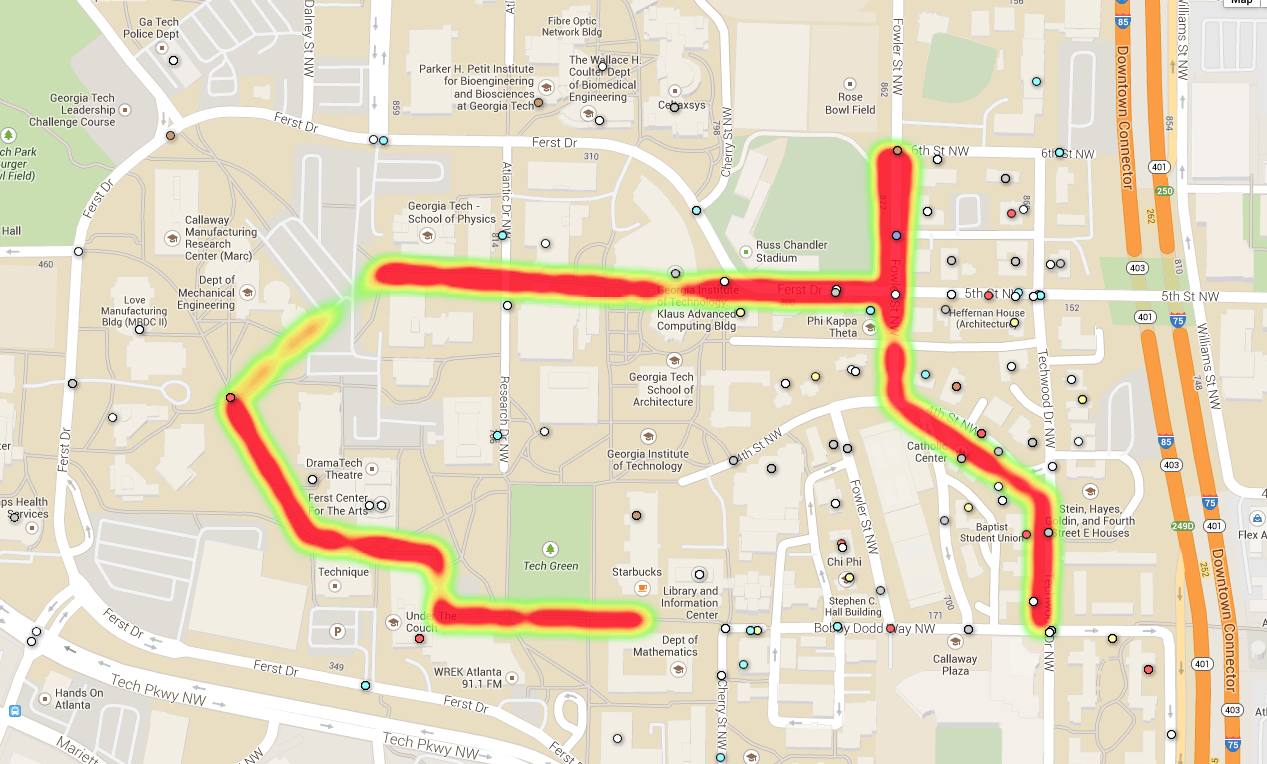
This guide will show you how to create a Google Fusion heat map that represents the streetlight illuminance of your neighborhood.
Resources
Basic requirements are:
-Smartphone/Camera
-Processing
-Google Fusion Table
Optional resources are:
-Crime Report or some data to correlate heat map to
-Map of area you’ll be examining
-Smartphone/Camera
-Processing
-Google Fusion Table
Optional resources are:
-Crime Report or some data to correlate heat map to
-Map of area you’ll be examining
Figure Out Your End Goals
We wanted to find a correlation between streetlight illuminance and crime reports situated within Georgia Tech campus. However, you can employ street light mapping for other uses. We’ll be using Google Fusion Table to create our “heat” map, so play around with the tool to see if you can get your data to show up as points on the map. Other ideas for correlation are positions of cameras, emergency phone poles, street lamps, etc.
Figure Out Your Route
Here’s where the map will come in handy. Plan out your route beforehand and even decide when you’ll start and stop your recording segments.
Night Plotting
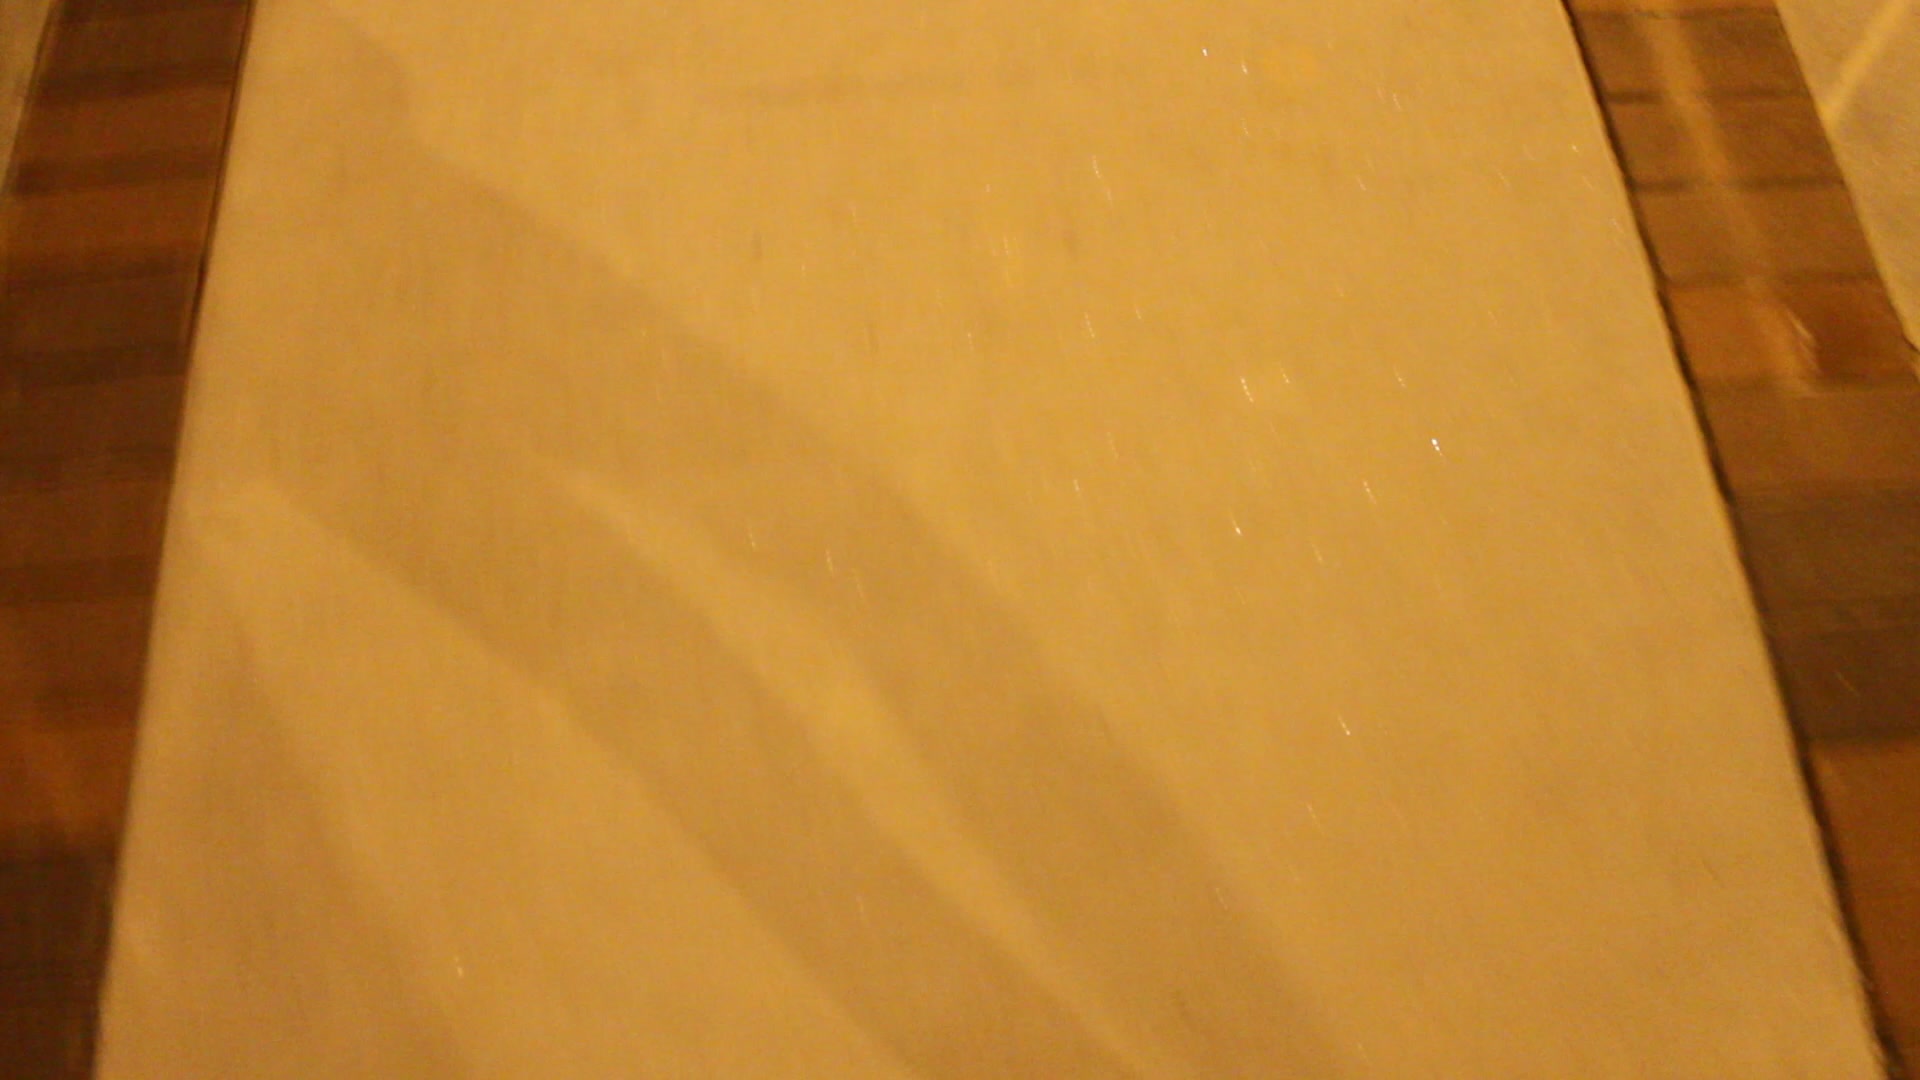
Wait till nighttime when the streetlights turn on. We usually waited till 6:30 before mapping.
There are different ways to capture data. We took a video of both the sidewalk as well as where we were going, making sure to note where each segment starts and ends.
Another alternative would be to have the smartphone’s camera set to burst mode and proceed down the stretch of road. That way, each image would have exact GPS coordinates tied to it. However, this alternative is not supported because the Brightness Extraction Program doesn’t read metadata as of yet.
Walk down the paths you planned with the smartphone or camera facing downwards.
Import Your Media
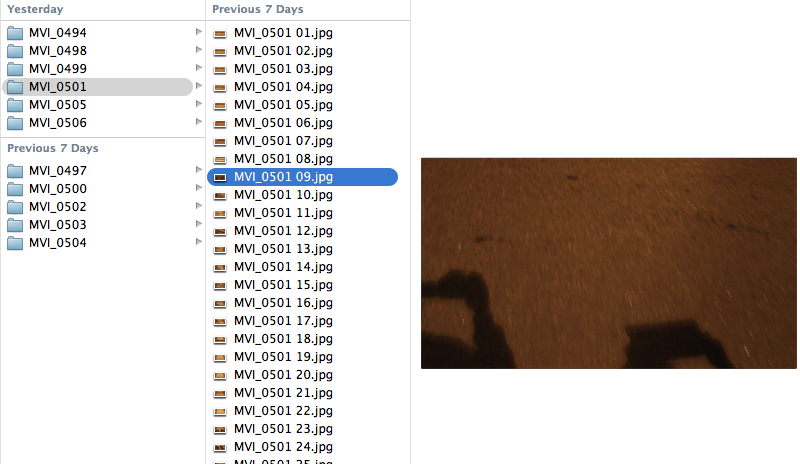
Import your video or photos onto a computer.
If you chose to go the video route, you’ll need to extract frames. Convert videos to photos by grabbing a frame every 2 seconds using the program DVD VideoSoft.
Separate the different paths you took into folders, and name them something distinct.
If you chose to go the video route, you’ll need to extract frames. Convert videos to photos by grabbing a frame every 2 seconds using the program DVD VideoSoft.
Separate the different paths you took into folders, and name them something distinct.
Process GPS Coordinates
For gps coordinates, we mapped the gps coordinates for the start and end of each straight path we followed using iTouchMap. From these endpoints, we could then place the gps location for each intermediary picture (subtracting the end point from the start point and dividing by the total number of photos gave us the distance between each picture).
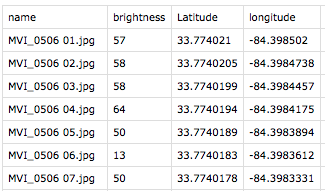
Create a CSV file with each image and its latitude and longitude.
Create a CSV file with each image and its latitude and longitude.
Process Brightness Values
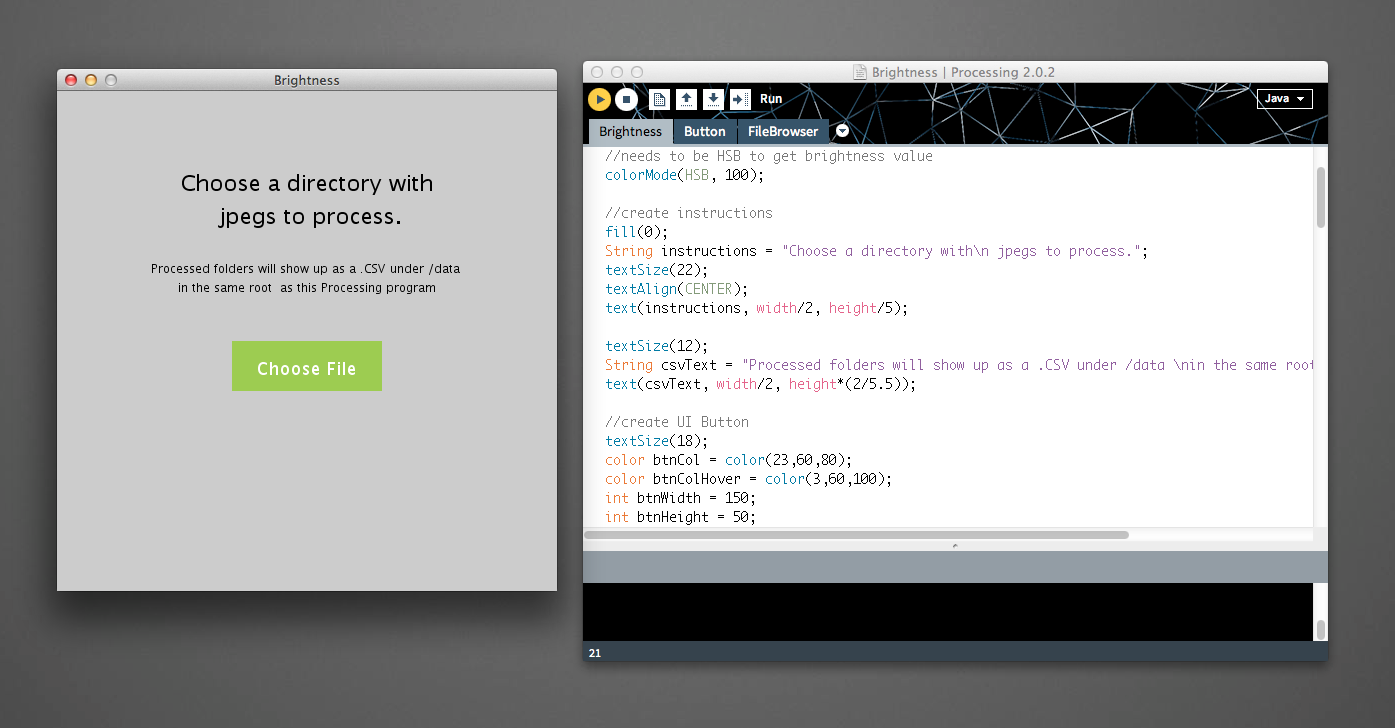
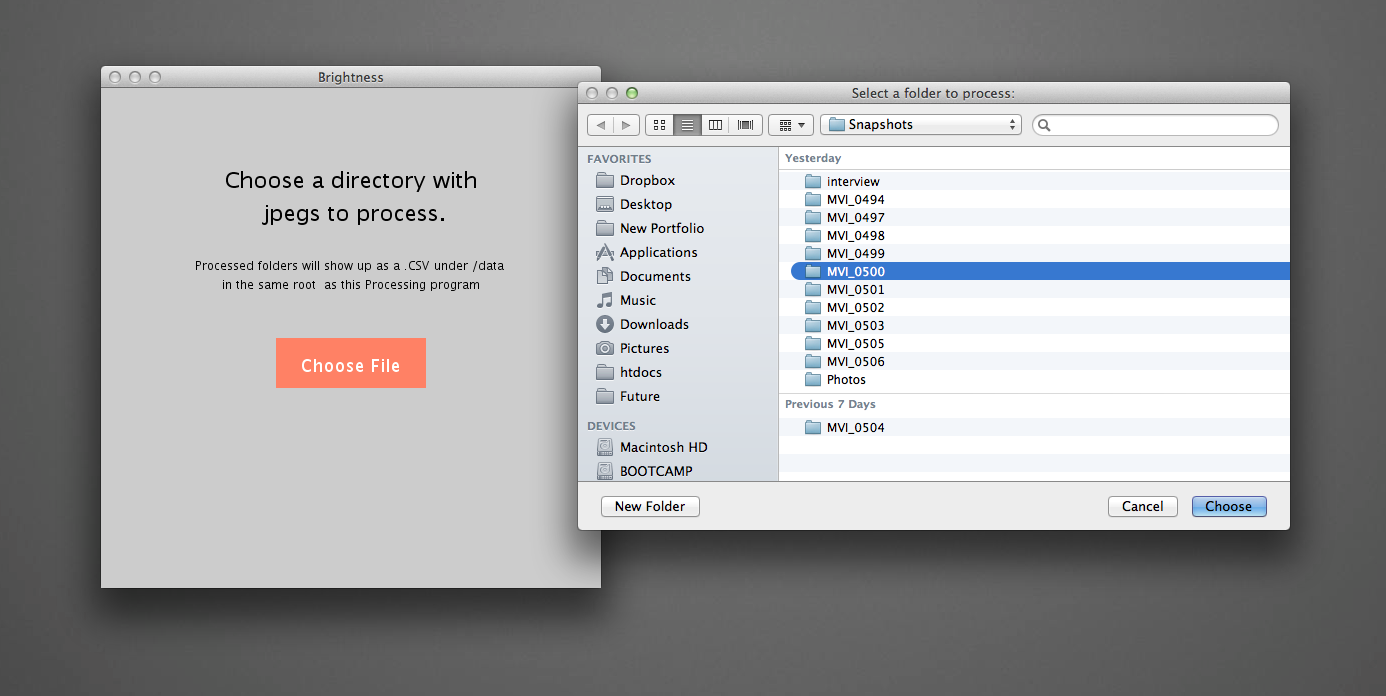
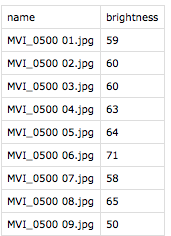
Download this program to batch calculate the average brightness of all images in a folder.
Open it in Processing.
Click the button “Choose folder” and select the route folder you want to process. Click “Choose” to select.
Wait for the folder to process. Go to the path where the actual Brightness Extraction Program is stored. The root will have a folder
Merge this brightness table with the latitude and longitude table. Make sure to inner join based on the name of the file.
Fusion Table Magic
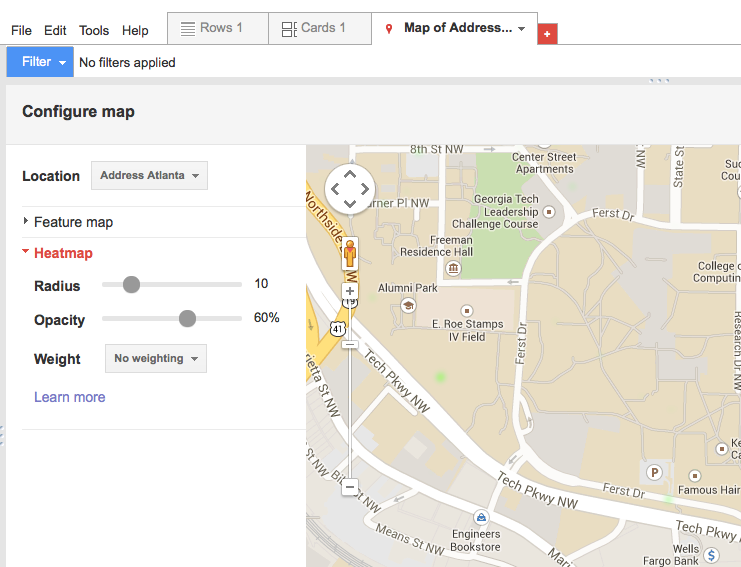
The last step is to create the heatmap of the brightness values. In Google Fusion Table, import the csv file that contains four columns: image names (or IDs), brightness values, latitude and longitude.
Then plot them on the map and select heatmap as the type of map desired.
Then plot them on the map and select heatmap as the type of map desired.
(optional) Merging the Crime Plots With the Brightness Heatmap
If you would like to see how the crime data correlates with the brightness values obtained, you need to manually merge the two maps. Unfortunately, Google fusion is quite limited and one major downside is that you can’t overlay two different data sets on the same map. As a fix to this, you can publish your maps and copy the html/javascript codes. In a text editor, paste the heatmap code. From the crime data, copy the layer = new google.maps.FusionTablesLayer… section of the code and paste it in the initialize function from the heatmap code. You can upload this page to a server and see both datasets overlaid.