Low-Cost Rheometer
by BrownUniversityENGN in Circuits > Sensors
6144 Views, 22 Favorites, 0 Comments
Low-Cost Rheometer
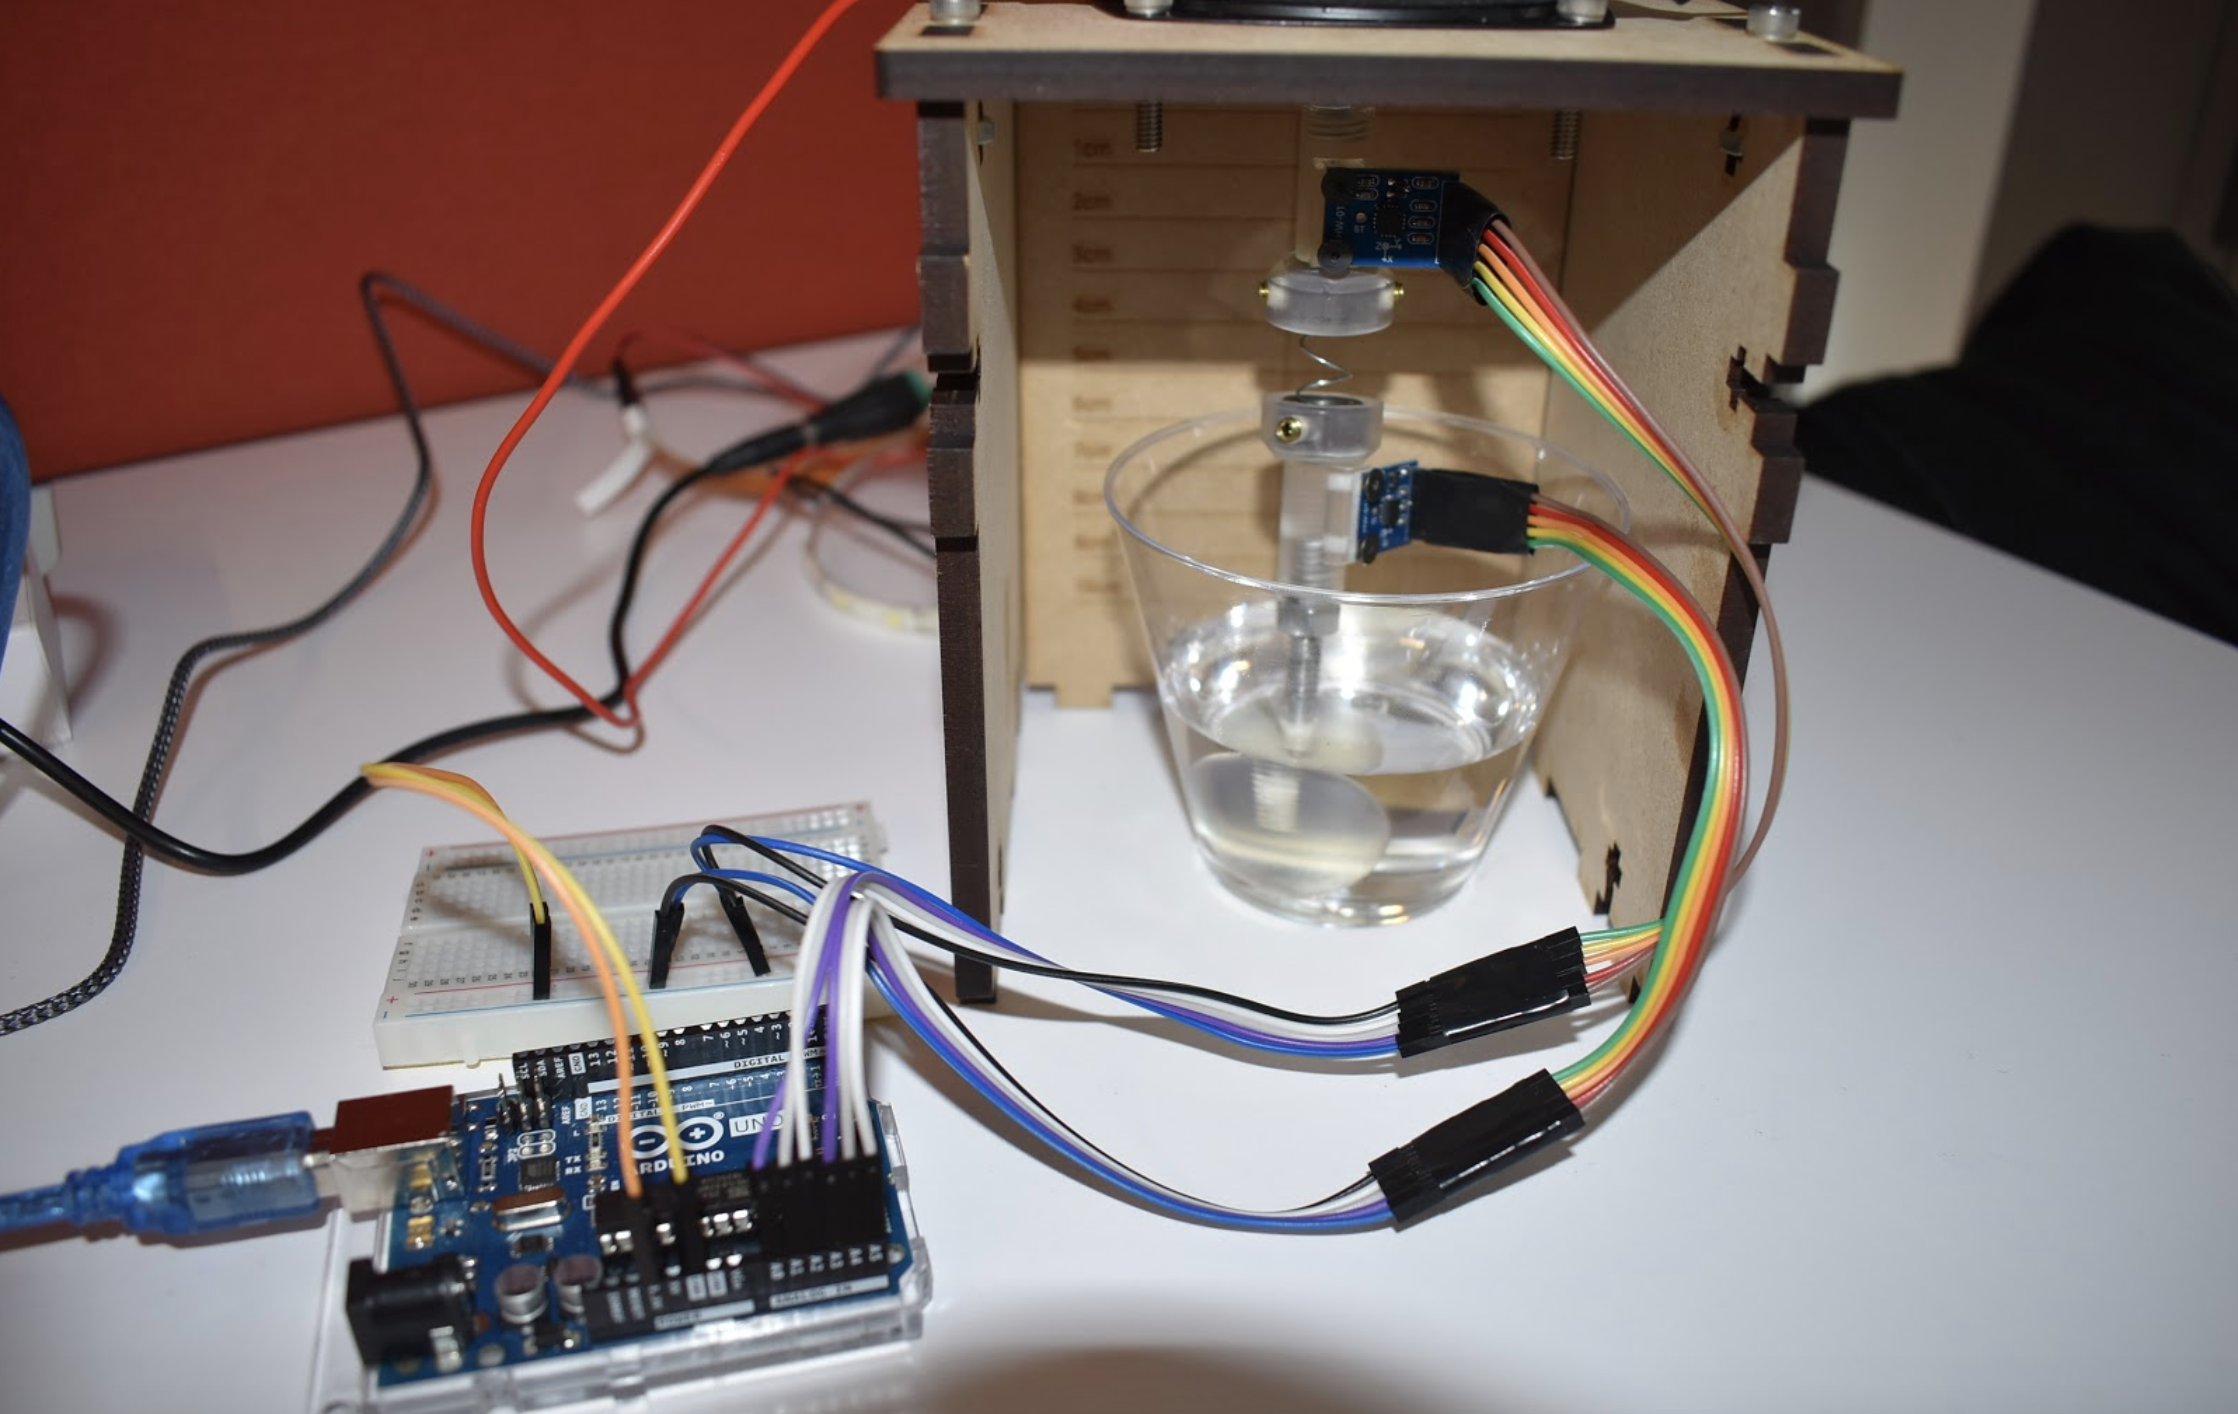
The purpose of this instructable is to create a low cost rheometer to experimentally find the viscosity of a fluid. This project was created by a team of Brown University undergrad and graduate students in the class Vibration of Mechanical Systems.
A rheometer is a lab device used to measure the viscosity of fluids (how thick or sticky a fluid is -- think water vs. honey). There are certain rheometers that can measure the viscosity of fluids by measuring the response of a vibrating system submerged in a fluid. In this low-cost rheometer project, we created a vibrating system from a sphere and spring attached to a speaker to measure the response at different frequencies. From this response curve, you can find the viscosity of the fluid.
Supplies
Materials Needed:
Housing Assembly:
- Particle Board (11’’ W x 9’’ H) (here) $1.19
- 12 x 8-32 x 3/4'' Hex head screws (here) $9.24 tot
- 12 x 8-32 Hex nut (here) $8.39
- 4 x 6-32 x ½’’ Hex head screw (here) $9.95
- 4 x 6-32 Hex nut (here) $5.12
- 9/64'' Allen Key (here) $5.37
Electronics:
- 12V Power Supply (here) $6.99
- Amplifier (here) $10.99
- Aux Cable (here) $7.54
- Jumper Wire (see below)
- Alligator Clips (here) $5.19
- Speaker (here) $4.25
- Screw Driver (here) $5.99
Spring & Sphere Set Up:
- 3D printer resin (variable)
- 2 x accelerometers (we used these) $29.90
- 10 x female-male rainbow cables (here) $4.67
- 12 x male-male rainbow cables (here) $3.95
- Arduino Uno (here) $23.00
- USB 2.0 Cable Type A to B (here) $3.95
- Bread board (here) $2.55
- Compression Springs (we used these) ??
- 2 x Custom Connectors (3D printed)
- 2 x ⅜’’-16 Hex nuts (here) $1.18
- 4 x 8-32 Set Screws (here) $6.32
- 4 x ¼’’-20 Hex nut (Aluminum) (here) $0.64
- 2 x ¼’’-20’’ Threaded Rod (Aluminum) (here) $11.40
- 7/64'' Allen Key
- 5/64'' Allen Key
- 4 x 5x2mm 3/16’’x1/8’’ Screws (here) $8.69
Other
- Plastic Cup (here) $6.99
- Liquid to test viscosity (we tested karo syrup, vegetable glycerine, Hershey’s chocolate syrup)
TOTAL COST: $183.45*
*does not include 3D printer resin or liquid
Tools
- Laser Cutter
- 3D printer
Software Needed
Files and Code:
- Adobe Illustrator file for the housing assembly (Rheometer_Housing.ai)
- Speaker Controller GUI (ENGN1735_2735_Vibrations_Lab_GUI_v2.mlapp)
- Arduino Rheometer File (rheometer_project.ino)
- Sphere mesh files (cor_0.9cmbody.stl and cor_1.5cmbody.stl)
- Custom Connector ASCII geometry file (Connector_File.step)
- MATLAB Code 1 (ff_two_signal.m)
- MATLAB Code 2 (accelprocessor_foruser.m)
- MATLAB Code 3 (rheometer_foruser.m)
Part 1: Set Up
How to setup the experimental platform.
3D Print and Laser Cut All Parts (custom Connectors, Spheres, and Housing)
Connect the Electronics As Shown Below
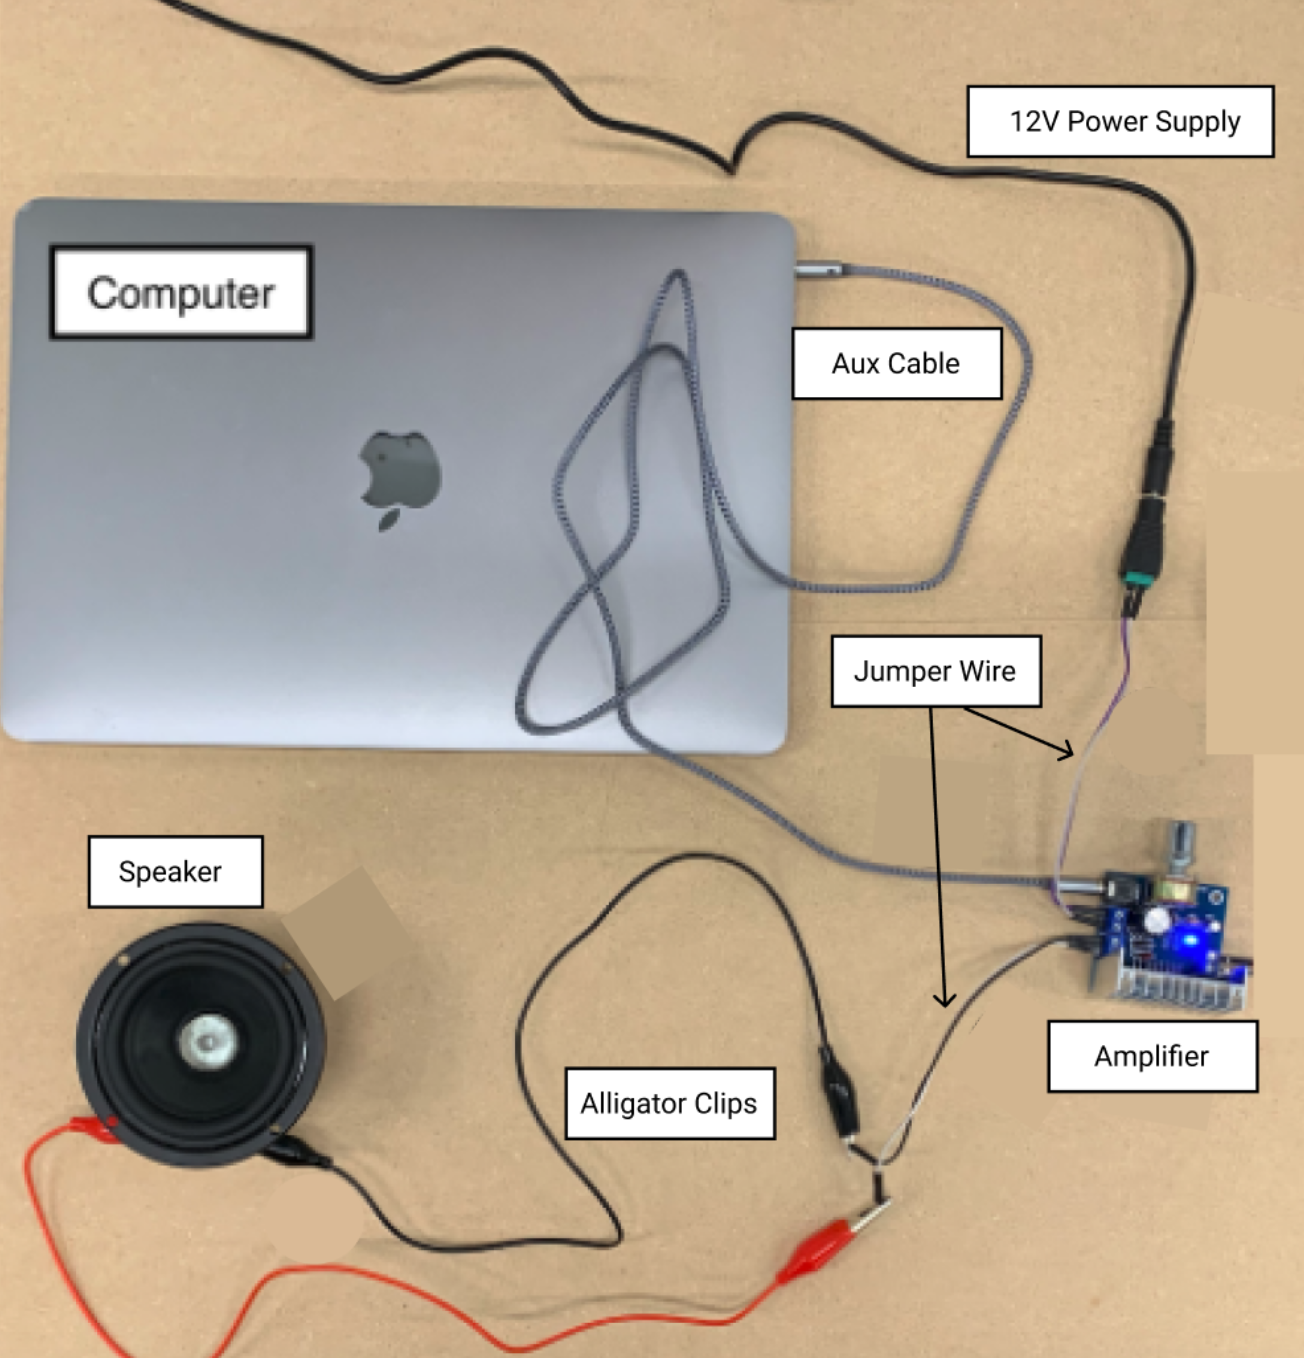
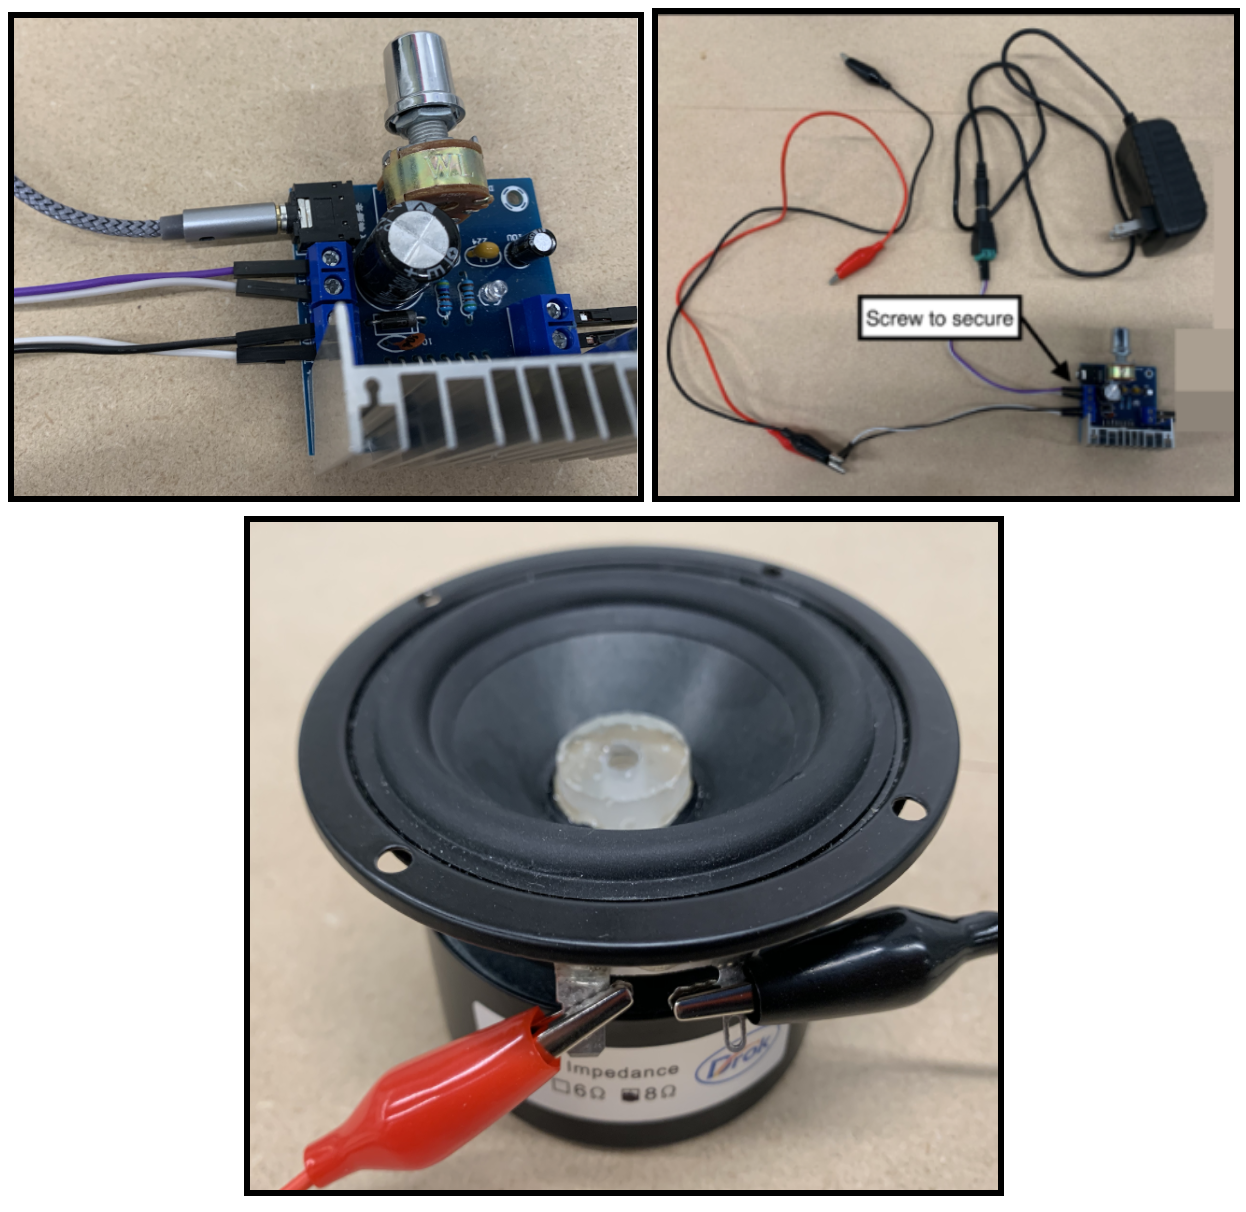
Important to note: Do not plug the power supply into the outlet until all steps in this section are completed! ALWAYS UNPLUG THE POWER SUPPLY WHEN MAKING ANY CHANGES.
To start, make sure the amplifier is placed with the knob facing away. Connect the alligator clips and jumper wires to the left-bottom hand terminals on the amplifier. Attach the power cord and its jumper wire to the left-top hand terminals on the amplifier. Screw down on the terminal connection ends to secure the wire pins. Ensure that the positive and negative terminals line up properly with the terminals on the amp and clip alligator clips to the speaker. Make sure that these two clips do not come into contact.
GUI Set Up
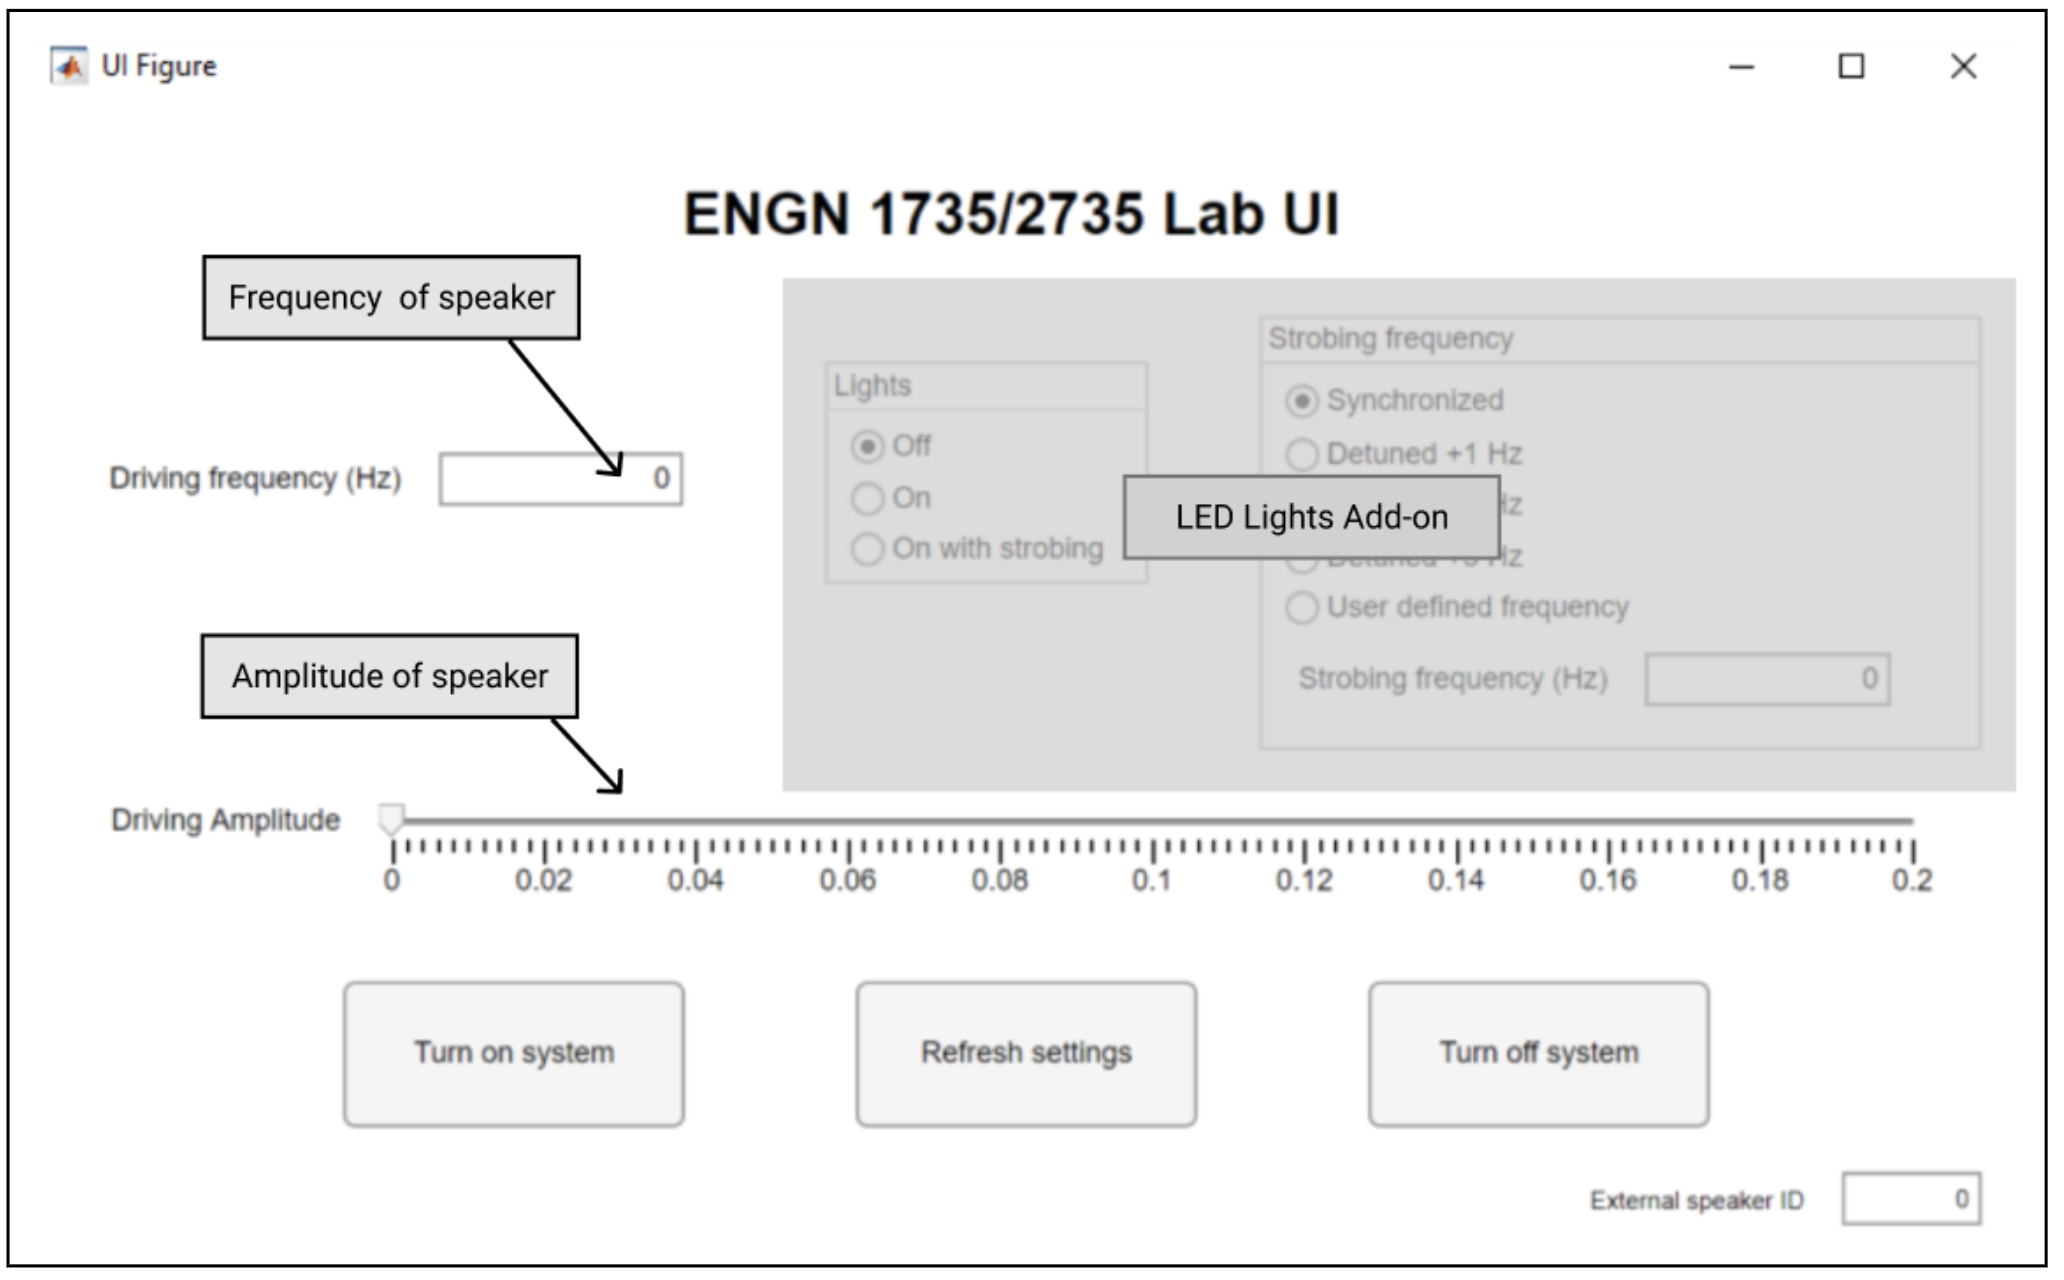

Now that the electronics are set up, we can test the GUI that will allow us to drive the speaker and create the vibrating system submerged in our fluid. The speaker will be controlled by the audio output system in our computer. Start by downloading MATLAB and the GUI code included above. NOTE: there are LED Lights settings that will not be used and should be ignored.
Once you have opened MATLAB, run the following on the command window, “info = audiodevinfo “ and double click on the ‘output’ option. Find the ID number for the external headphones/speaker option. It will be something like “Speaker / Headphones …” or “External …” or “Built-In Output …” depending on your machine. Set the “External speaker ID” to this ID number.
Now let’s test that our system is set up correctly. TURN YOUR COMPUTER VOLUME DOWN ALL THE WAY. Unplug the Audio cable from your computer and instead plug in a set of headphones We will test the connection for the GUI to send a signal to the shaker. Enter 60 Hz as the driving frequency in the text field as shown below. (This field accepts values up to 150 Hz). This is the forcing frequency for your set up. Then, slide the driving amplitude up to a value of approximately 0.05. Then, press the “Turn on system” button to send a signal to your headphones. This will trigger one of the channels (left or right) of your headphones. Turn up your computer volume until a sound can be heard. Hit the “Turn off system” once an audible tone can be heard and make sure the sound stops playing.
To change the frequency or driving amplitude of your system while it’s running, hit the “Refresh settings” button.
Create the Vibrating Mass Assembly
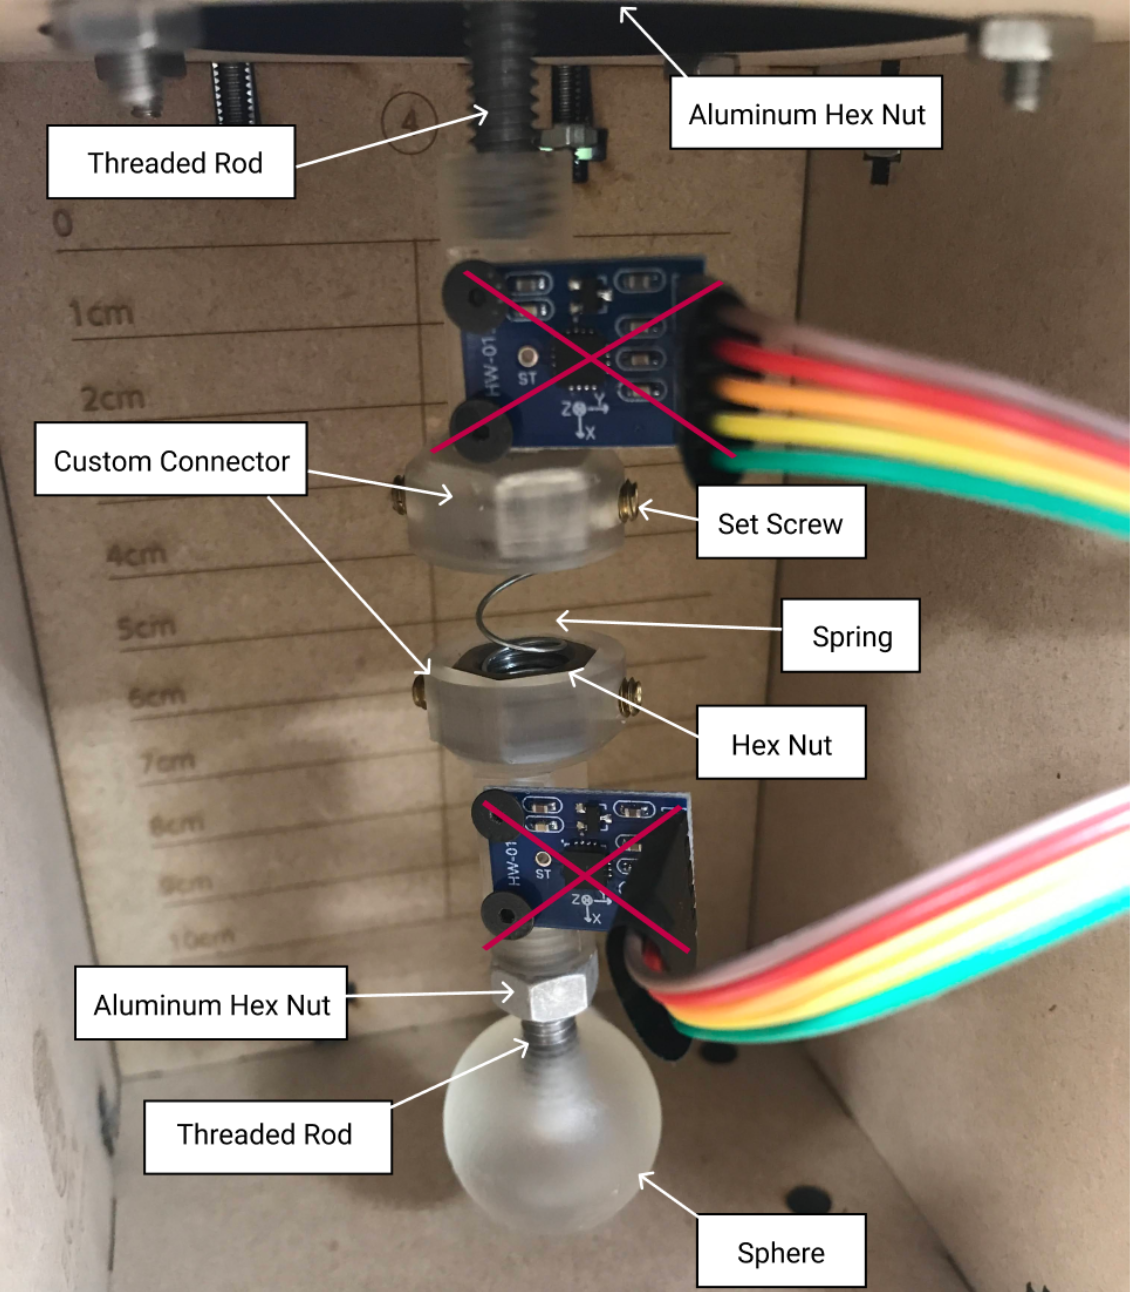
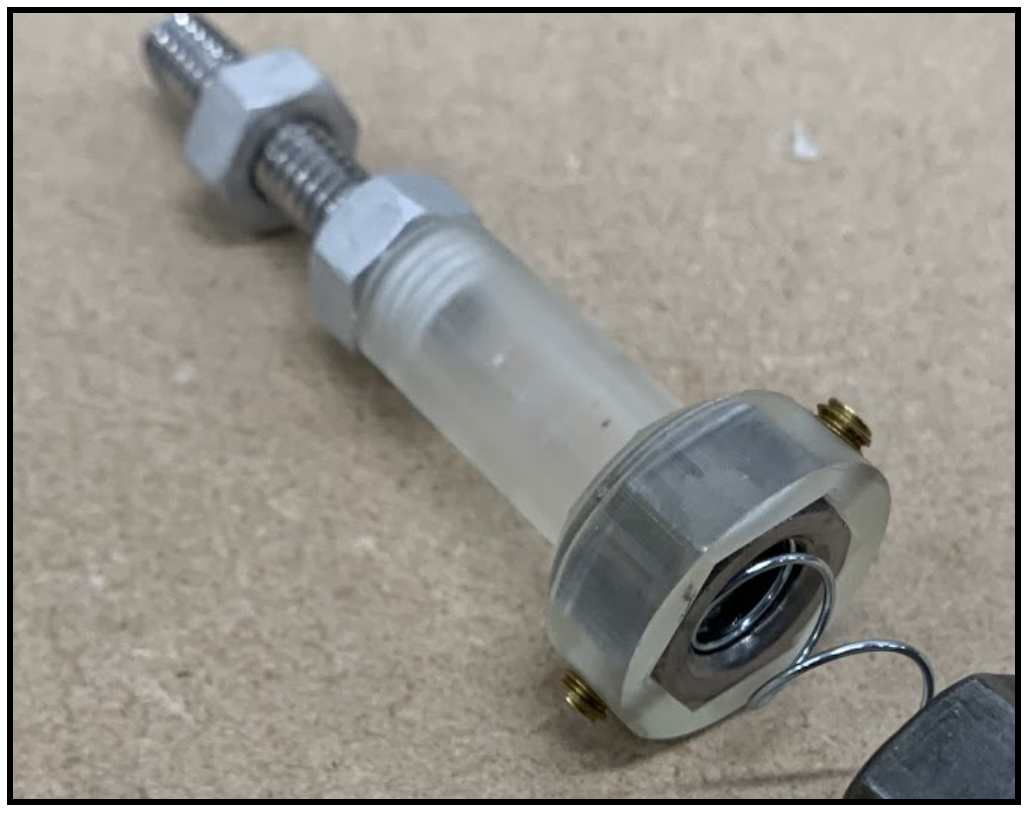
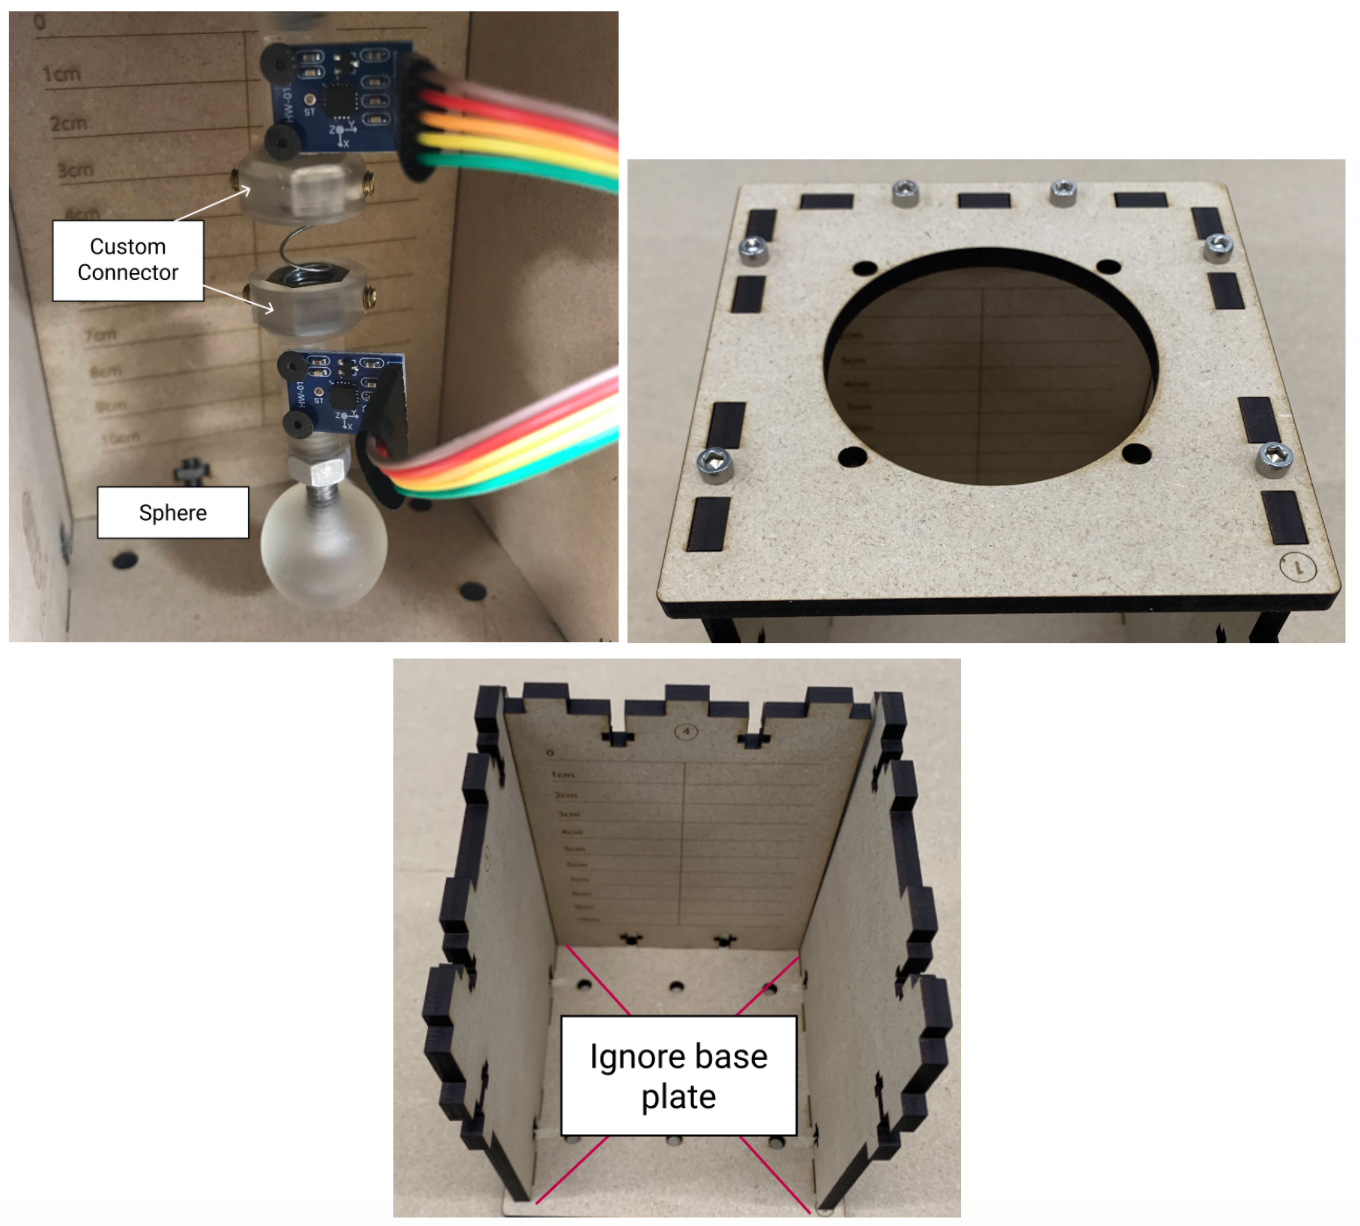
We will now begin to assemble the vibrating mass system that we will submerge in our fluid. Ignore the accelerometers in this step and focus on assembling the sphere, connectors, hex nuts, and spring. Secure a steel hex nut in each of the custom connectors with set screws and the 5/64'' Allen Key. Connect one of these to the sphere with an aluminum hex nut and aluminum Threaded Rod. Combine both as shown above. Finally, screw the second Threaded Rod into the top Connector and partially screw on an aluminum hex nut.
Add the Accelerometers & Arduino
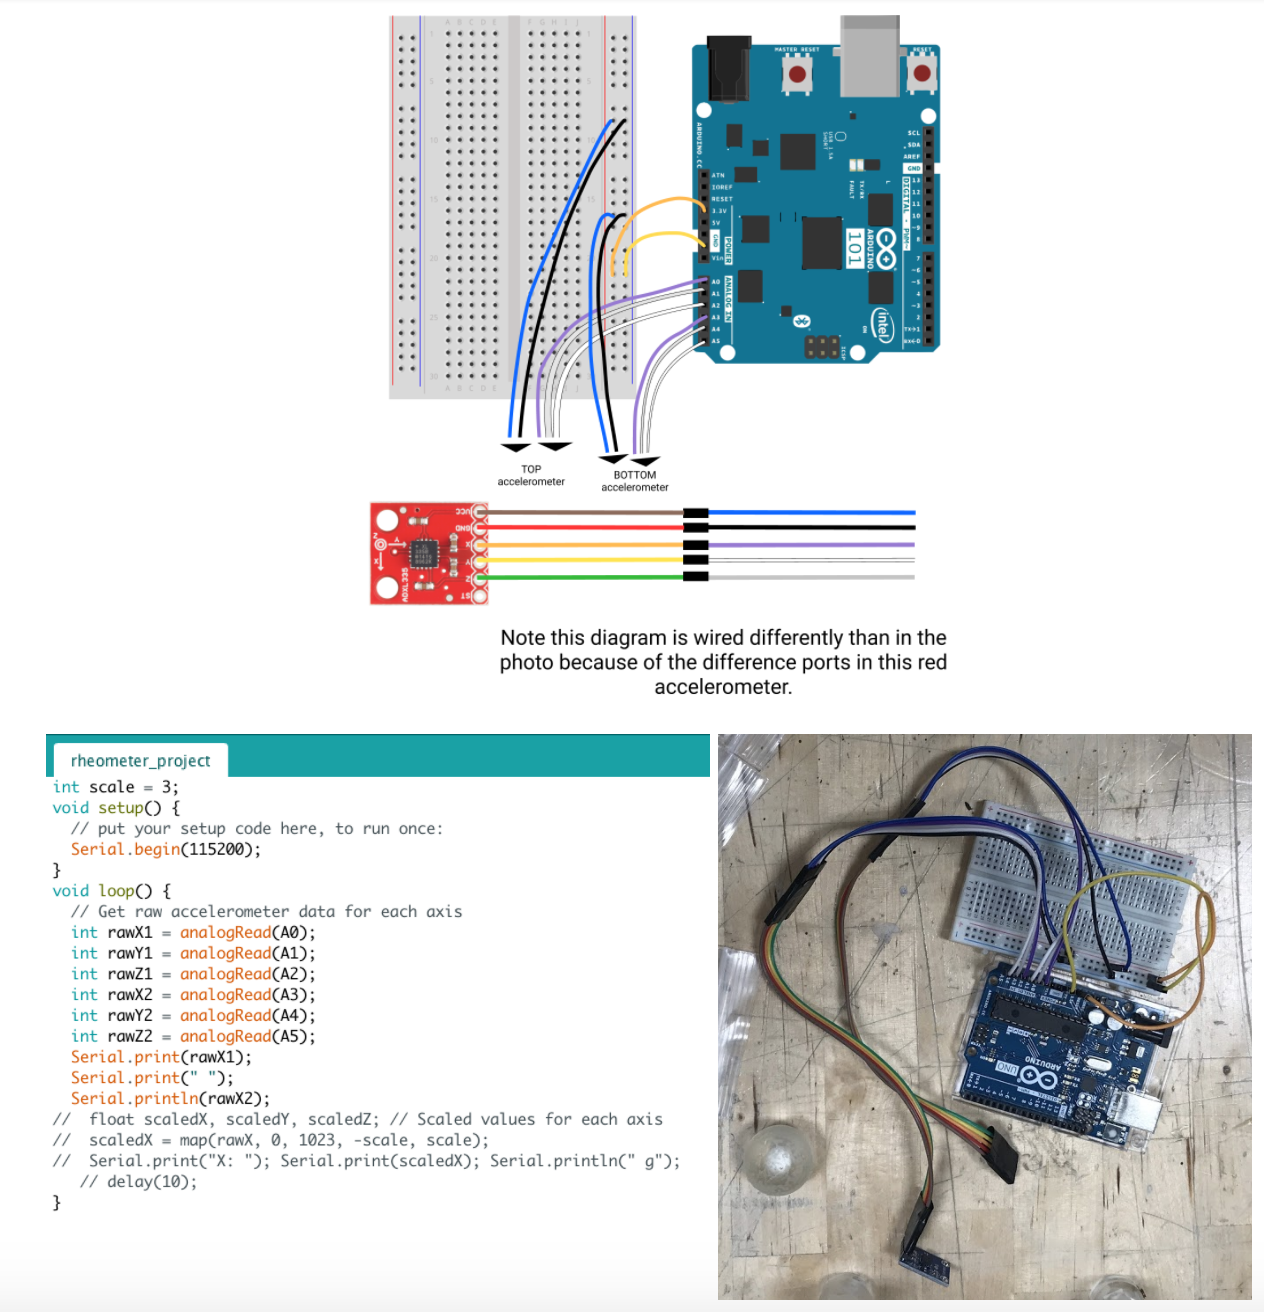
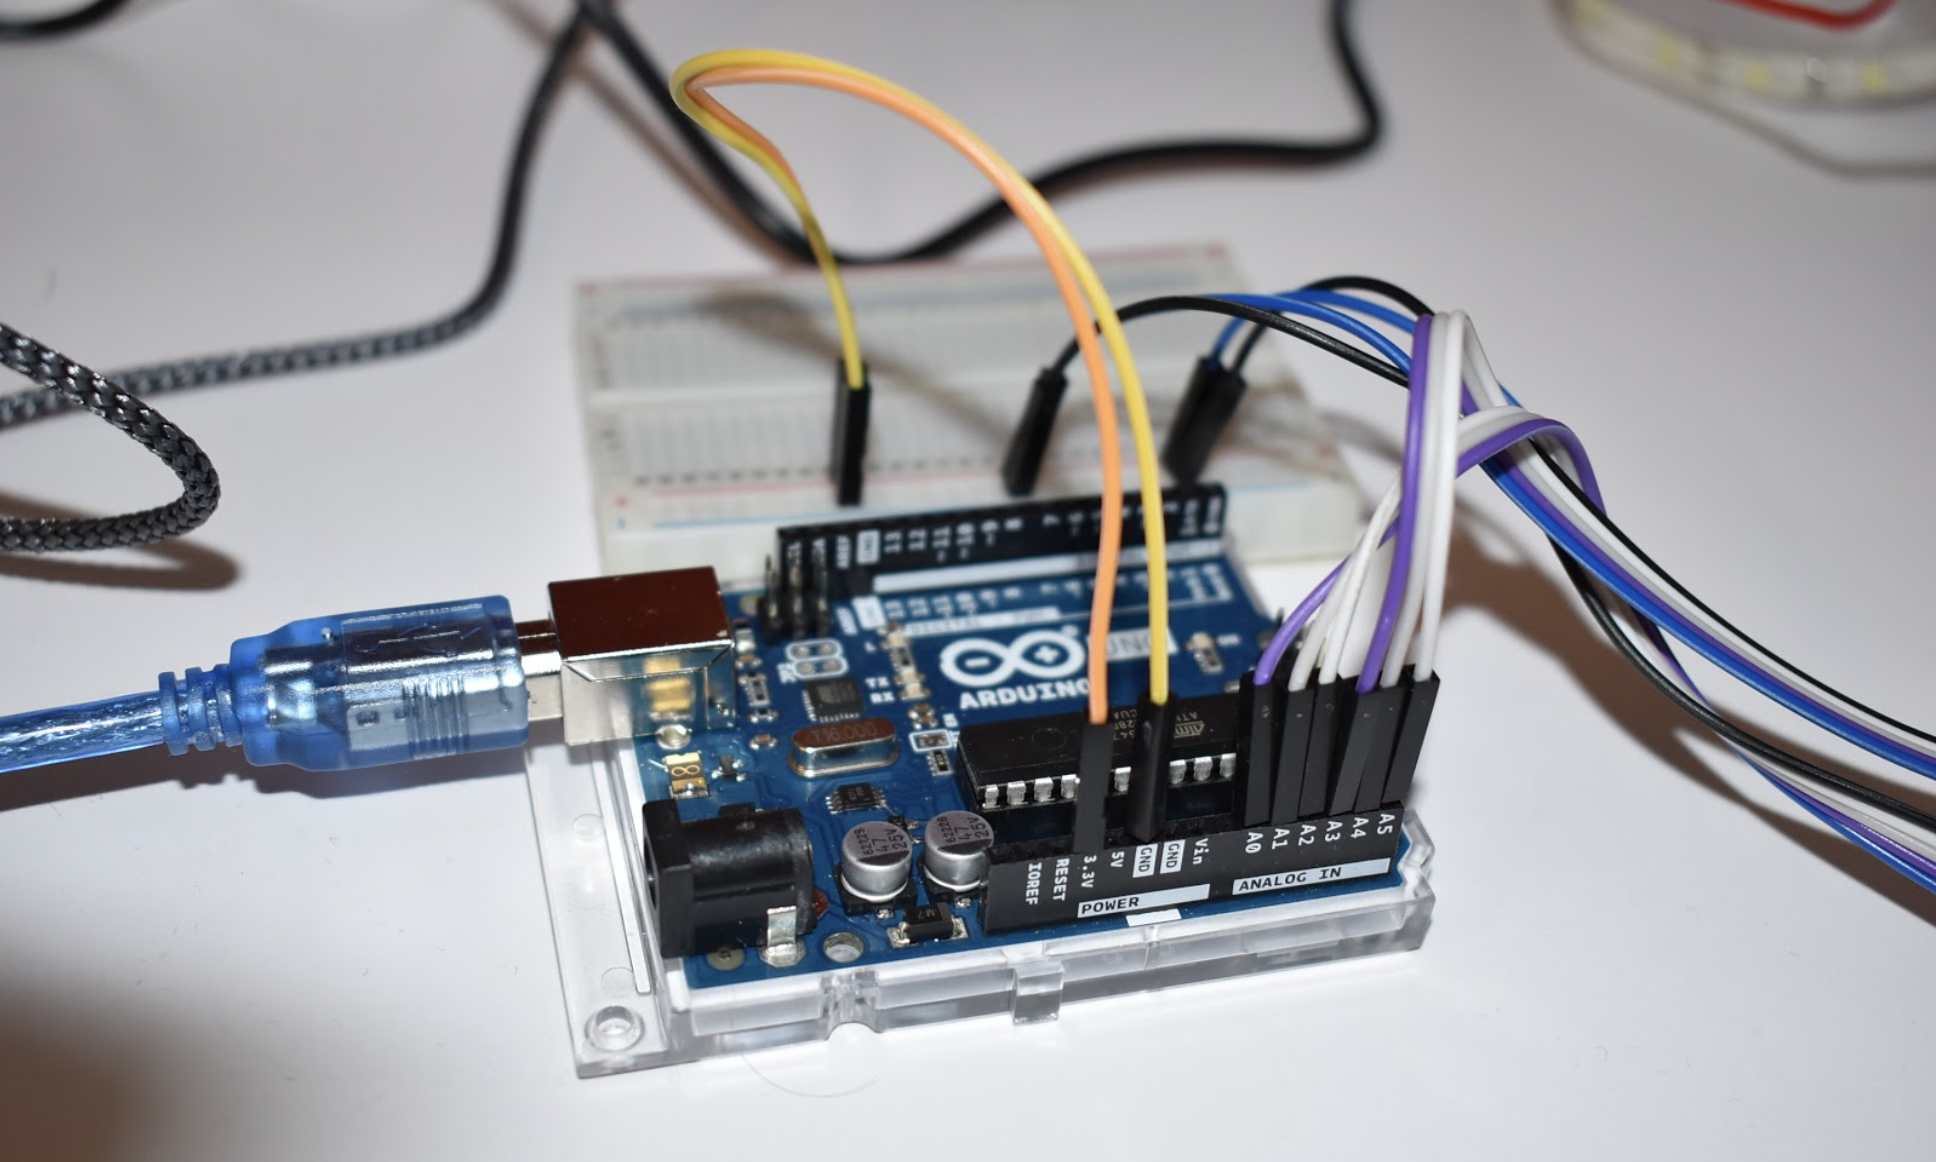
Using the diagram above, connect the arduino to the accelerometers. To create the long rainbow cables, use the male-male wires (pictured in the diagram as the white, grey, purple, blue, and black) and connect them to the female-male wires (red, yellow, orange, green, and brown). The second end will connect to the accelerometers. Make sure that the “GND” (Ground) and “VCC” (3.3 Volts) accelerometer ports are matched to the breadboard and that the “X” port is matched to the A0 and A3 ports in the Arduino.
Attach the final accelerometers to the Vibrating Mass assembly using 5x3mm 3/16’’x1/8’’ screws. You will need to make sure the TOP accelerometer is connected to the A0 and the BOTTOM accelerometer to A3 in order for the Arduino code to work.
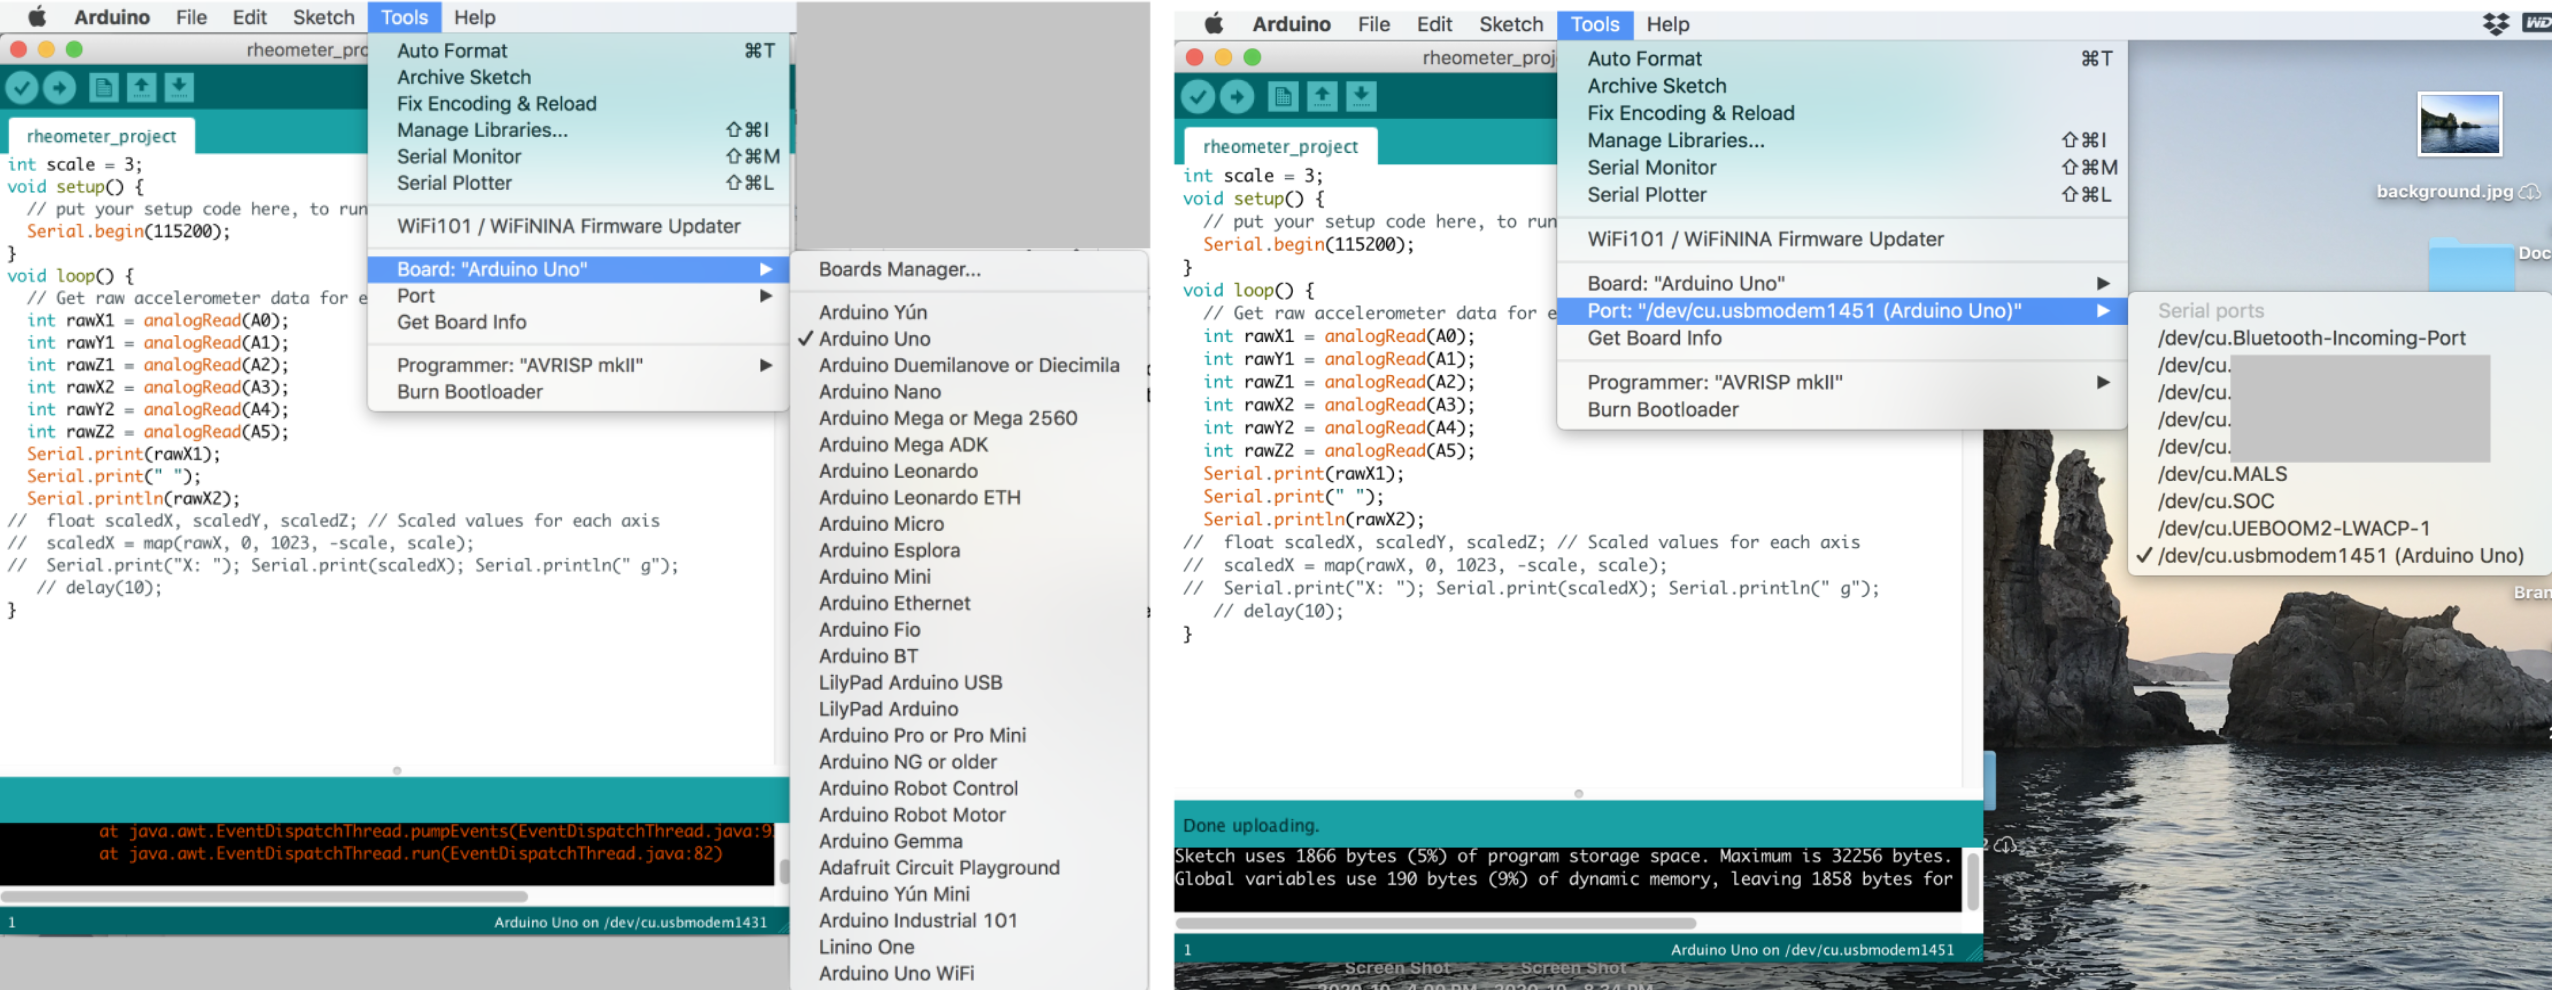
To set up the Arduino itself, first download the arduino software onto your computer. Plug the Arduino into your computer using the USB 2.0 Cable. Open the file provided or copy and paste it into a new file. Navigate to the Tool in the top bar and hover over “Board:” to select the Arduino Uno. One down, hover over “Port” and select Arduino Uno.
Set Up the Final System
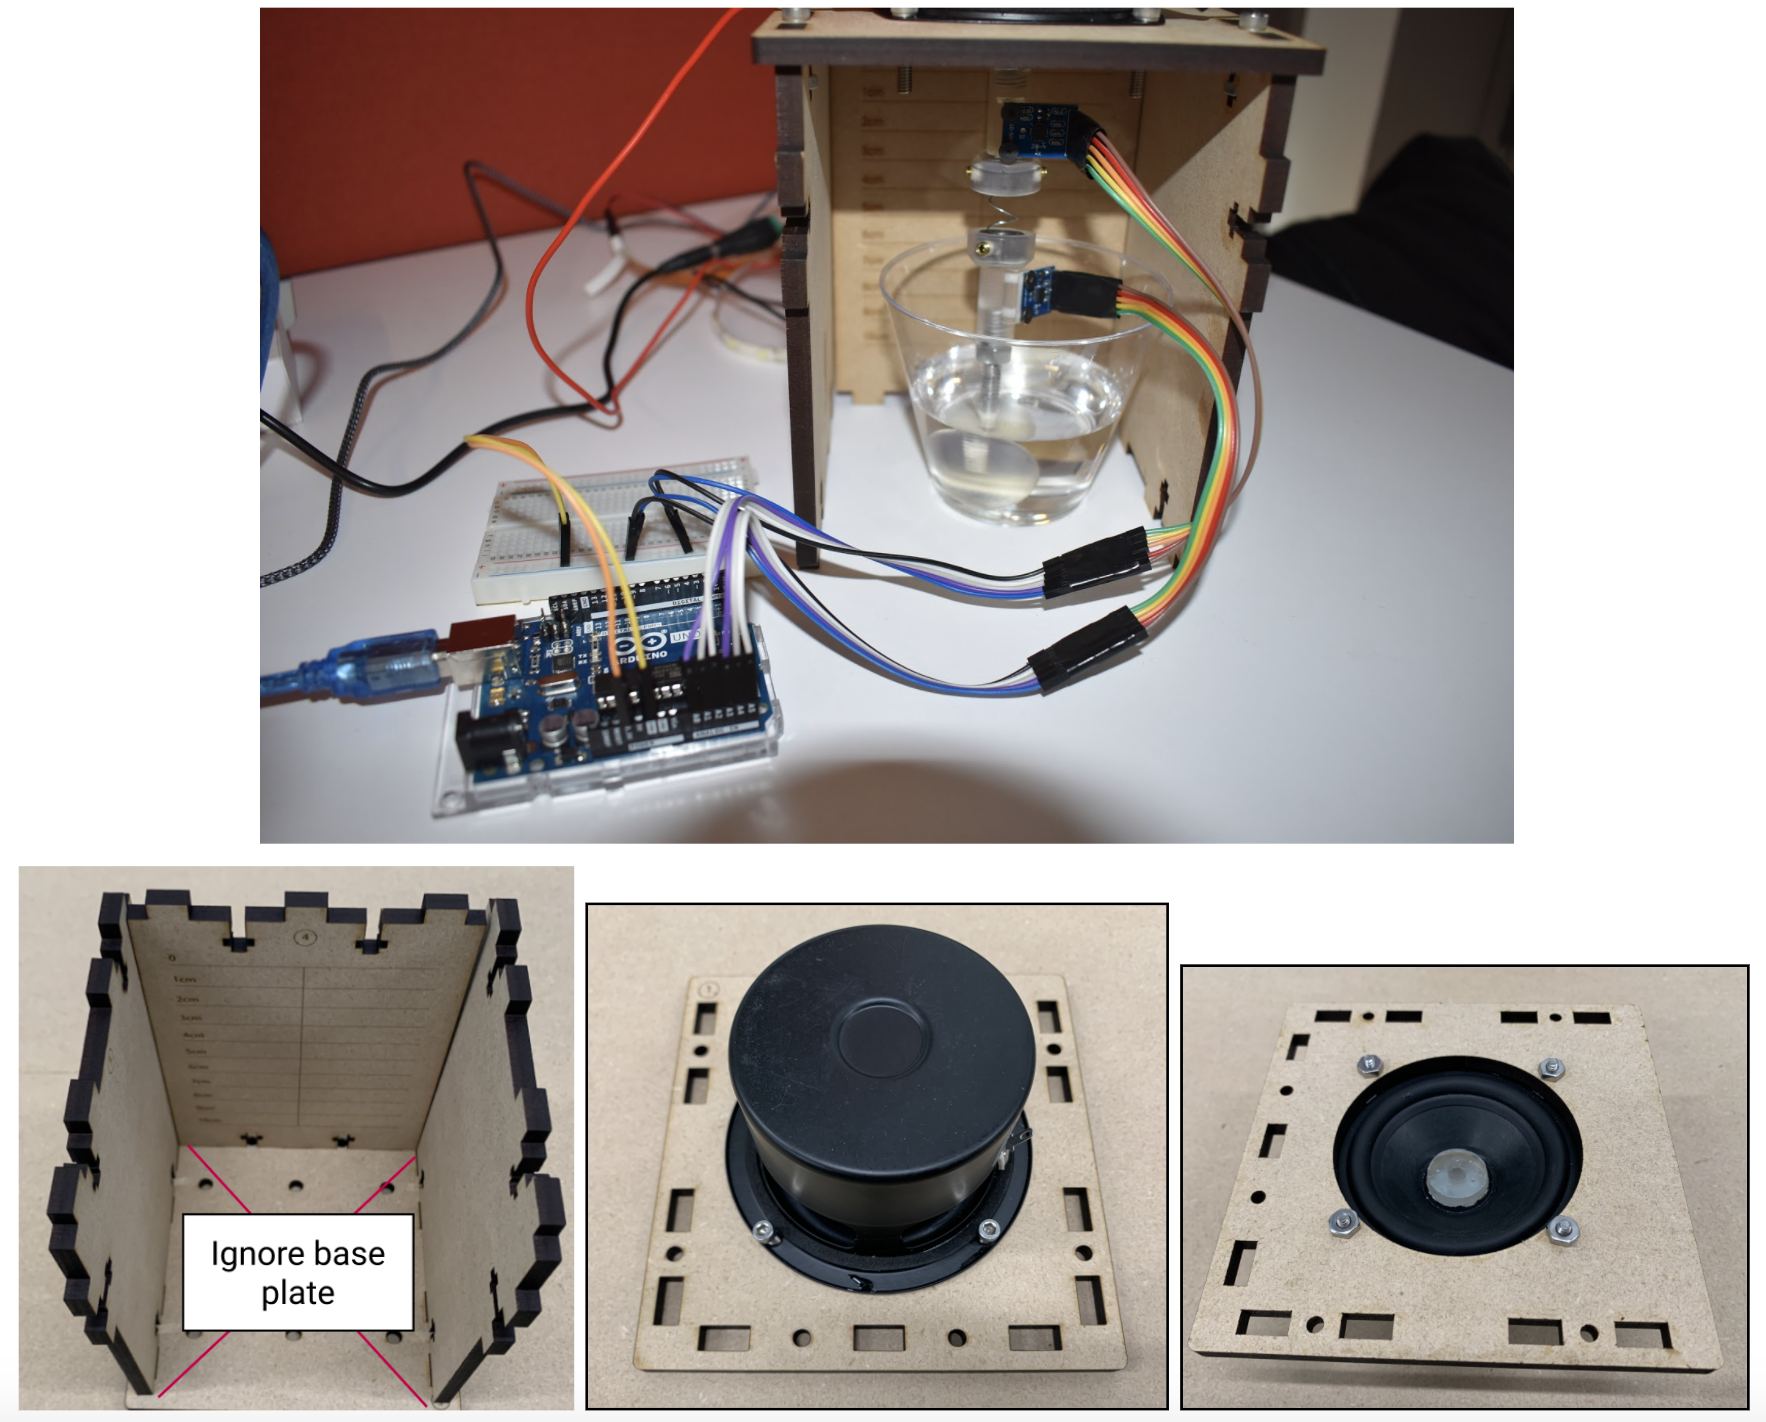
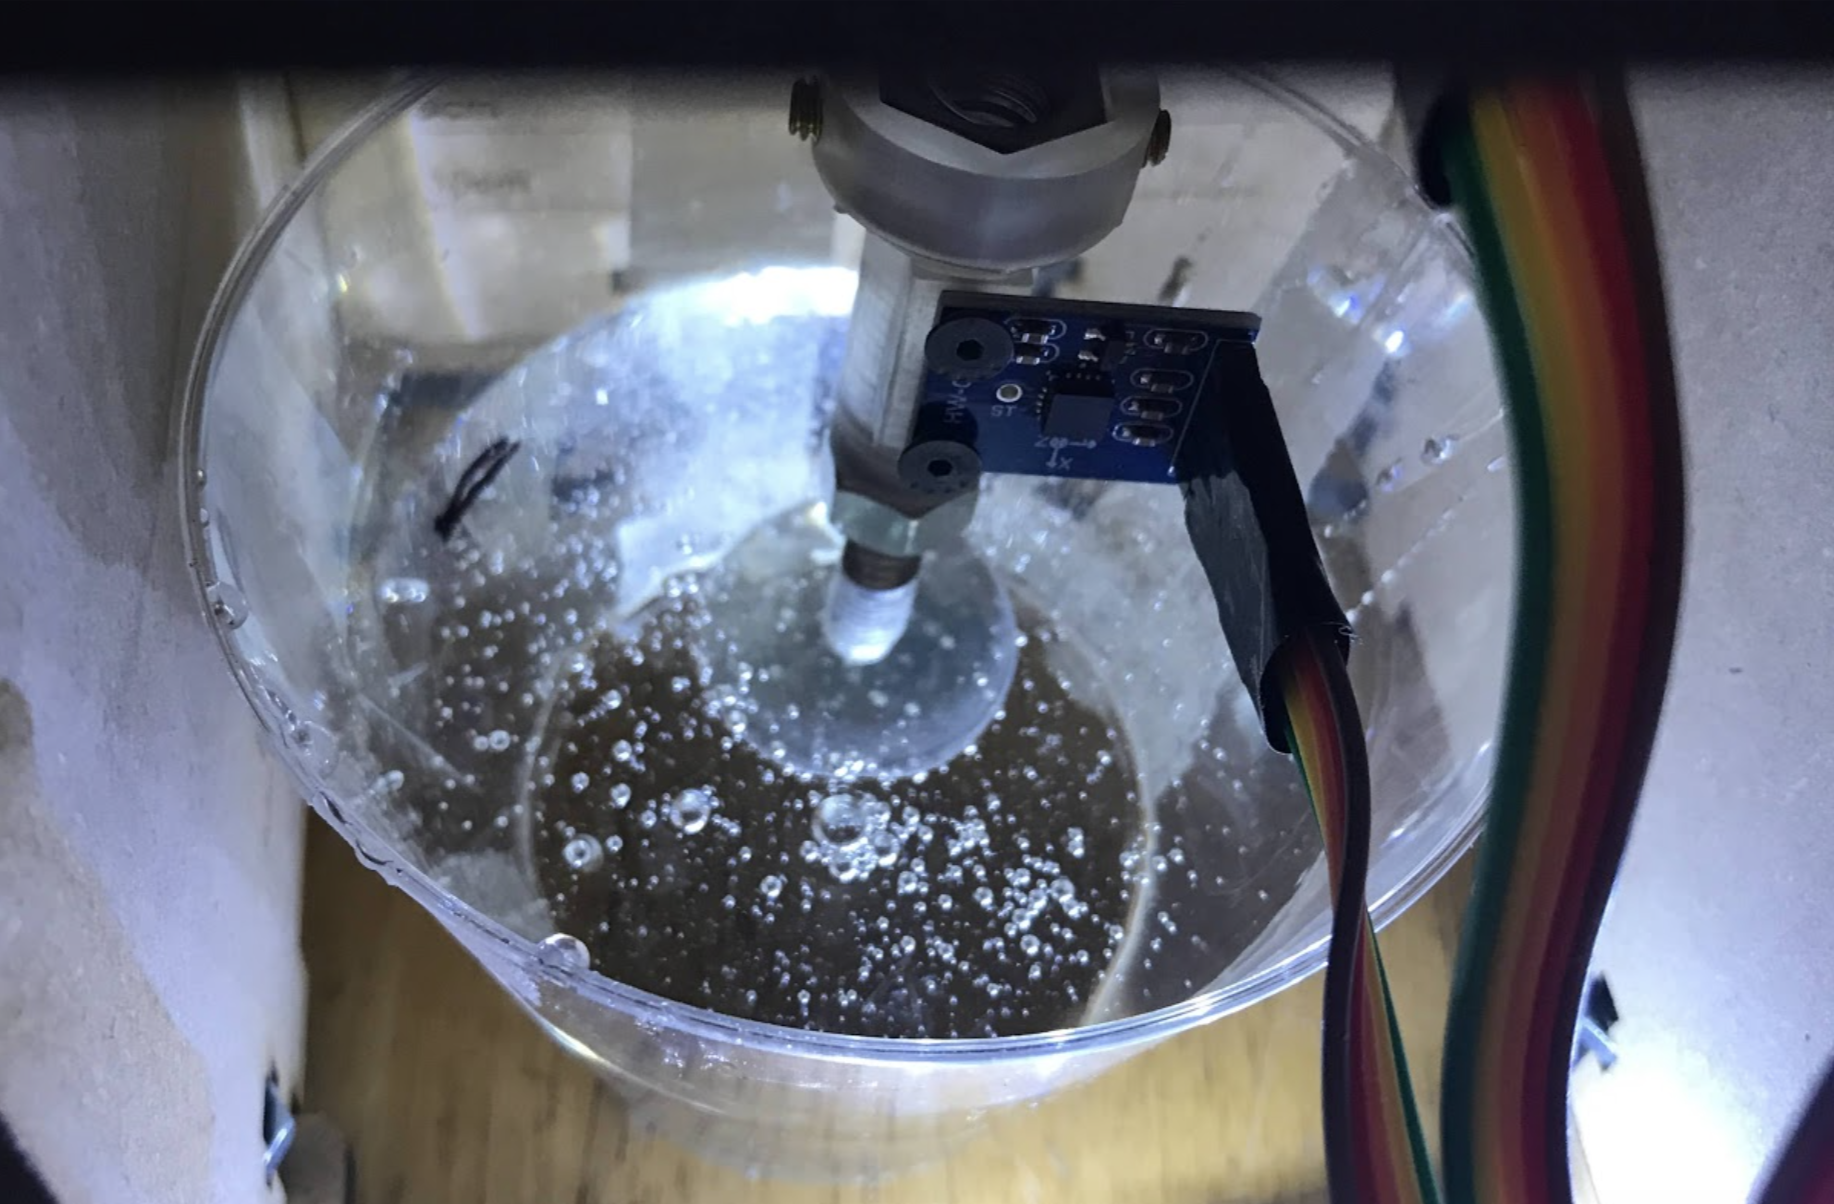
Final step of the set-up -- putting it all together! Start by unclipping the alligator clips from the speaker and screwing the speaker into the top of the housing assembly with the 6-32 x ½’’ Hex head screws,6-32 hex nut and the 9/64'' Allen Key. Next, screw the vibrating mass assembly (with the accelerometers) into the speaker. For the best result, we recommend turning the speaker to avoid tangling the accelerometer wires. Tighten the mass to the speaker with the aluminum hex nut.
Finally, slot the three sides of the housing assembly into the top. Secure the housing assembly using the 8-32 x 3/4'' Hex head screws and 8-32 hex nuts. Finally, reattach the alligator clips to the speaker. You’re ready to start testing!
Choose your fluid of choice and fill your plastic cup until the sphere is completely submerged. You do not want the sphere to be partially submerged, but also be careful to not submerge the sphere so far that the fluid touches the aluminum hex nut.
Part 2: Running the Experiment
Now that we’ve got our assembly finished, we can record our data. You will sweep through frequencies between 15 - 75 Hz at a set driving amplitude. We recommend increments of 5 Hz, but this can be changed for more precise results. The Arduino will record both the acceleration for the speaker (top accelerometer) and the sphere (bottom accelerometer) which you will record in a csv file. The MATLAB Code 1 & 2 provided will read in the csv values as separate columns, do a two-signal fourier transform to de-noise the signal, and print out the resulting amplitude ratio of the top and bottom accelerometer. MATLAB Code 3 will accept these amplitude ratios and an initial guessed viscosity and plot the experimental and calculated ratios vs frequencies. By varying your guessed viscosity and comparing visually this guess to the experimental data, you will be able to determine the viscosity of your fluid.
For an in-depth explanation of MATLAB code, see the technical documentation attached.
Recording Data in a CSV
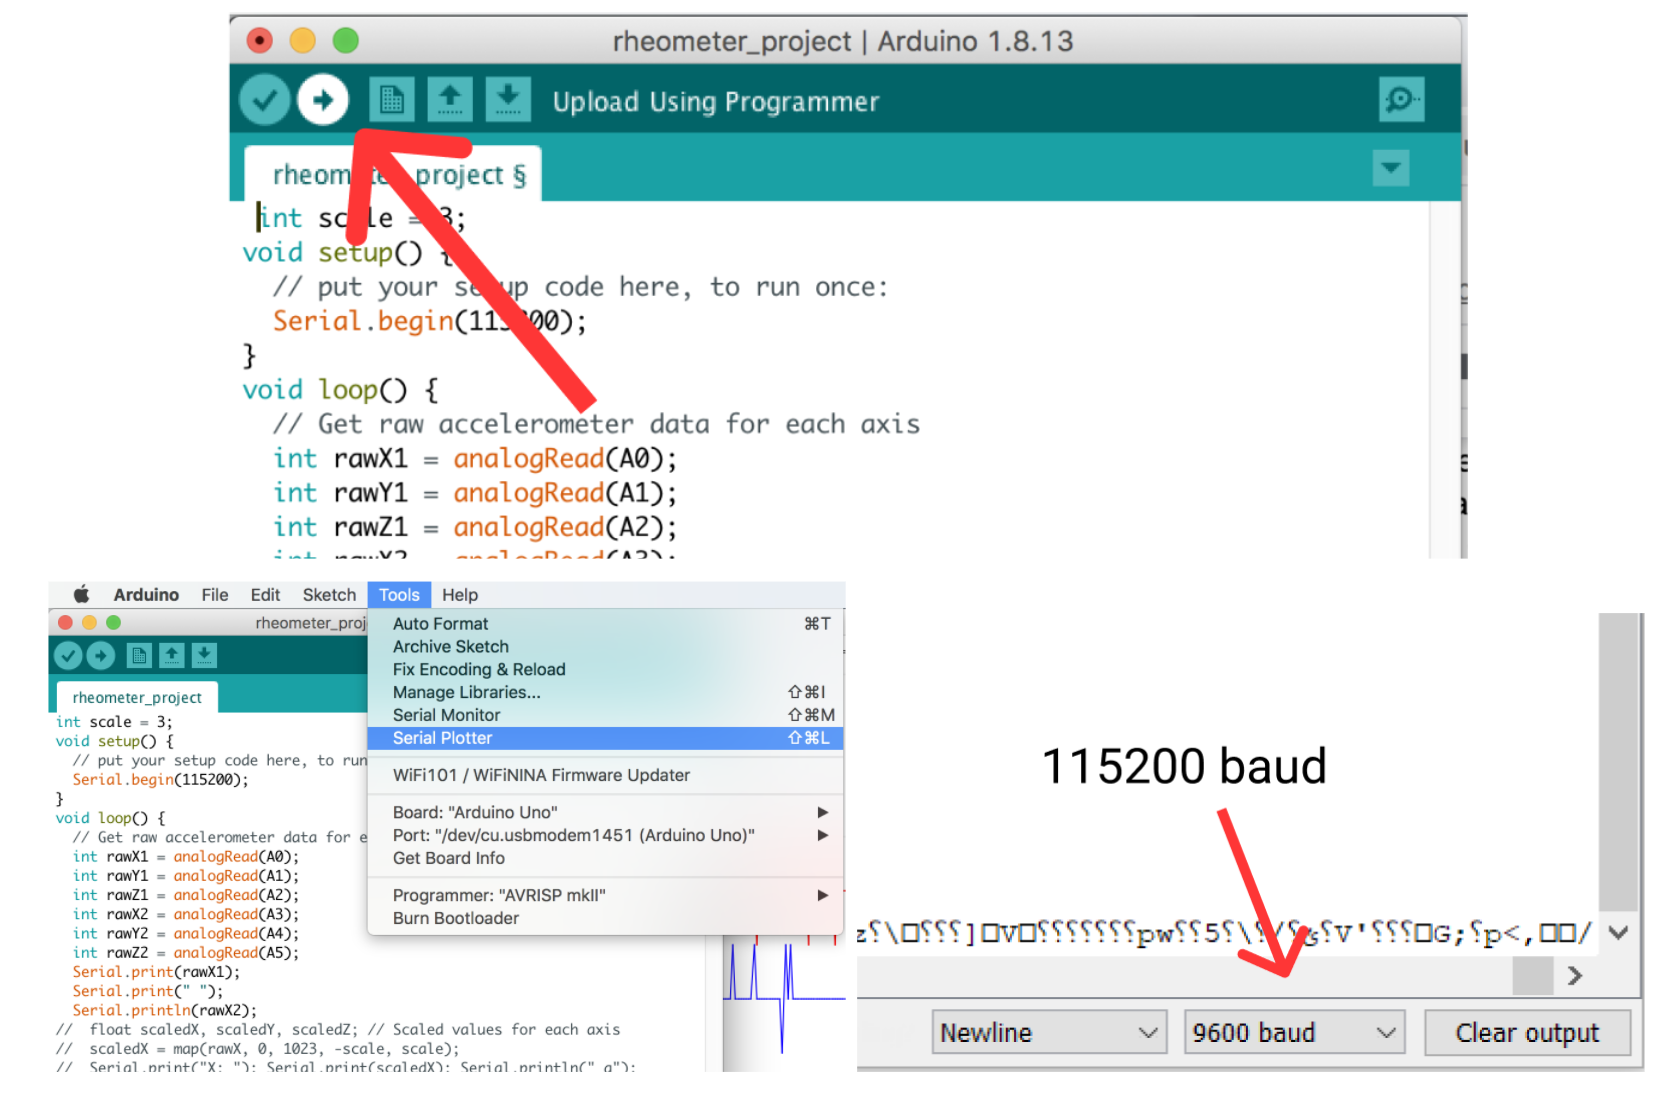
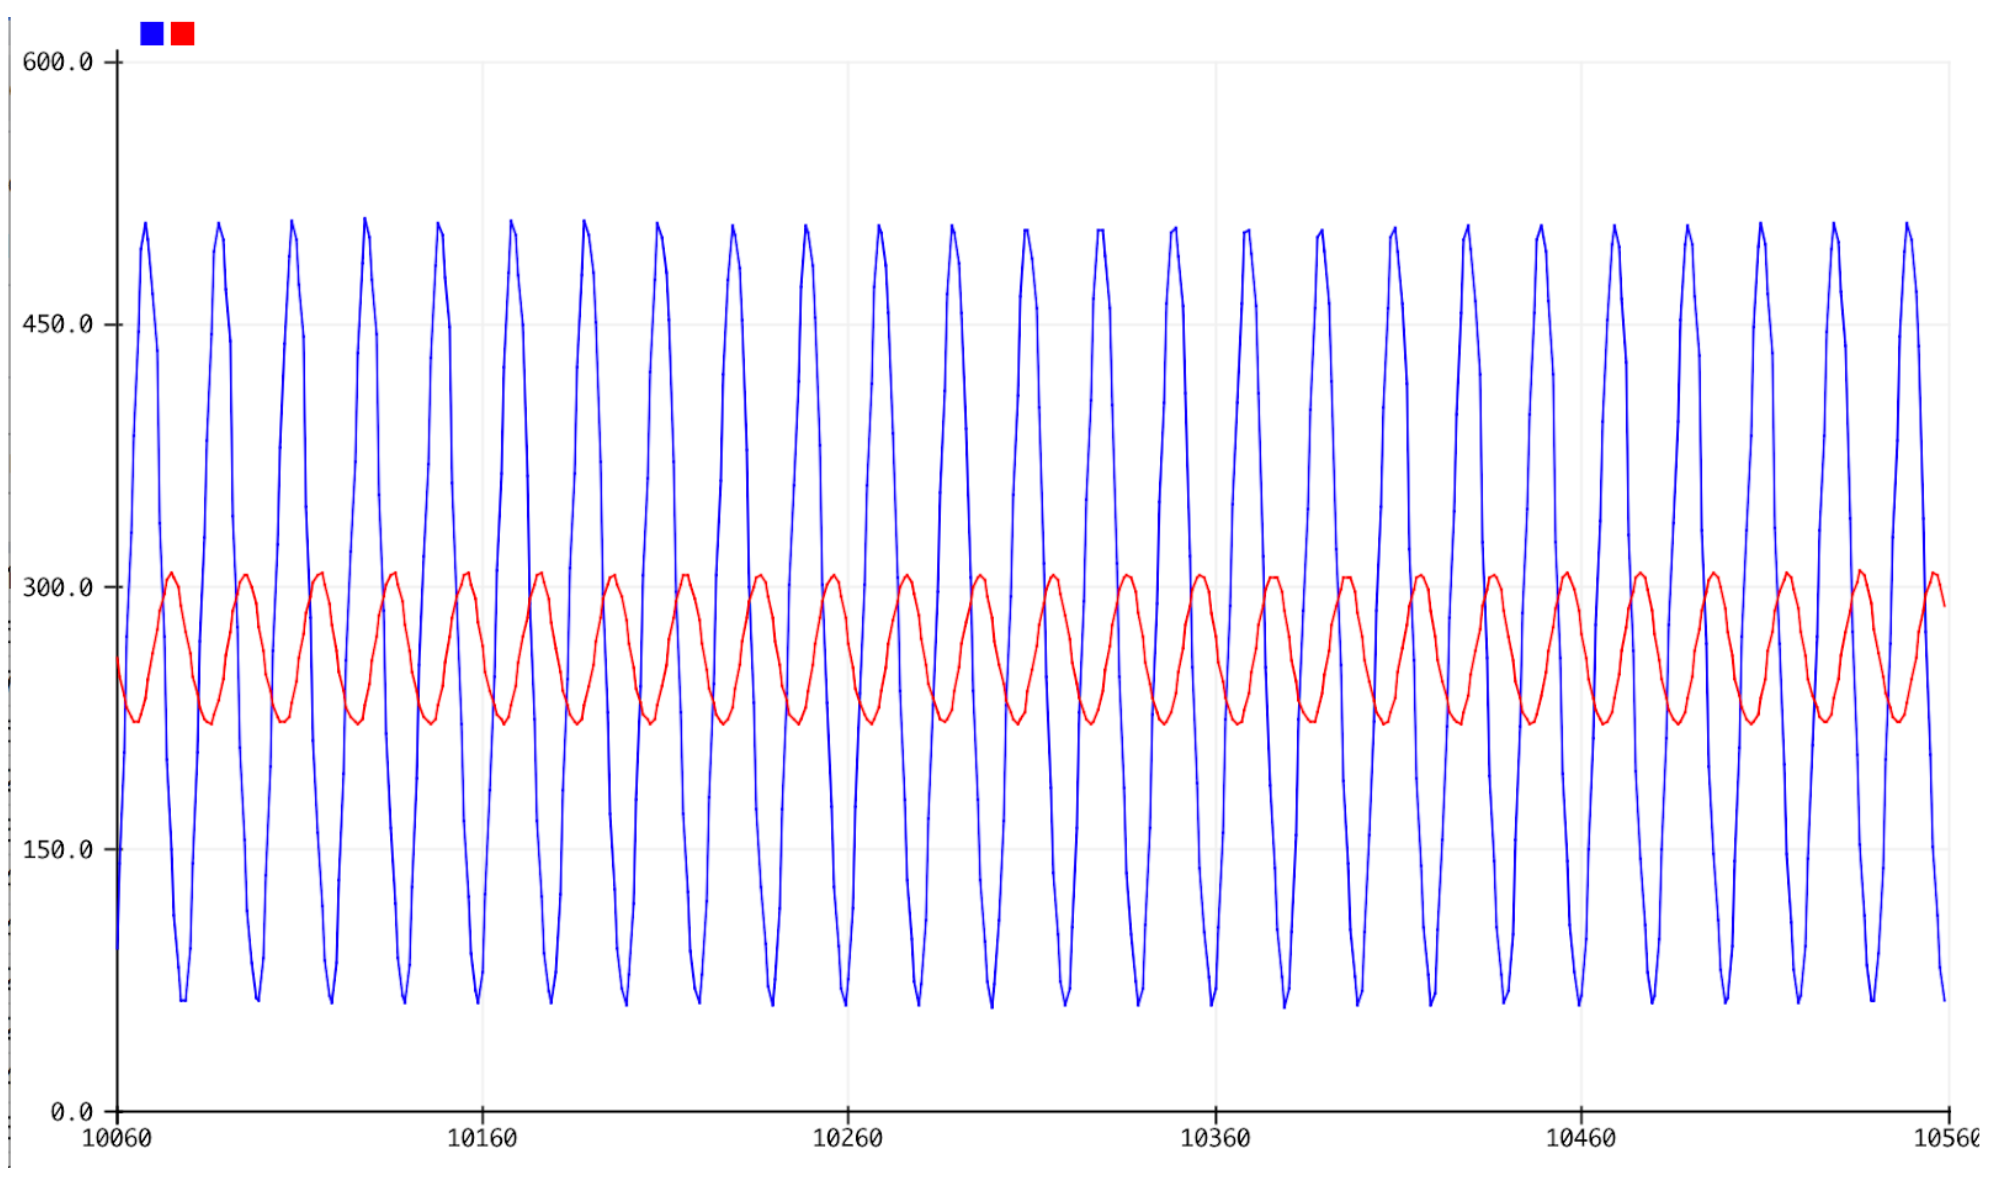
To begin recording data, first make sure your setup is completed as described in Part 1. Make sure that the Amplifier is plugged into a power outlet. Upload your Arduino code to your device by clicking the “Upload” button in the upper right-hand corner. Once that is successfully uploaded, navigate to “Tools” and select the “Serial Monitor.” Make sure that when you open Serial Monitor or Serial Plotter that the baudd number is equal to the baudd number in the code (115200). You will see two columns of data being generated which are the top and bottom accelerometer readings.
Open the MATLAB GUI and choose a driving amplitude for your experiment (we used 0.08 amperes and 0.16 amperes). You will sweep through frequencies 15 - 75 Hz, recording data every 5 Hz (13 sets of data total). Start by setting the driving frequency to 15 Hz and turn on the system by hitting “Turn on system.” This will turn on your speaker, causing the sphere and set up to vibrate up and down. Go back to your Arduino Serial Monitor and hit “Clear Output” to start collecting fresh data. Let this set up run for about 6 seconds, and then unplug the Arduino from your computer. The Serial Monitor will stop recording, allowing you to manually copy and pasting about 4,500-5,000 data entries into a csv file. Split the two columns of data into two separate columns (Columns 1 and 2). Rename this csv “15hz.csv”.
Plug your Arduino back into your computer (making sure to reset the Port) and repeat this process for frequencies 20 Hz, 25 Hz, … 75Hz making sure to follow the naming convention for CSV files. See the technical document for further information on how these files are read by MATLAB.
If you would like to observe the amplitude ratio changes over the frequency sweep, you can additionally use the Arduino Serial Plotter to visually observe this difference.
Process Your Data With the MATLAB Code
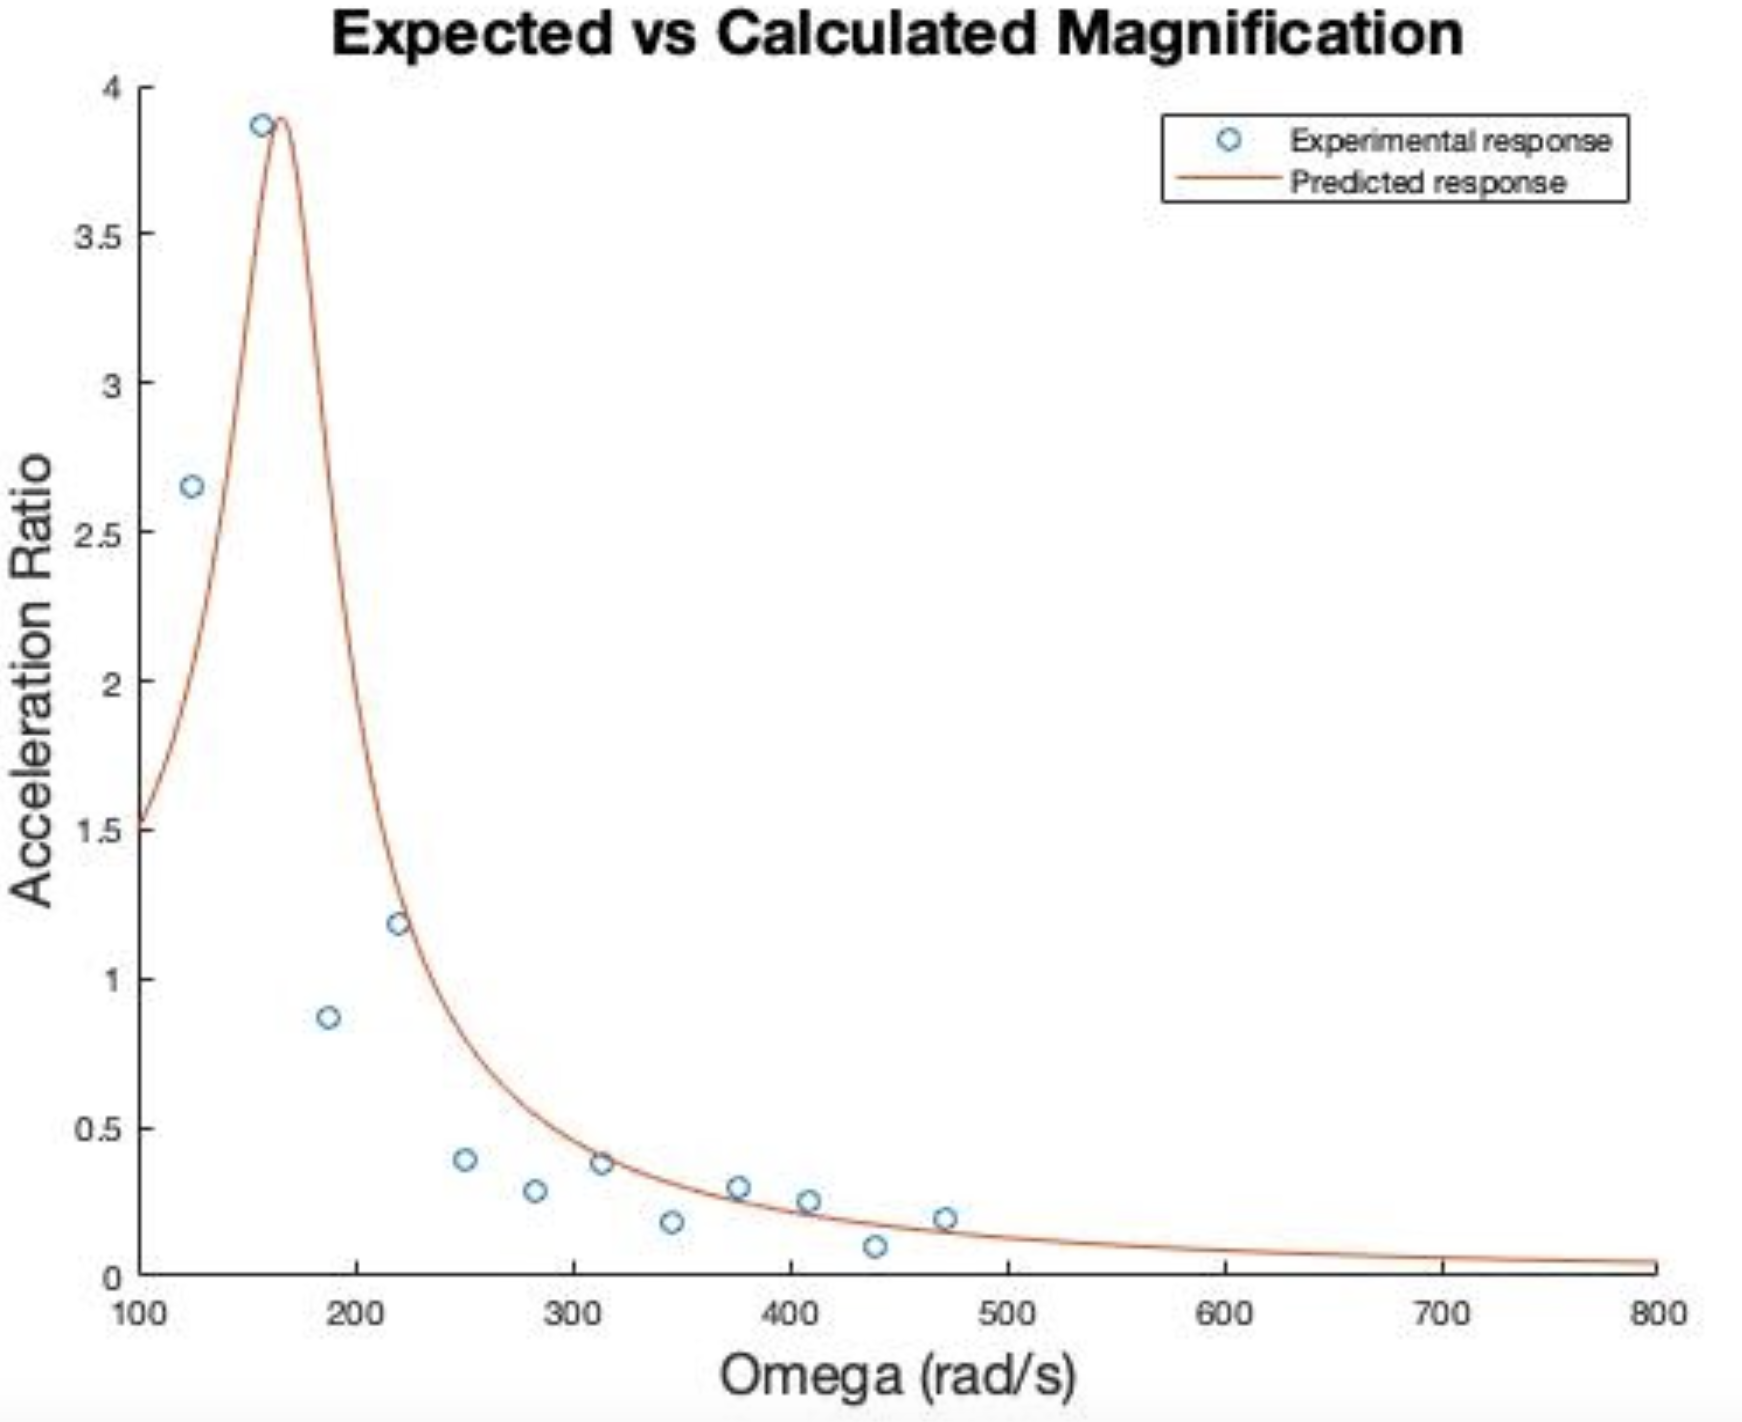
Once experimental data is obtained in the form of CSV files, the next step is to use our provided code to process the data. For detailed instructions on using the code and for an explanation of the underlying mathematics, see our technical document. The goal is to obtain the amplitude of acceleration for the top and bottom accelerometer, then to calculate the ratio of the bottom amplitude to the top amplitude. This ratio is calculated for each driving frequency. The ratios are then plotted as a function of driving frequency.
Once this plot is obtained, another set of code (again detailed in the technical document) is used to determine the fluid viscosity. This code requires the user to input an initial guess for the viscosity, and it is essential that this initial guess is lower than the actual viscosity, so make sure to guess a very low viscosity otherwise the code will not work properly. Once the code has found a viscosity that matches the experimental data, it will generate a plot like the one shown below and will show the final viscosity value. Congratulations on completing the experiment!
Files
Alternatively:
https://drive.google.com/file/d/1mqTwCACTO5cjDKdUSCUUhqhT9K6QMigC/view?usp=sharing