Live IoT Traffic Monitor Dashboard Using Node Red and Radar Sensor
by THX1138_houdini in Circuits > Sensors
3323 Views, 1 Favorites, 0 Comments
Live IoT Traffic Monitor Dashboard Using Node Red and Radar Sensor
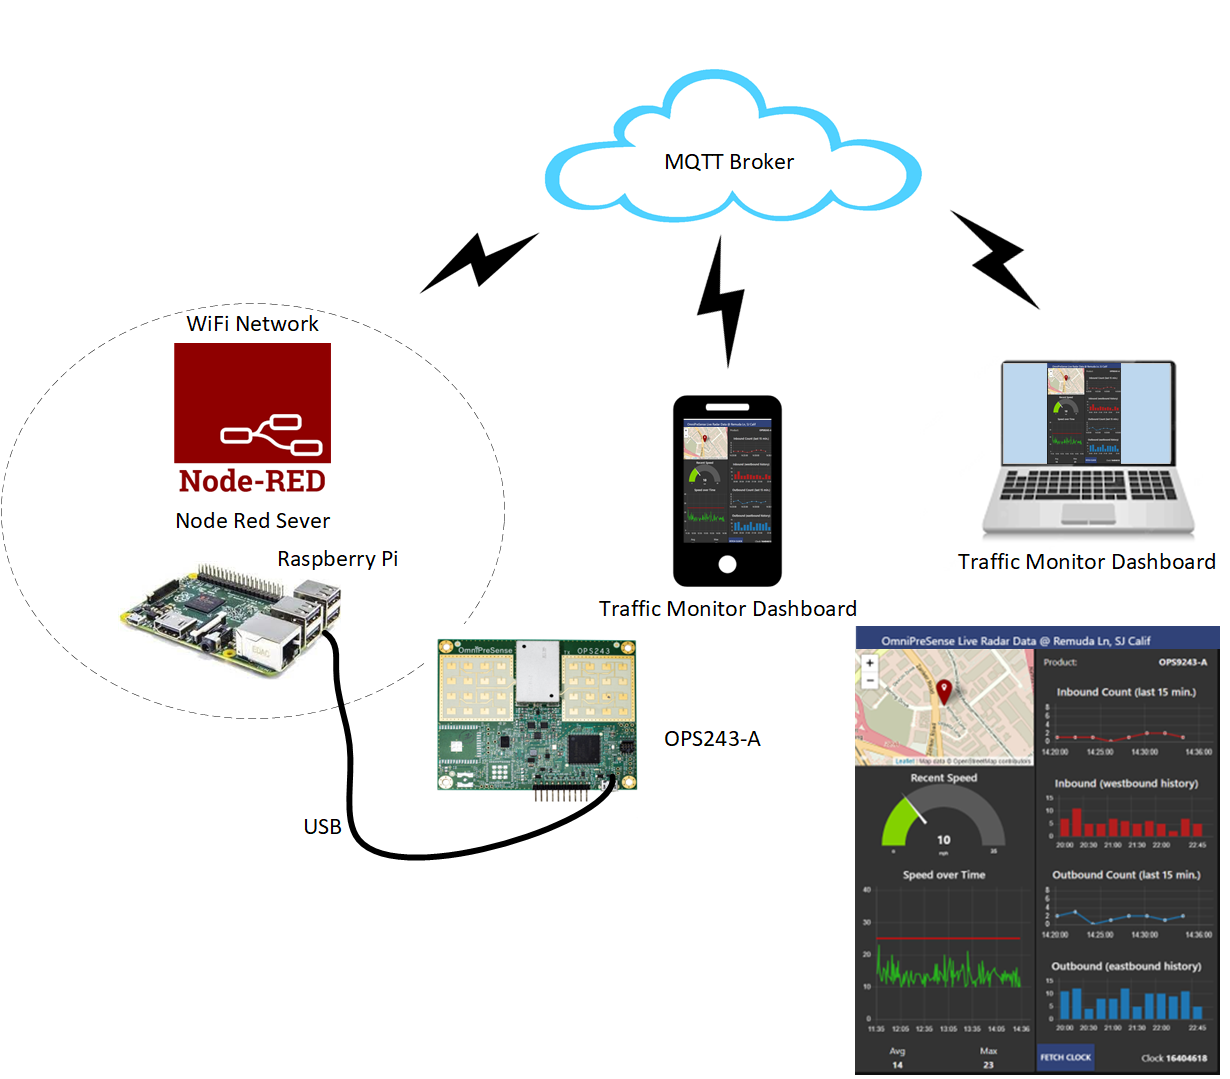
The following describes how to build a remote traffic monitor dashboard using Node Red and an OmniPreSense radar sensor. The dashboard can be viewed remotely via the internet to monitor live traffic speeds and counts. The dashboard consists of a location map, live speedometer, historical speeds over last 3 hours, average speed, maximum speed, and vehicle counts for each direction. A live traffic monitor dashboard implementation is available for viewing here. A variation of the design can eliminate the Raspberry Pi, simplifying the design with a WiFi enabled radar sensor.
Supplies
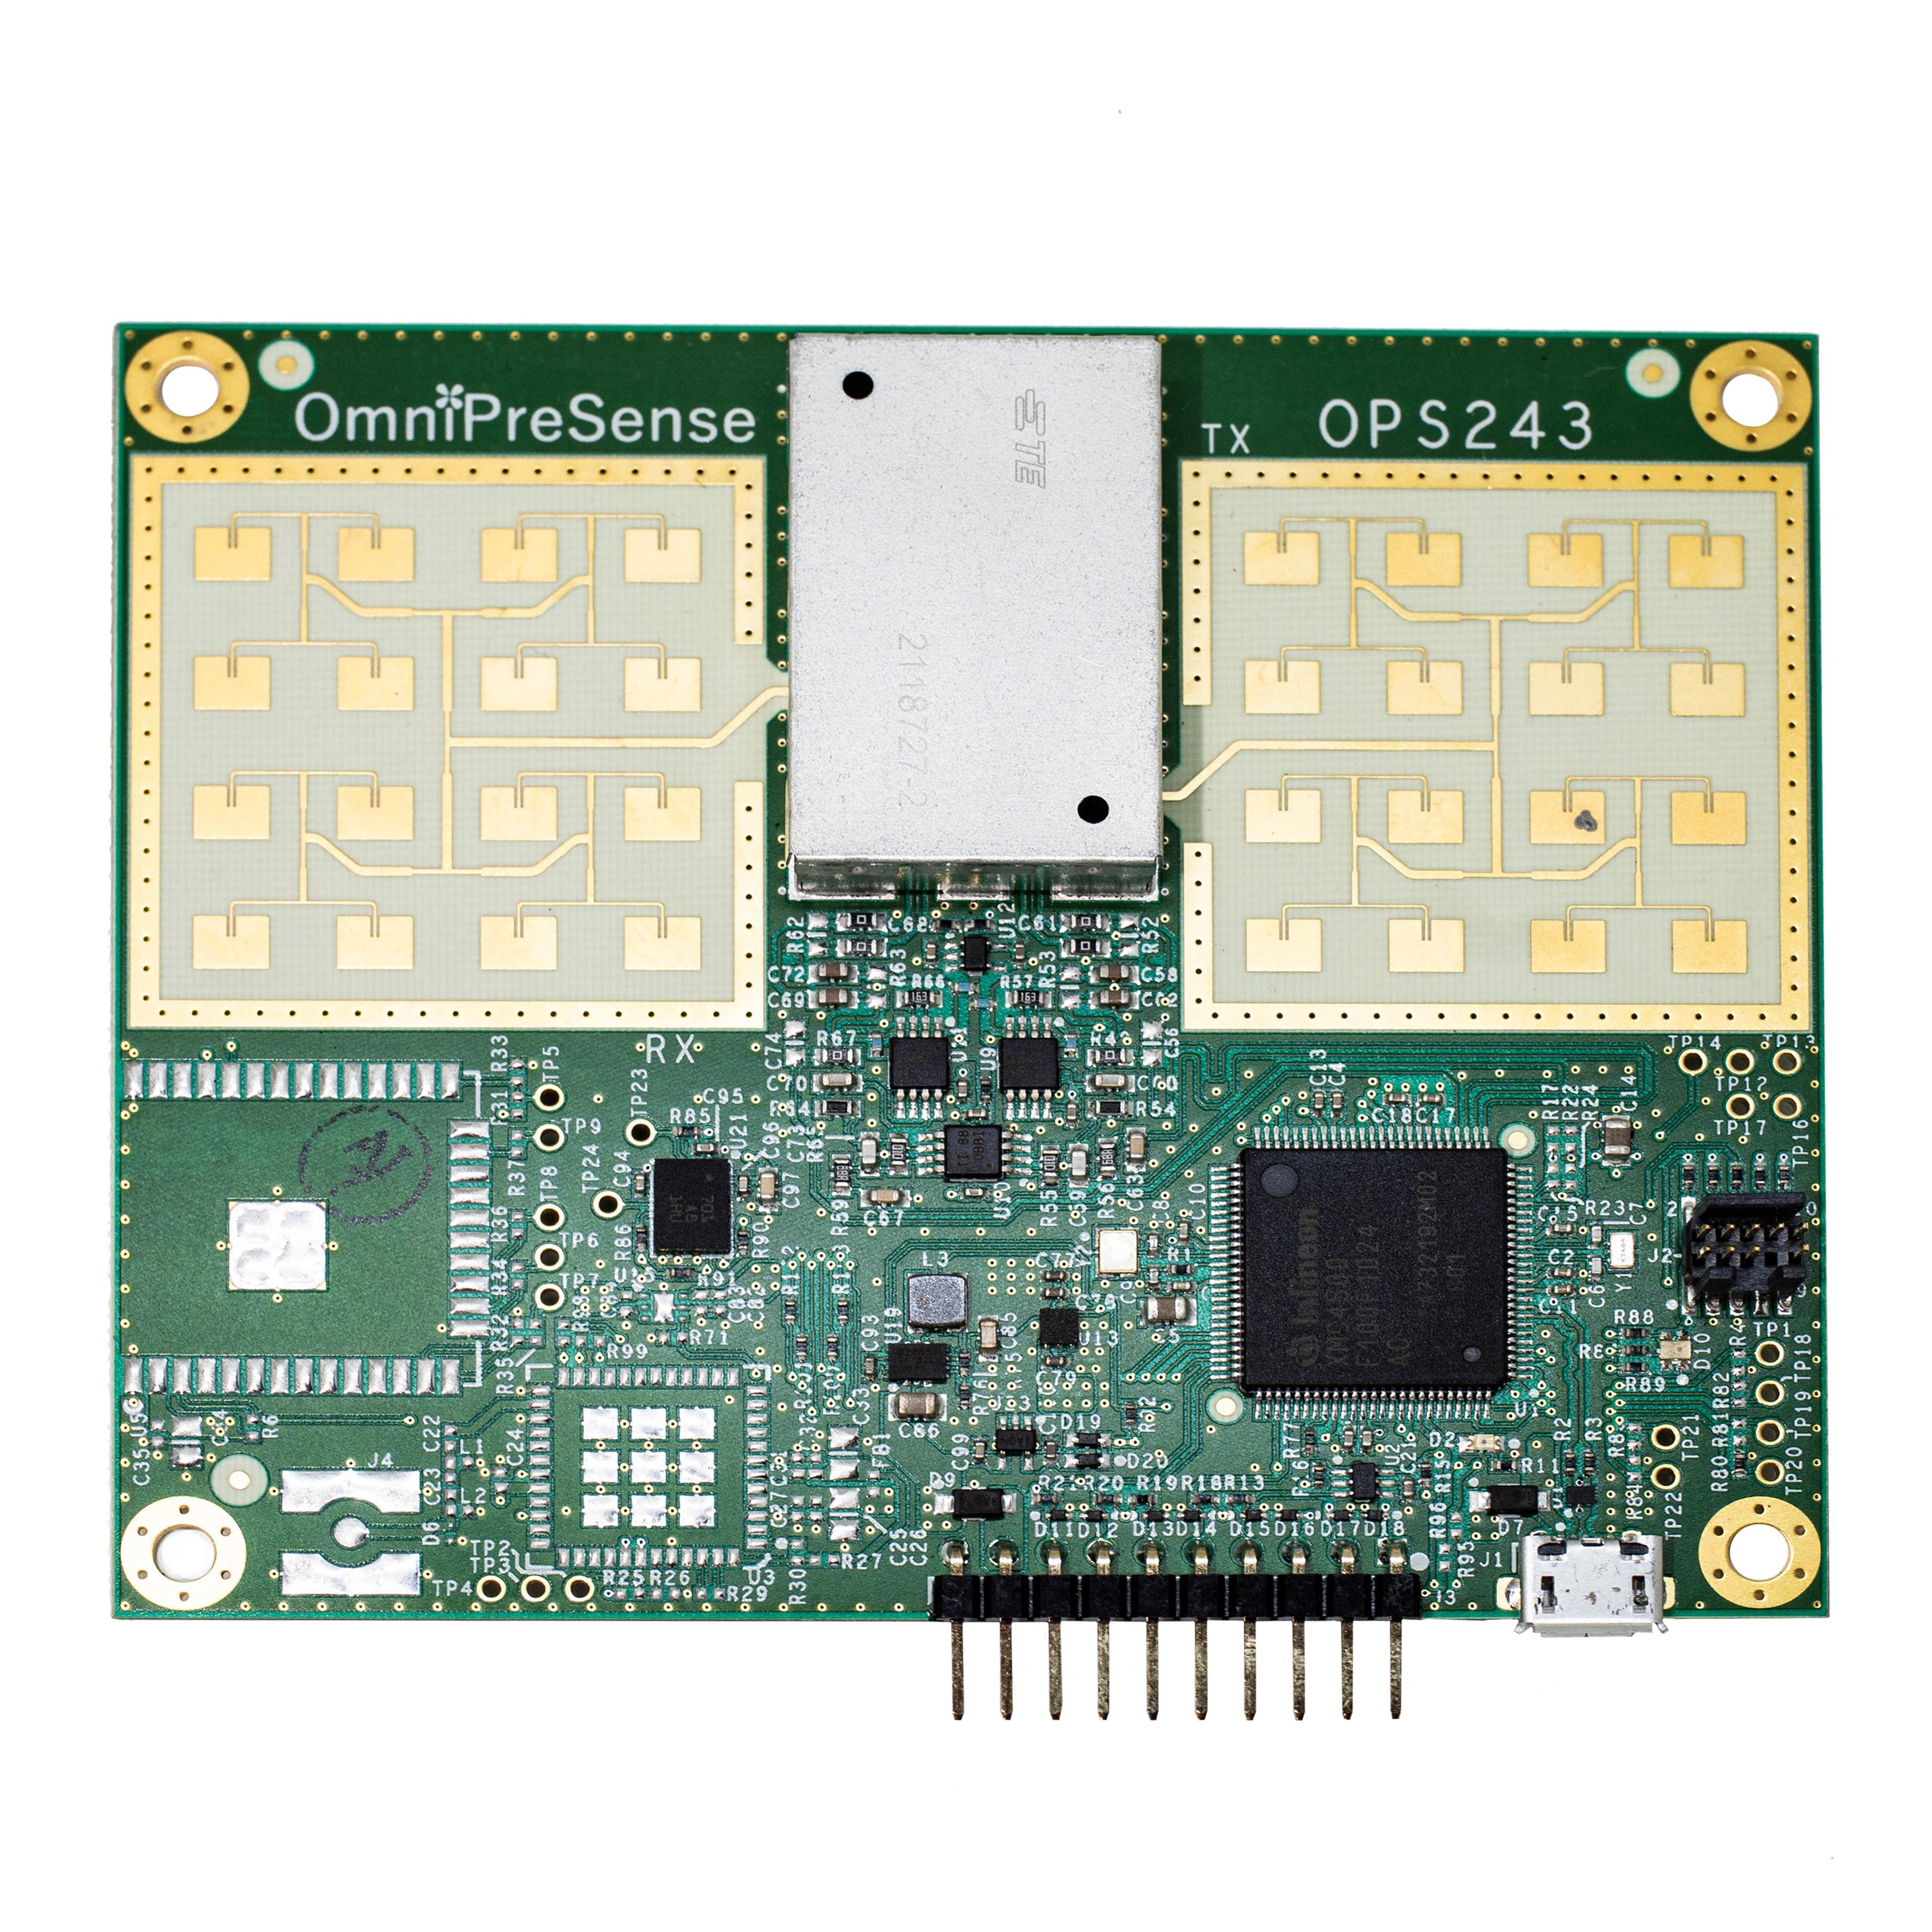
OmniPreSense OPS243-A Radar Sensor
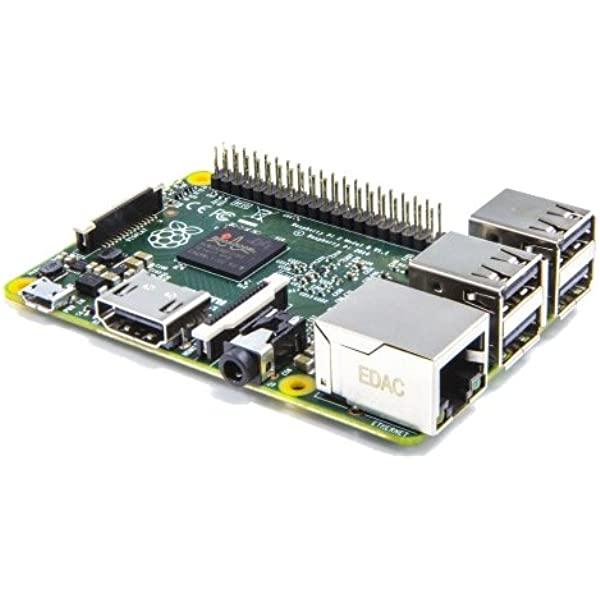
Raspberry Pi
USB Micro Cable
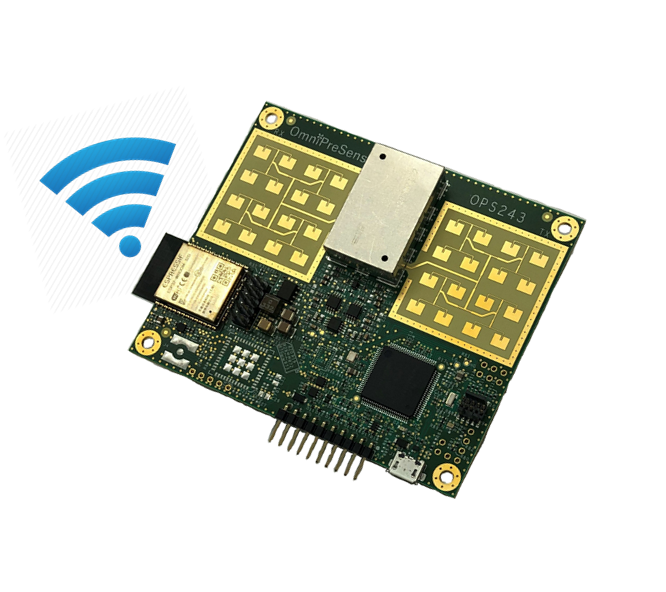
OmniPreSense OPS243-A Radar Sensor with WiFi Interface (optional)
Install Node Red on Raspberry Pi
Raspberry Pi generally already have Node Red installed if using the Raspian OS but if not, you'll need to install it. We won't go into the details of installing Node Red but here's helpful links:
Configure OPS243-A Radar Sensor
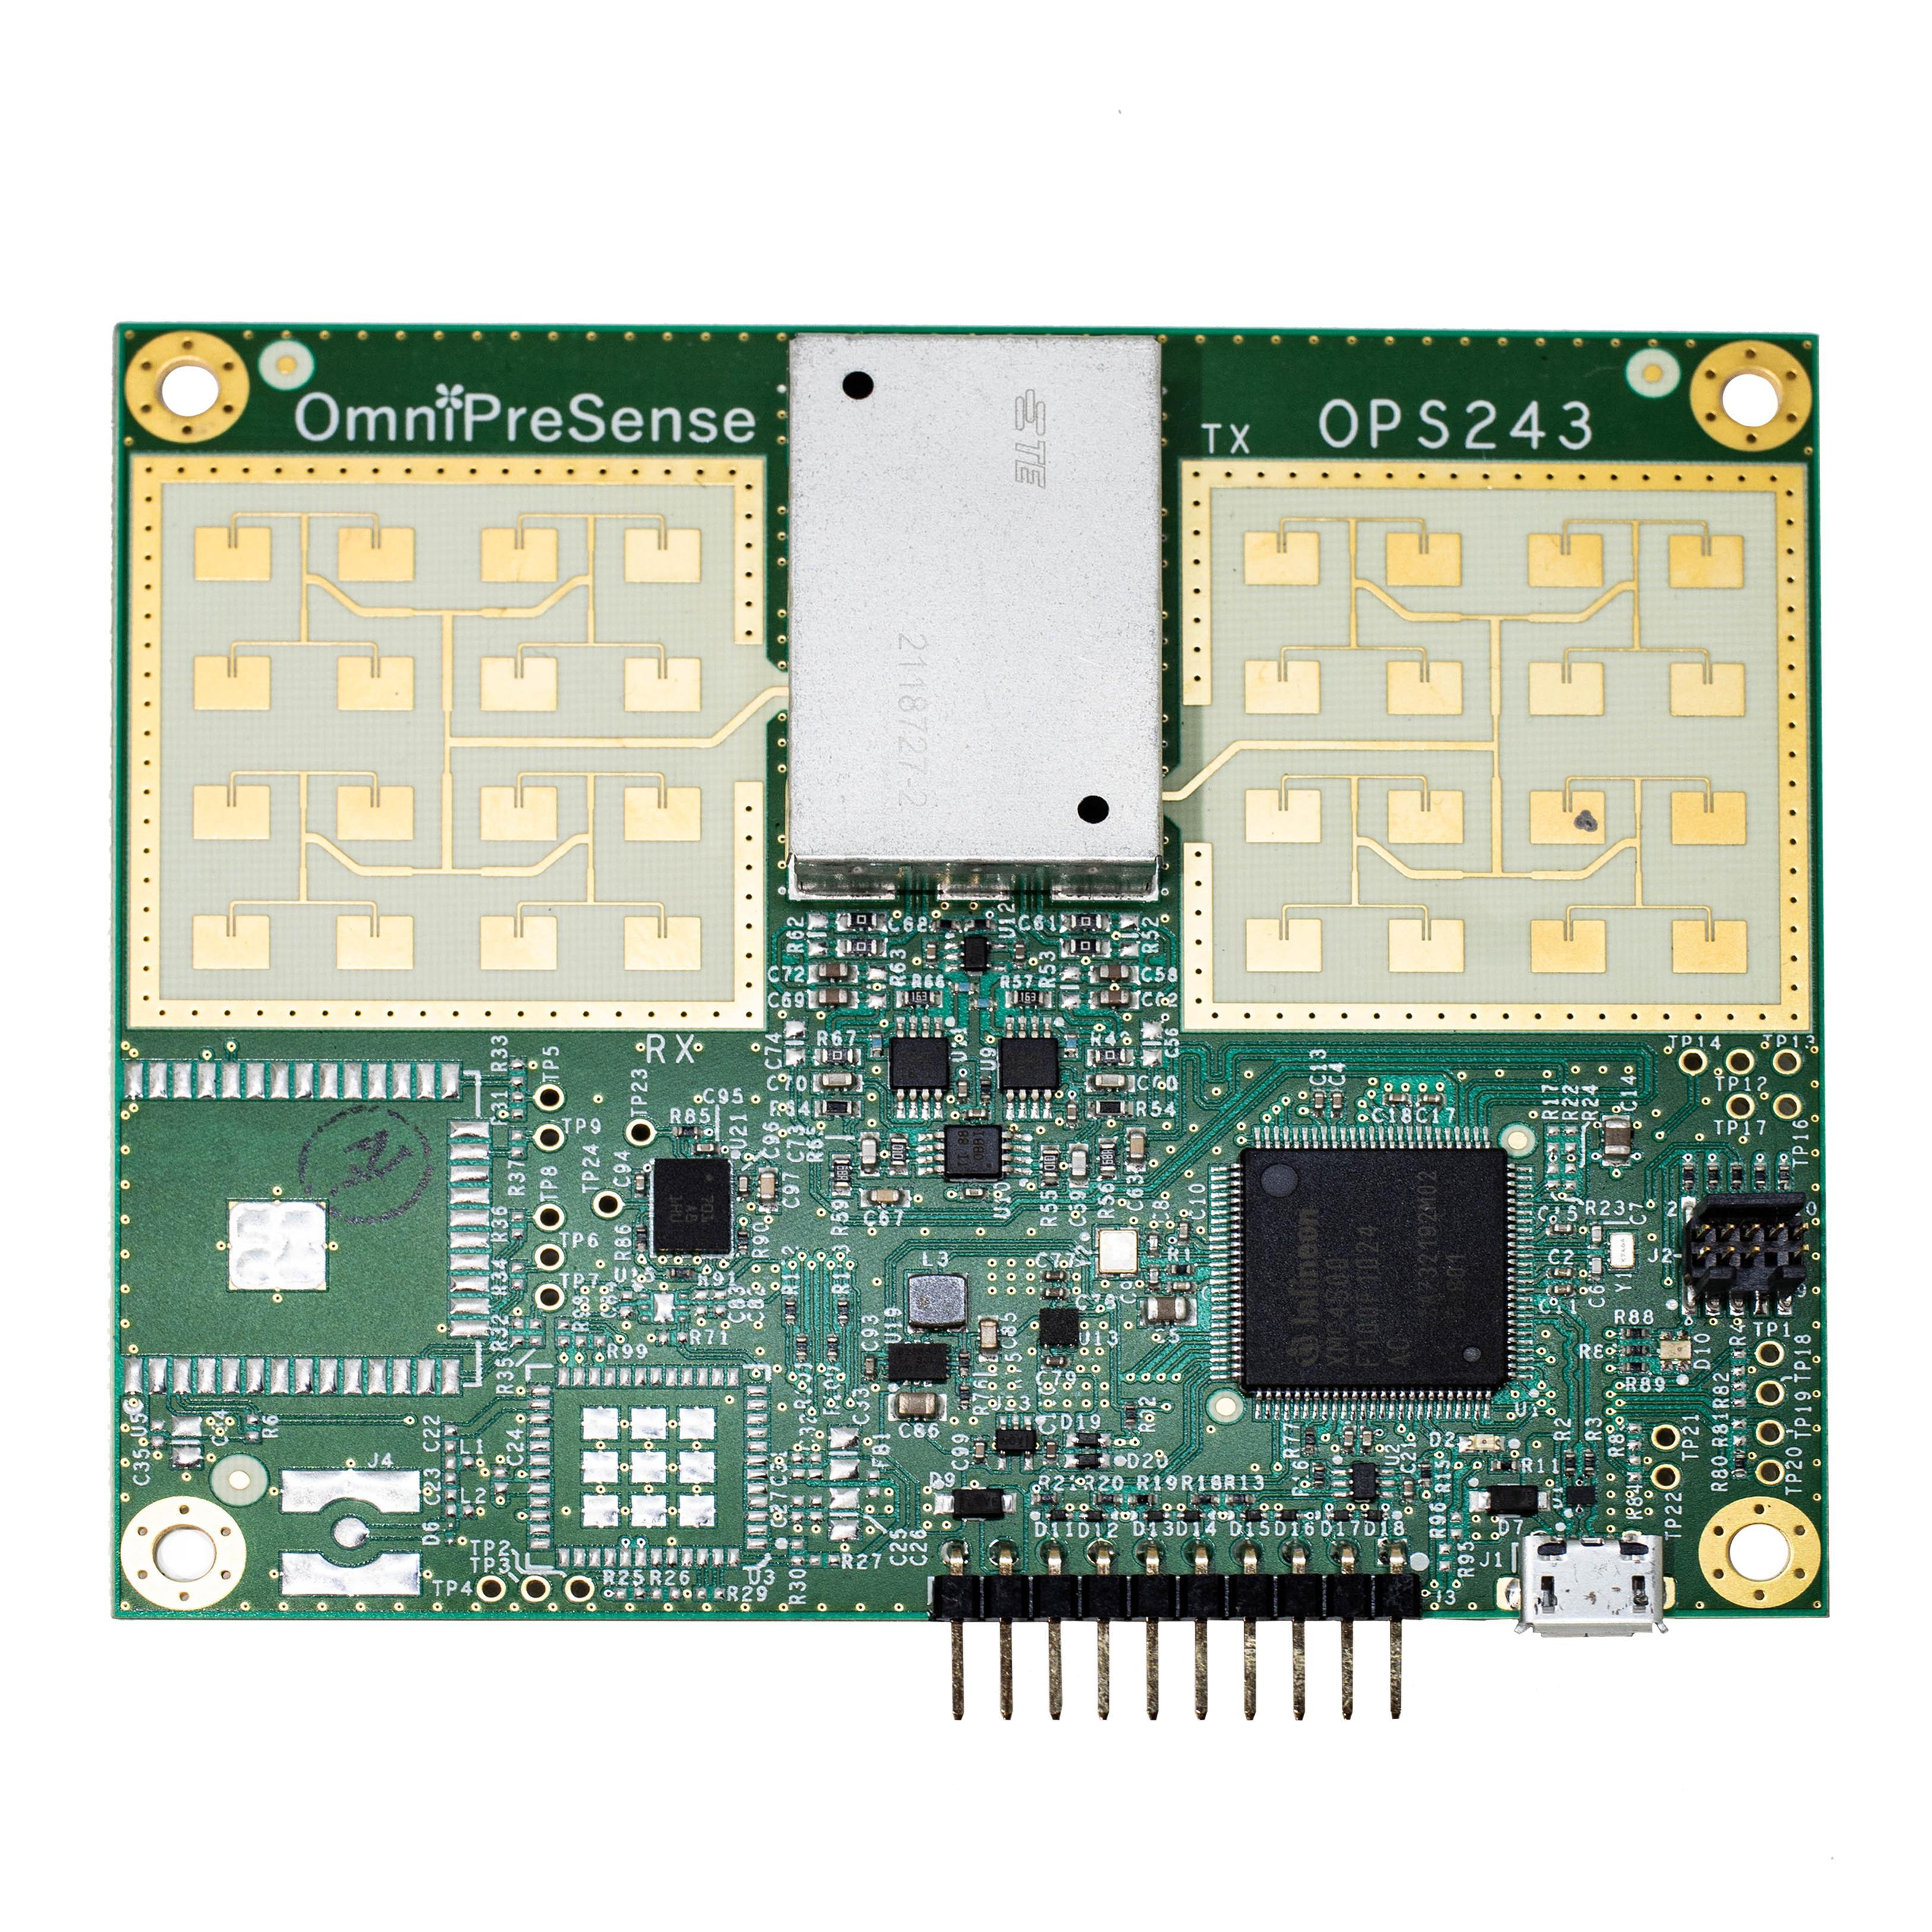
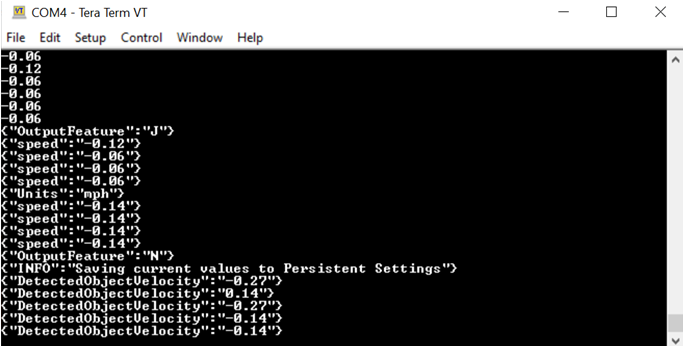
The OPS243-A sensor is a single board Doppler radar capable of detecting vehicles up to 100m/328 ft. away. For this application, we want the sensor to output data in JSON format to allow parsing by Node Red. To do this, connect your OPS243-A to your PC and open up a terminal program like Tera Term or Putty. Make sure to select a serial port connection. A simple wave of the hand above the sensor should provide readings such as 0.6 which is 0.6 m/s speed detected. You will also see negative speeds (ex. -1.8) which means your hand is moving away at 1.8 m/s from the sensor. We'll use this information to count vehicles in each direction.
For configuring your sensor to JSON mode, type the command OJ into the terminal window. You'll now see the speed reports from a hand wave looking like {"speed":"-0.12"}
To change the speed reports from m/s to mph, type the US command ({"units":"mph"} response). If km/h is desired, type UK command.
An OPS243-A mode, Detected Object, monitors for vehicles detected and reports only a single speed for the vehicle. The Node Red flow will use this information to parse speed data from other data. Type ON to turn on the Detected Object mode ({"OutputFeature":"N"} response)
Finally, save these commands to persistent memory with the A! command. You should see the response {"INFO":"Saving current values to Persistent Settings"}. This way the sensor will always power up or come out of reset with JSON, mph, and Detected Object mode settings configured.
Connect OPS243-A Radar Sensor to Raspberry Pi
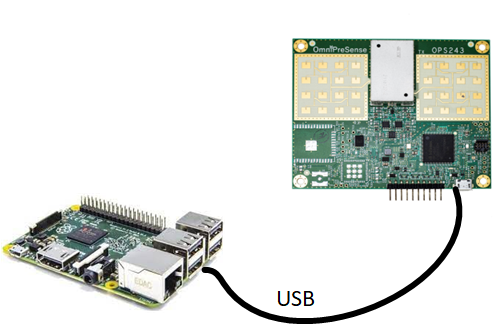
Next, connect the OPS243-A to the Raspberry Pi via USB. You should use a Raspberry Pi with standard USB Type-A ports and you'll need a USB micro cable. The USB will provide power to the radar sensor and be used for data communication. Make sure the Raspberry Pi is powered by a large enough power supply or current source. The OPS243-A will draw around 1.7W and the Raspberry Pi around 4W (Pi 4). We recommend a 10W (2A/5V) power source. At the very end of this project you'll want to mount the sensor and Raspberry Pi in a location that can see the traffic. Keep that in mind along with the enclosure and powering the solution when selecting the USB cable.
Load Node Red Traffic Monitor Flow
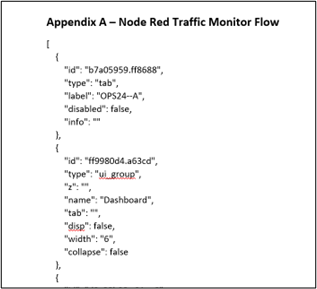
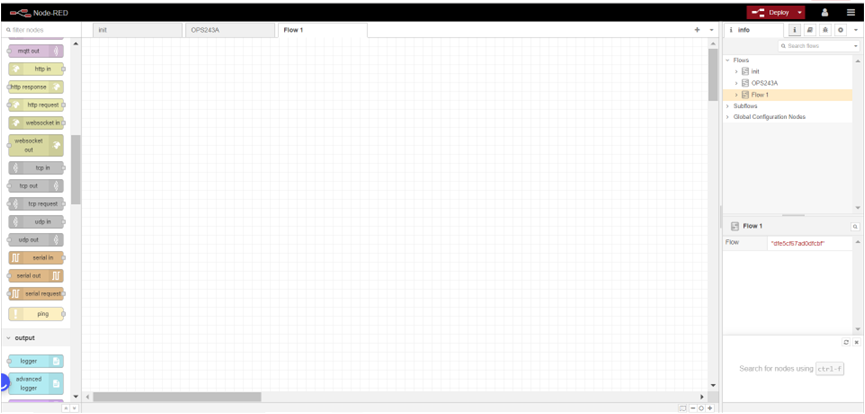
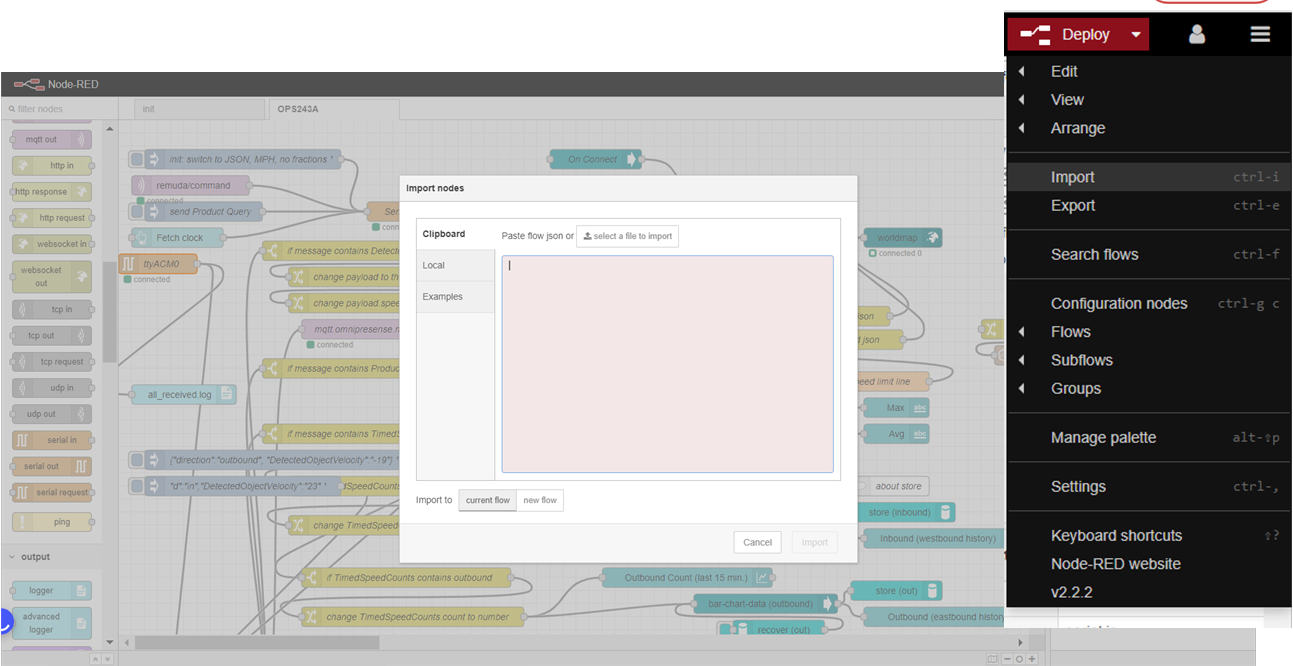
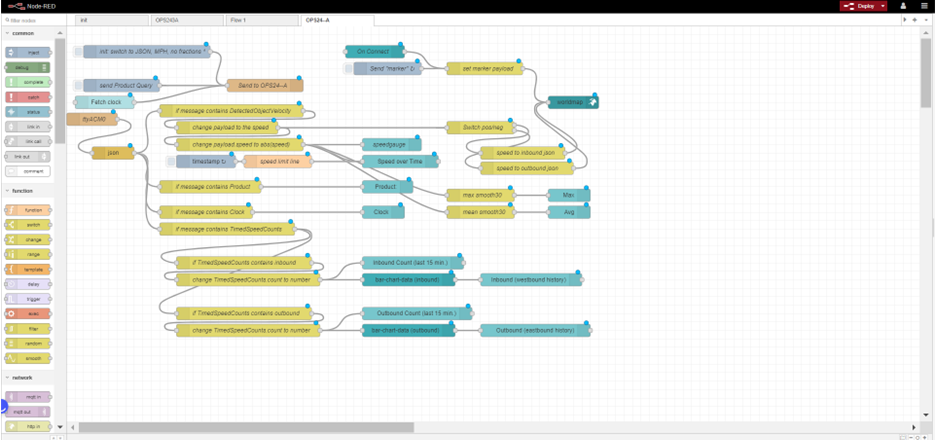
Node Red is a simple development tool for visual programming by wiring together hardware, APIs, and online services for Internet of Things (IoT) applications. A browser-based flow editor is used and utilizes JavaScript functions. Node Red utilizes Node.js and flows created are stored in JSON format. The complete traffic monitor flow is provided here and a simple import of the flow brings it up ready to modify for your use.
First, start Node Red by typing node-red from the Command Line terminal. This starts Node Red and you can now bring up the visual dashboard to create flows. Go to your browser and start a new page with address: http://localhost:1880. This will bring up the dashboard.
On the left of the dashboard are the nodes that are used to create a flow. We'll skip doing this manually and import the traffic monitor flow already created. Go to the upper right and select the three bars and Import command. Then scroll to select the flow provided here.
Once this is done, you may have an error message for nodes that are not recognized. There are several nodes not in the default palette. These nodes will need to be installed which we'll do in the next step.
Add Nodes to Node Red Via Palette Manager
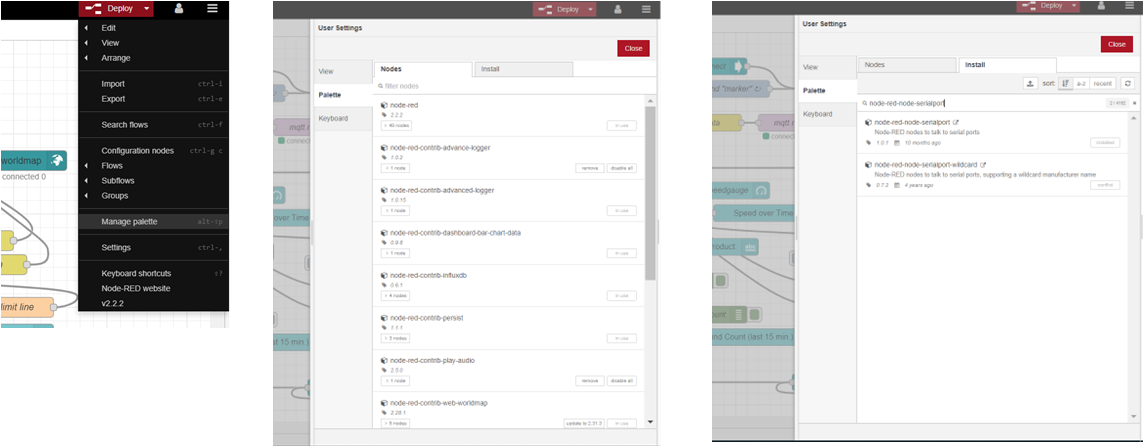
There are several nodes used in the Traffic Monitor dashboard which are not part of the standard node palette on the left side of the Node Red dashboard. You'll need to add these nodes. Select "Manage palette" from the right side pull-down menu. A new list will appear on the right with tabs labeled Nodes and Install. Select the Install tab to search for the nodes to install. The list of nodes to install are:
- node-red-node-serialport
- node-red-contrib-dashboard-bar-chart-data
- node-red-node-smooth
- node-red-contrib-web-worldmap
Search for each of these and then install them into your node palette.
Configure Serial in Node
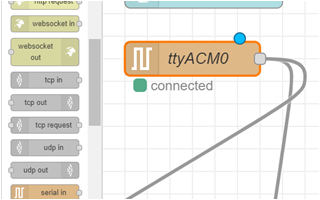
The flow takes the data from the sensor and parses it to the appropriate chart. The OPS243-A output should be in JSON mode. The main node that reads the data from the sensor is the serial in node. You configure it to read the USB connection as a serial port. Double click on the node and you'll see the configuration information /dev/ttyACM0:19200-8N1 listed. This says read from the serial port at 19,200 baud. If your serial port has a different name than ACM0, change it here.
Once this is done, hit the Deploy button in the upper right corner of the dashboard.
Additional Node Configurations
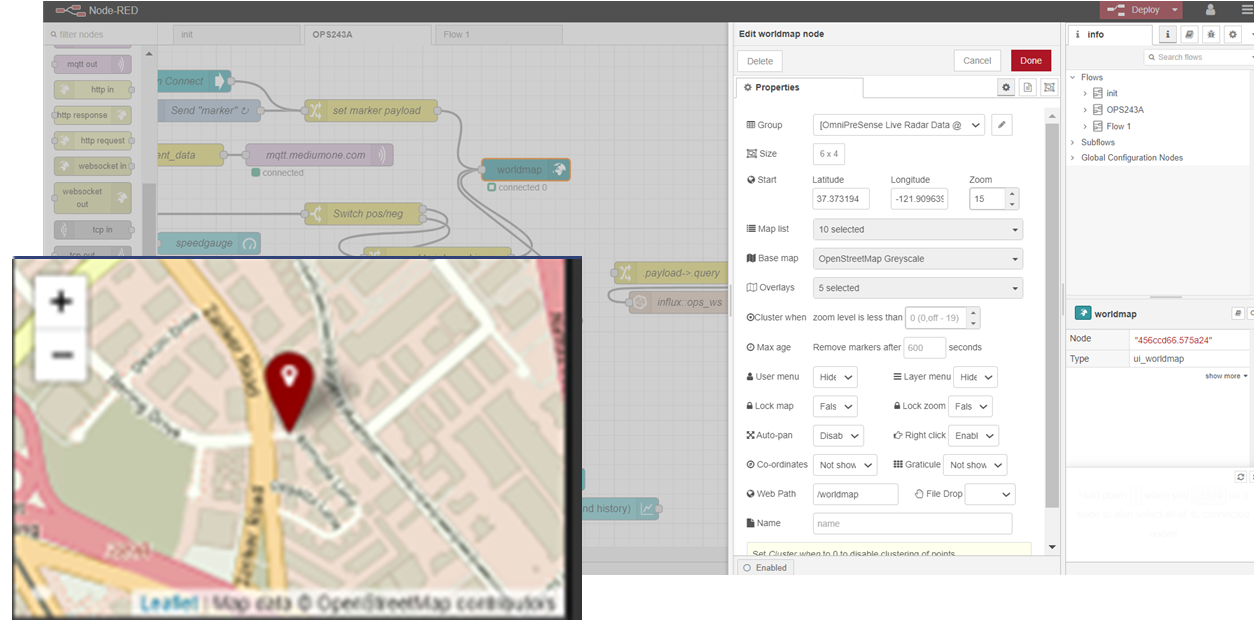
There are additional nodes which can be configured for your specific application. A small map is used to show the location of the sensor. Double click the worldmap node to input the longitude and latitude of the sensor. This will show were the sensor is placed and a marker will appear when a vehicle speed is detected.
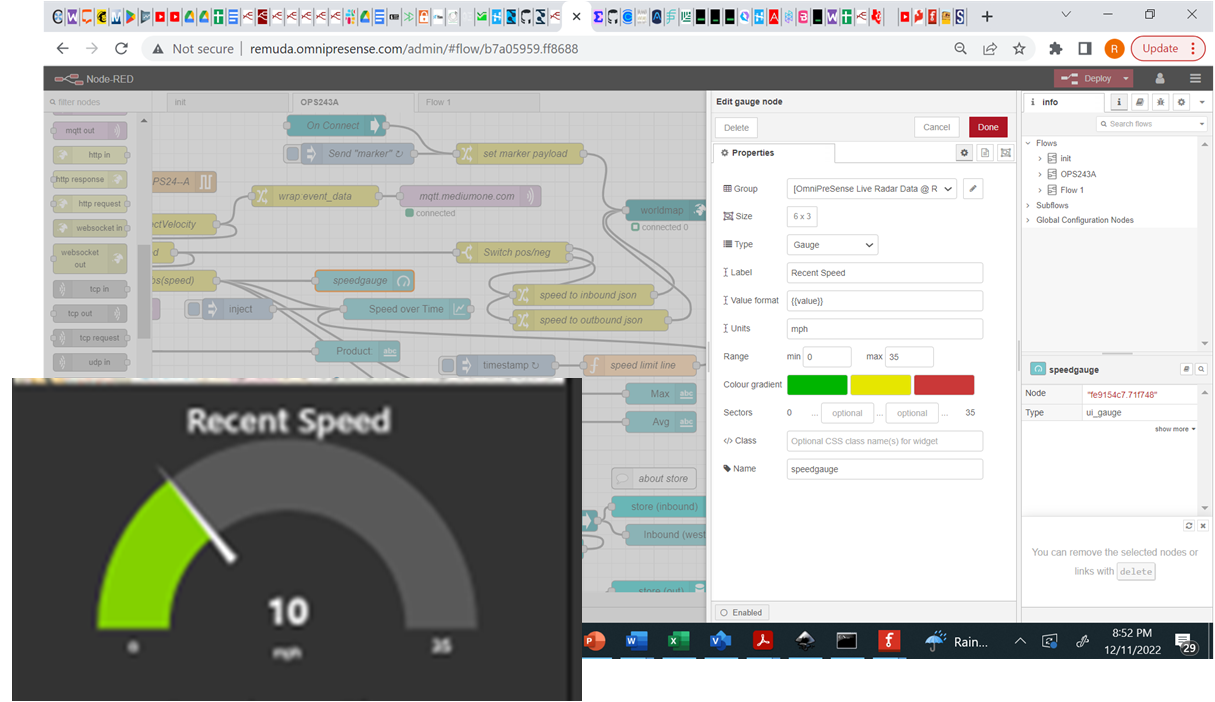
A speedometer shows the speed of the most recently detected vehicle and uses the speedguage node. The default maximum speed is 35mph. Double clicking on the speedometer node allows you to configure the maximum speed you expect in your location.
After making any changes to the nodes, make sure to hit the Deploy button in the upper right.
View Traffic Monitor Dashboard
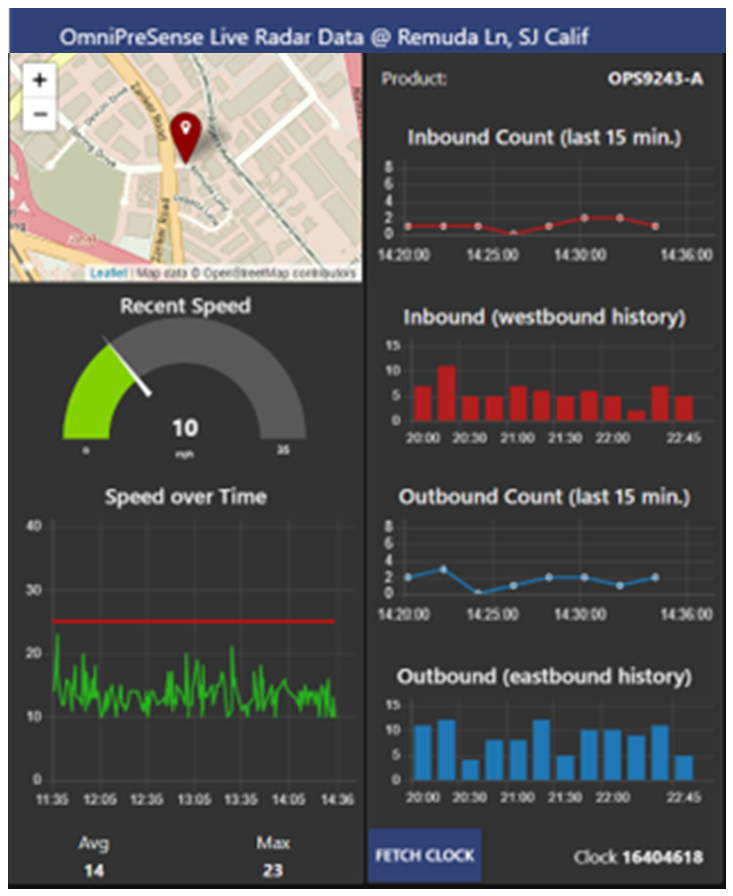
When you're done configuring the traffic monitor dashboard, you can Deploy it so it's viewable. The OPS243-A sensor should still be connected to your Raspberry Pi. To see the dashboard in action, open a new browser page with the address http://localhost:1880/ui. You'll now be able to see the dashboard and any speed detected by the sensor will be reported on the dashboard. A simple hand wave above the sensor is a good test.
Mount Sensor to View Traffic
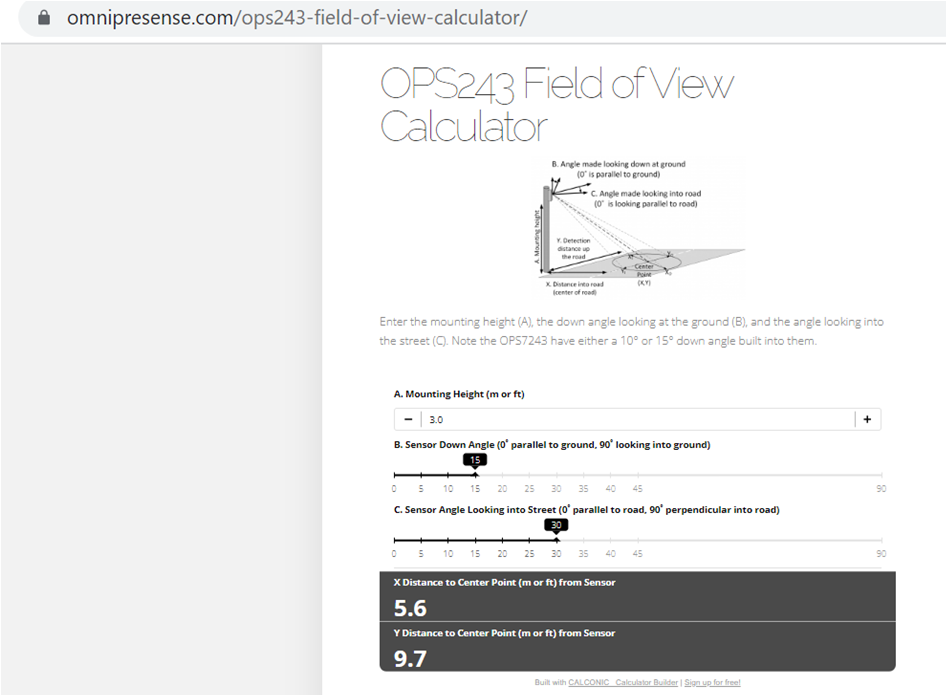
With the sensor configured and displaying the dashboard, you'll want to mount the sensor so it can view the traffic. The goal is to have the sensor field of view focused at the center of the lane or lanes to be detected. OmniPreSense provides an online field of view calculator to help determine the sensor field of view center point based on its height, down angle, and angle looking into the street. It has an additional application note providing guidance on mounting sensors for traffic monitoring applications.
Being an outdoor sensor, you'll want to use an enclosure for the OPS243-A and Raspberry Pi that is water proof and allows the radar to operate properly. Any plastic enclosure (ABS, Nylon, etc.) will work. The radar signals can go through the plastic. It's suggested to have a plastic thickness 3-6mm and provide a gap of 10mm from the plastic and the top of the radar sensor. Make sure to keep any metal away from the on-board patch antennas. A good source is Bud Industries.
Viewable Traffic Dashboard Anywhere in the Internet
Once mounted in the desired location, you may want to make the dashboard viewable by anyone on the internet or just the convenience of viewing the dashboard remotely yourself. To do this you'll need to open up access to the Raspberry Pi on your WiFi network. There's various methods to do this such as port forwarding which we won't go into the details here as this may present a security risk. An alternative and simpler approach is to use a WiFi enabled sensor as described below.
OPS243-A WiFi Sensor and Removal of Raspberry Pi
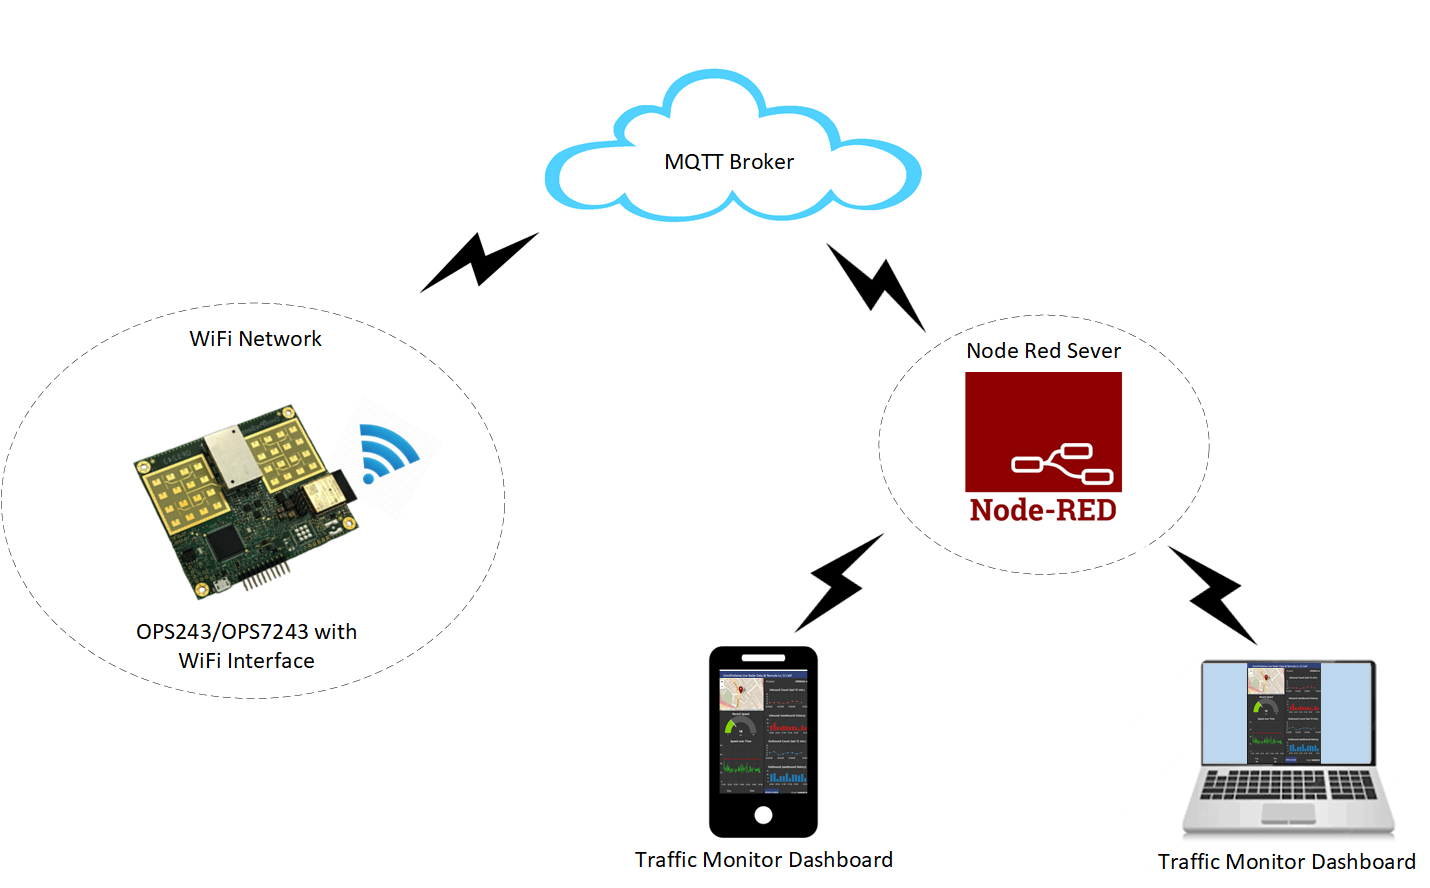
For remote access or if you'd like to remove the cost, size, and power of the Raspberry Pi, you can optionally use the OPS243-A WiFi sensor. This sensor can send speed data directly to the cloud and just needs power and a connection to a WiFi network.
To use the sensor, configure its output the same as described in Step 2 above.
Next, mount the sensor in the desired location and within range of the desired WiFi network.
Download the Android app from OmniPreSense on the Google Playstore here. Use the app to detect the sensor and provide it with the WiFi network to connect to and password if required. The data from the sensor will now flow to the cloud via MQTT.
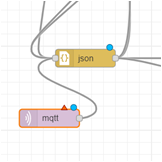
Set up the Node Red traffic monitor flow as described above. But add a new node, an mqtt in node. This node will feed into the JSON node in the existing flow just like the serial in node. You connect the mqtt in node's output to the JSON node input with a connection line. The mqtt in node requires several pieces of information to make a connection including a username and password. Contact OmniPreSense customer service to request the information for your particular sensor. Double clicking on the mqtt in node provides the configuration screen to the right. Once configured, you should see the speed data from vehicles on your dashboard.