Laser Cut Street Map Ornaments
by deelstradesigns in Living > Christmas
12551 Views, 164 Favorites, 0 Comments
Laser Cut Street Map Ornaments
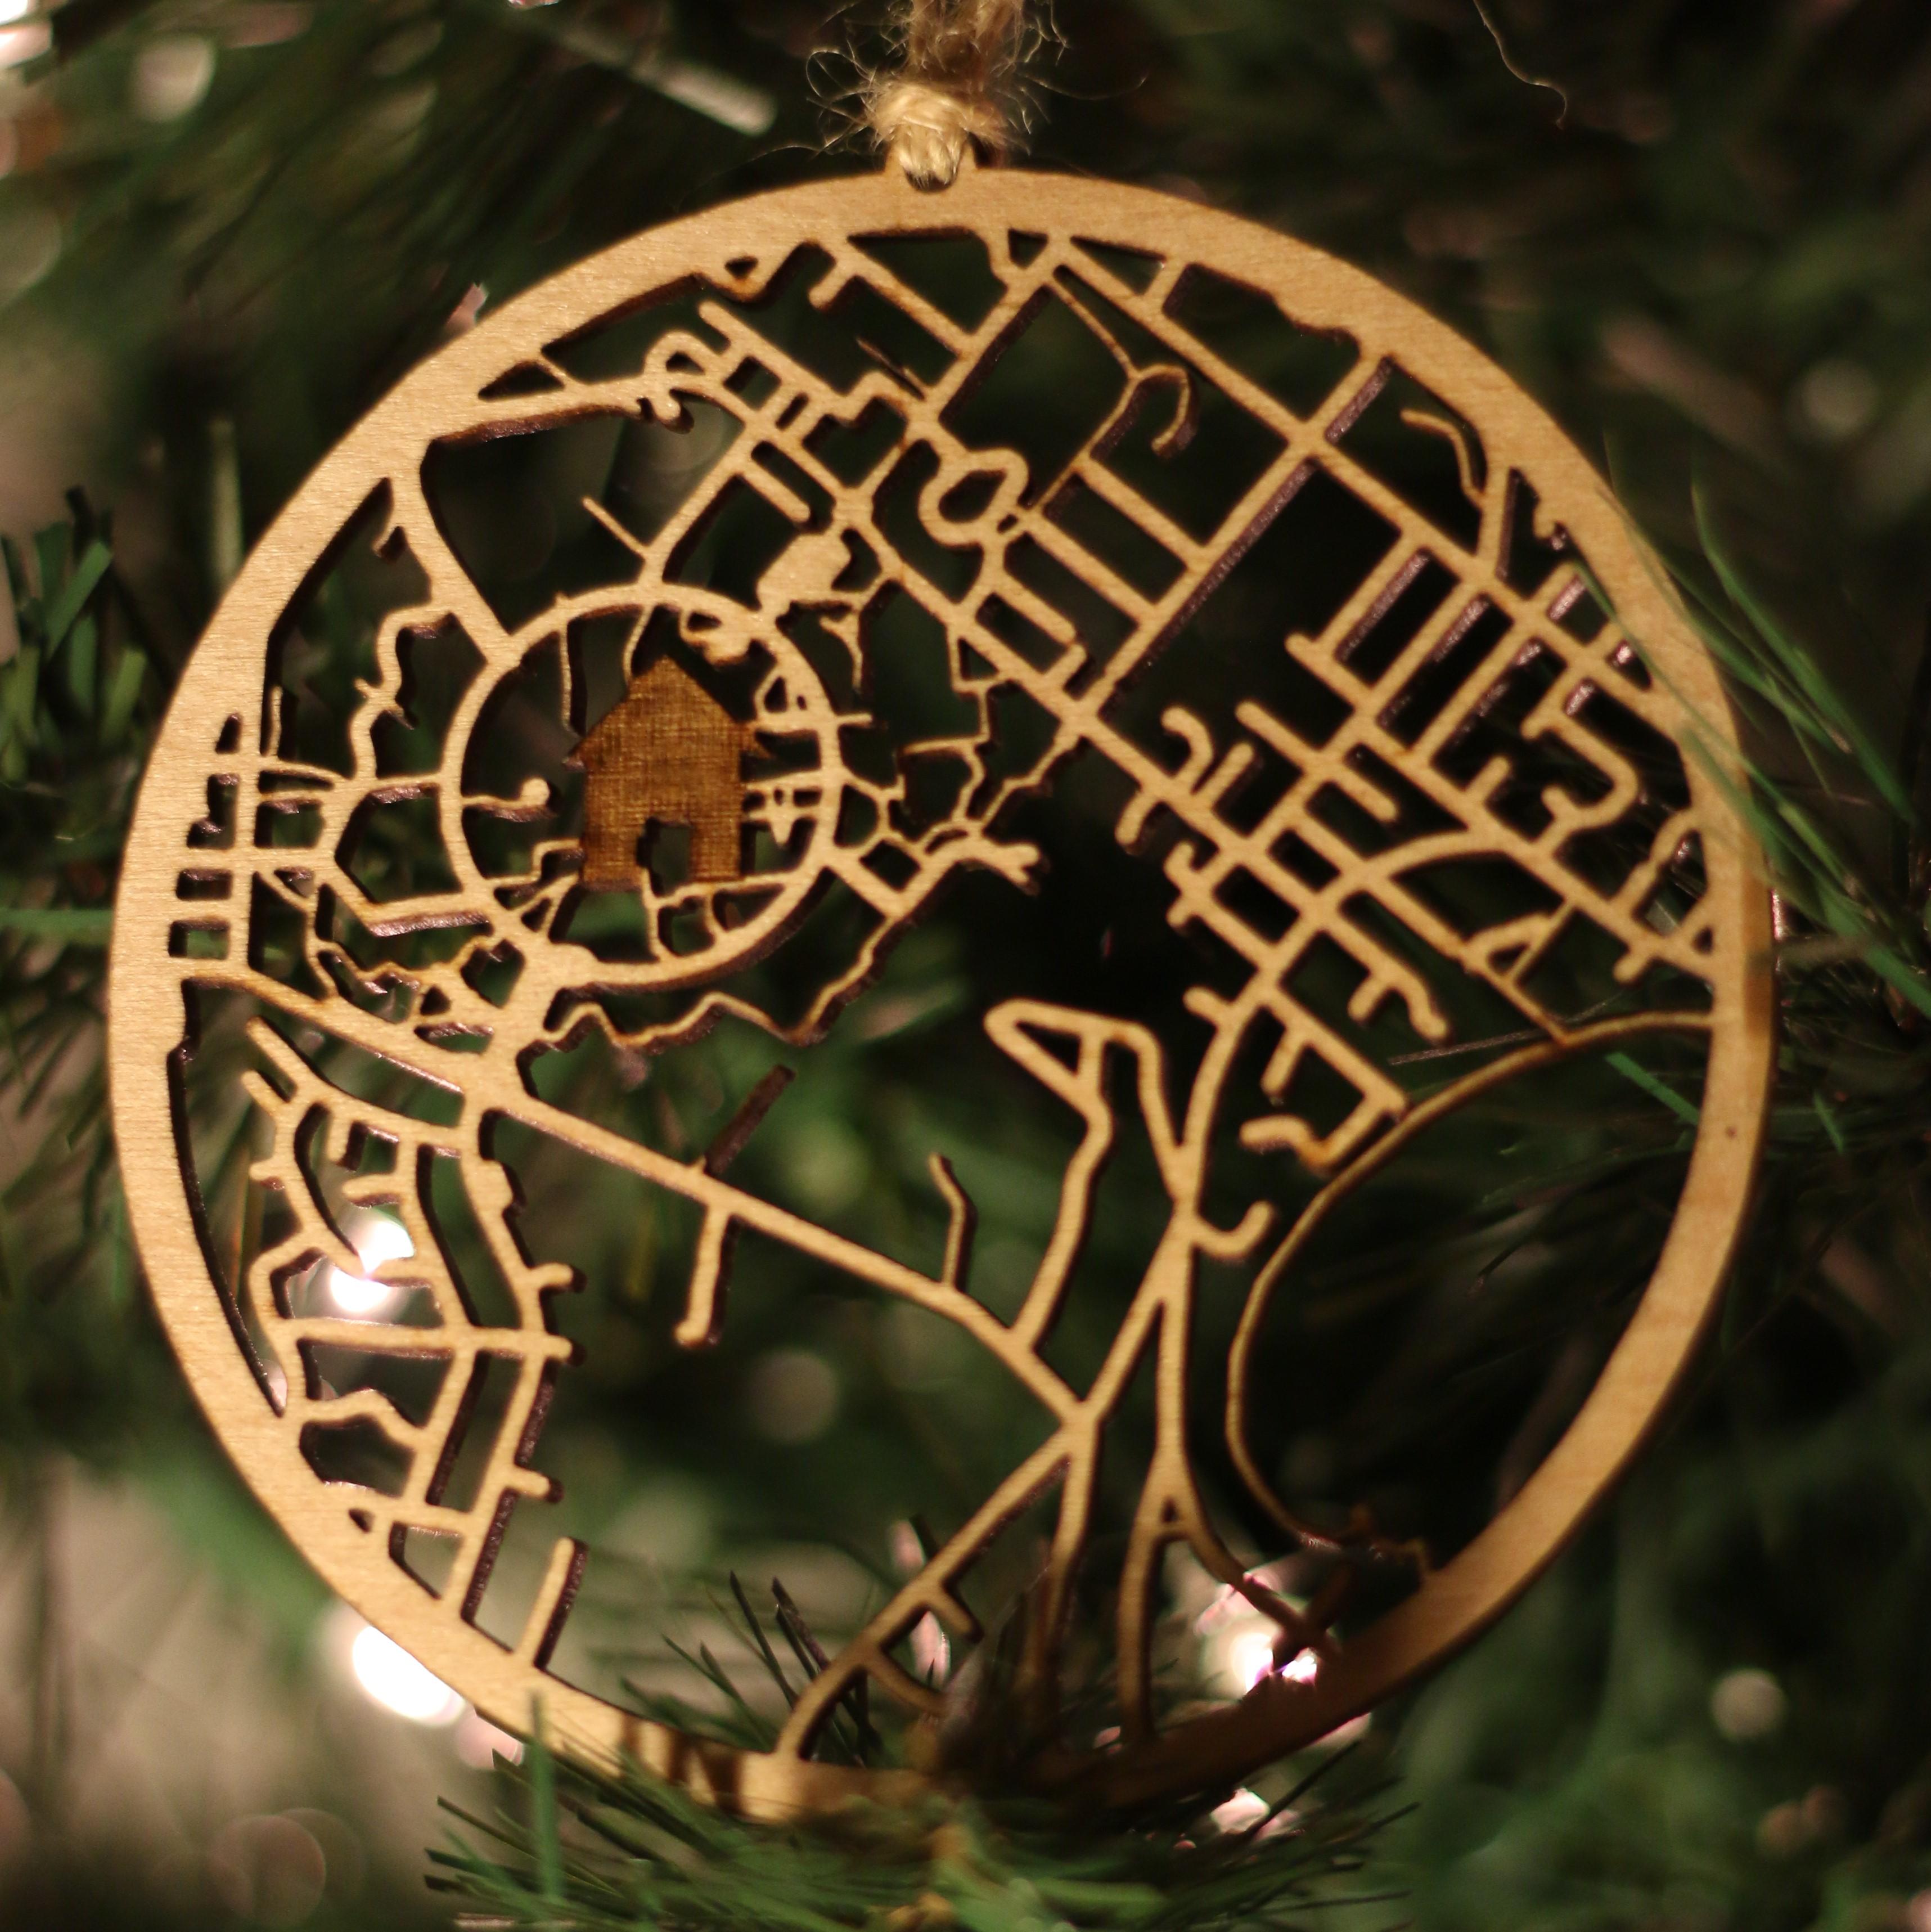
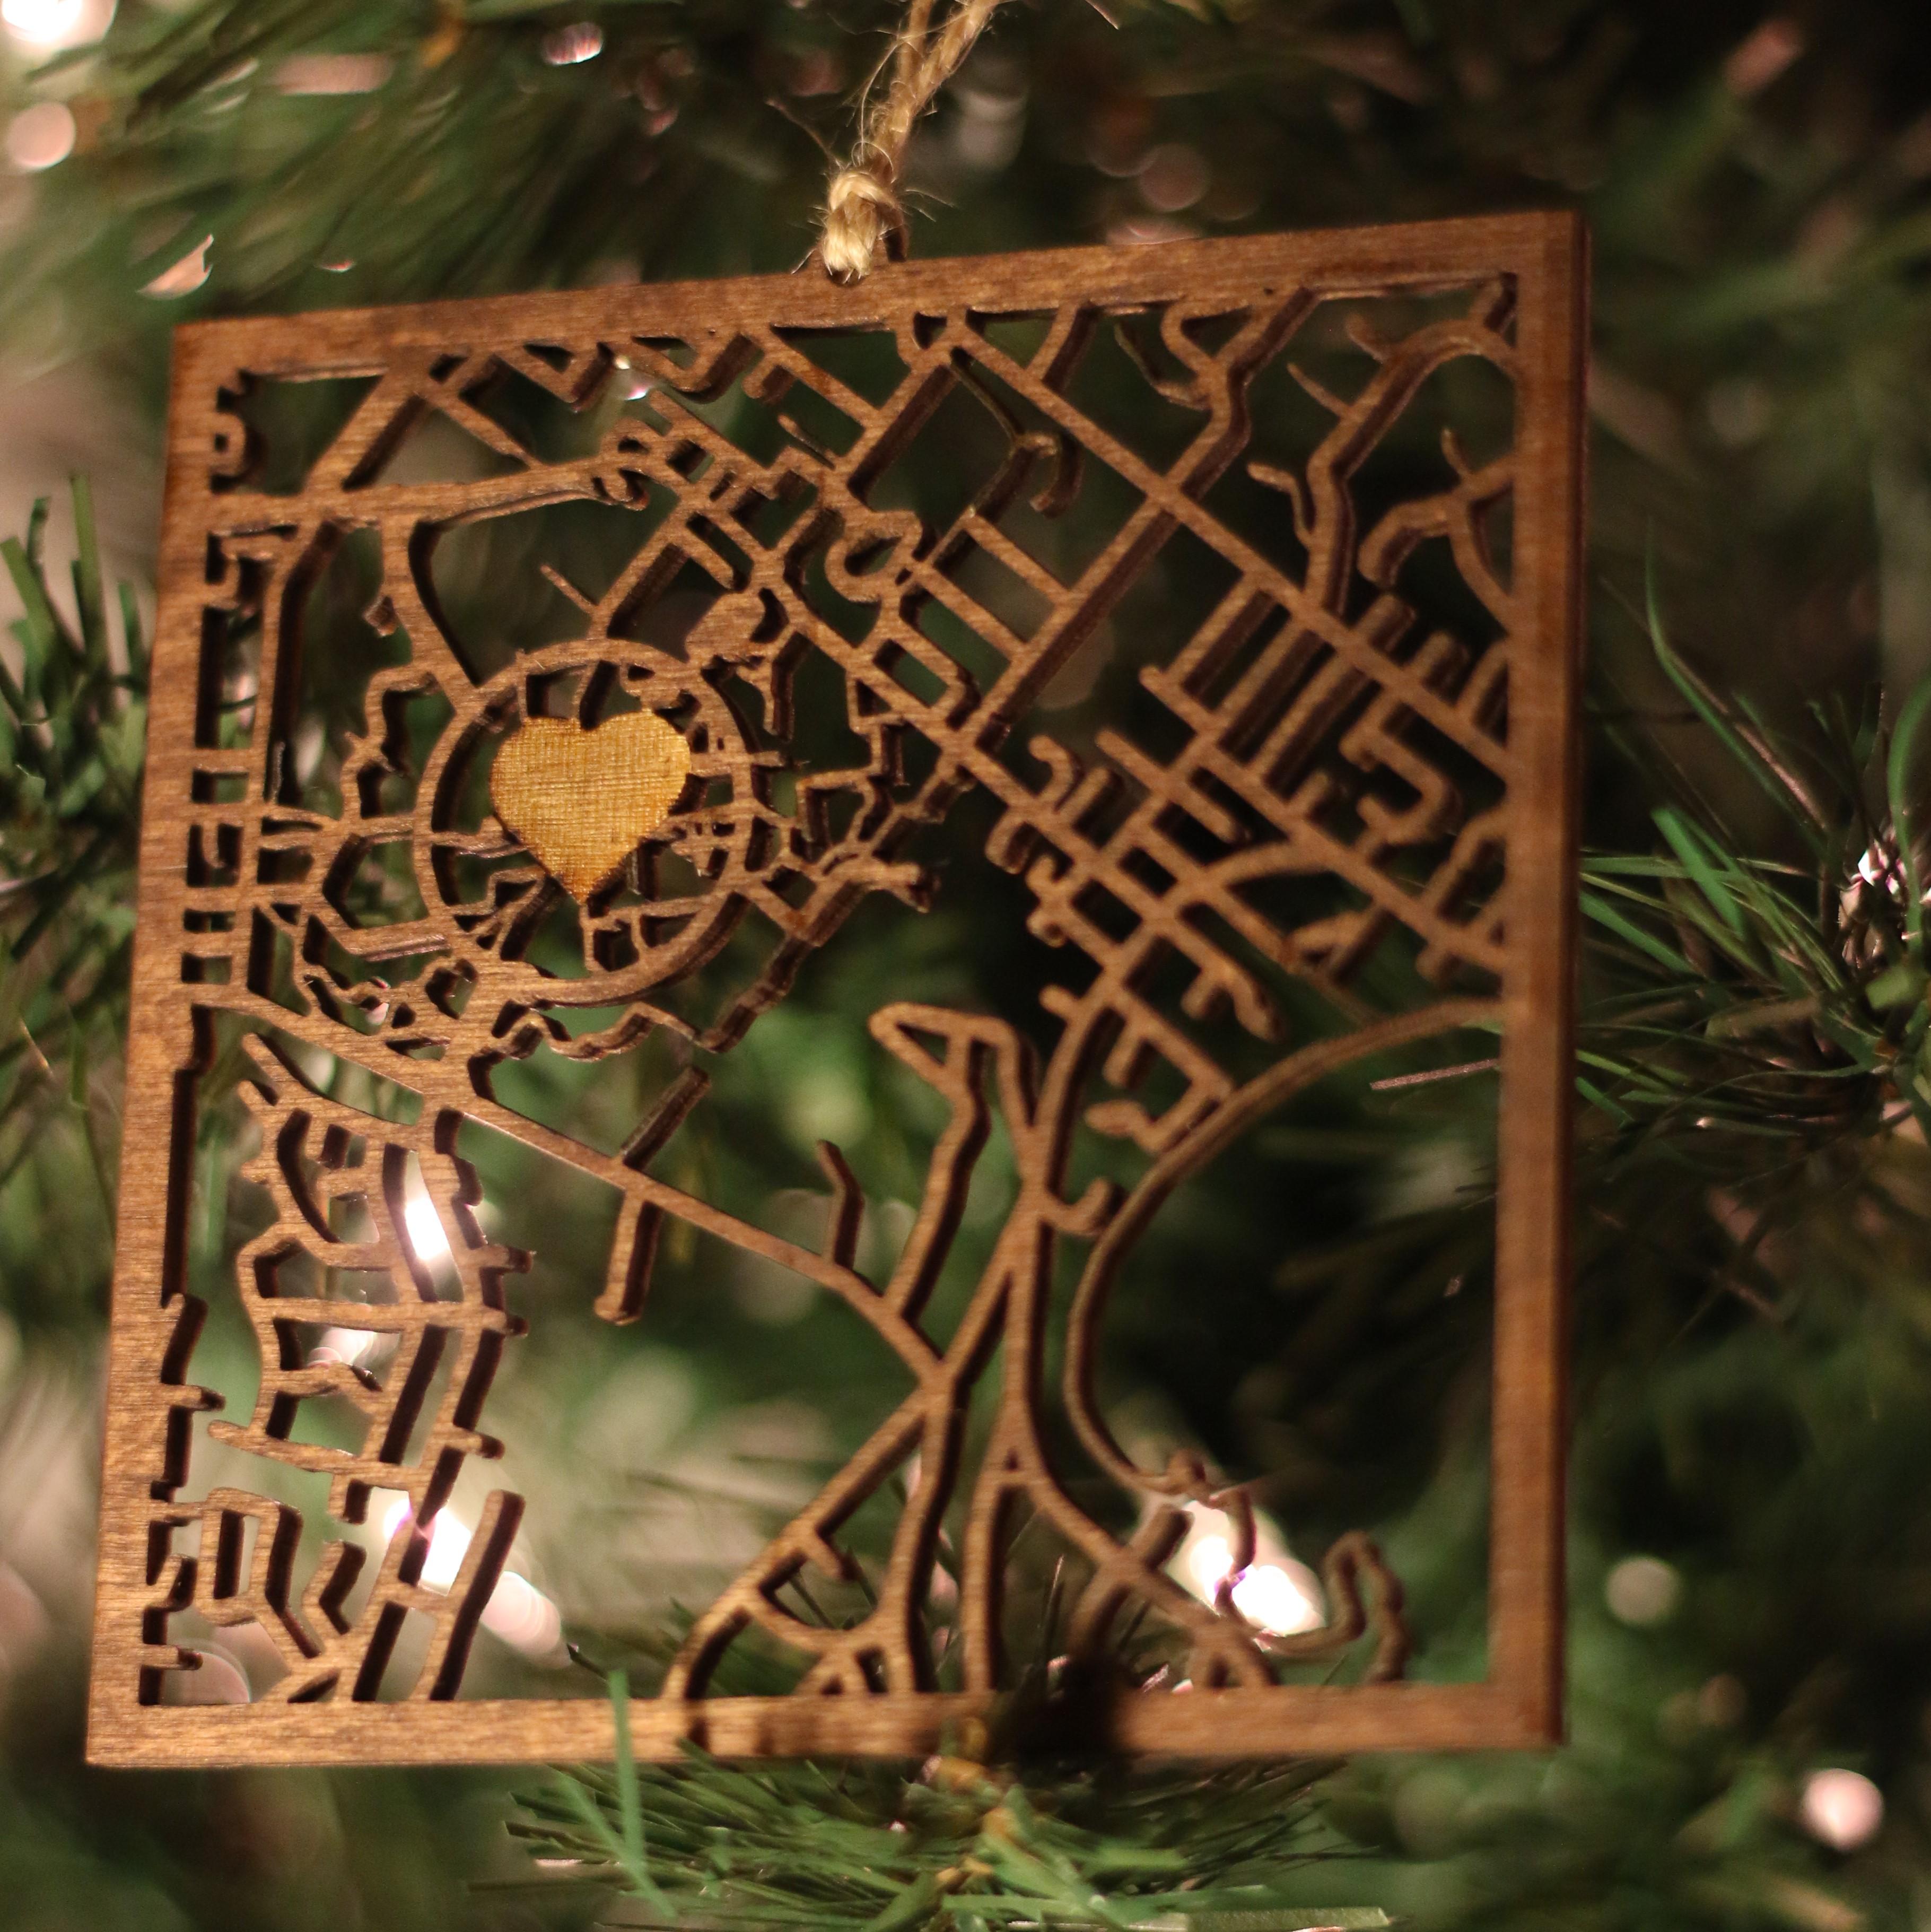
Laser cut street maps are a cool way to showcase the city that you (or your friends or family!) live in. Scaling them down to Christmas ornament size makes them a fun, relatively simple, and personalized gift! You can add symbols to mark the location of a home, engagement, or other meaningful spot. The best part is you can do all of it in QGIS (though other software might make some steps easier)!
Supplies
Software
- QGIS - QGIS is a free and open-source GIS software used to process geospatial data. I'm using version 3.16.4-Hannover
- Laser cutter software - My makerspace uses Lightburn, but whatever software you use should support files that we can export from QGIS.
Tools and Materials
- Laser cutter
- Wood or other material for the ornament
- A bit of string, ribbon, or something to hang the ornament. I had some left over twine that worked perfectly!
Data Requirements
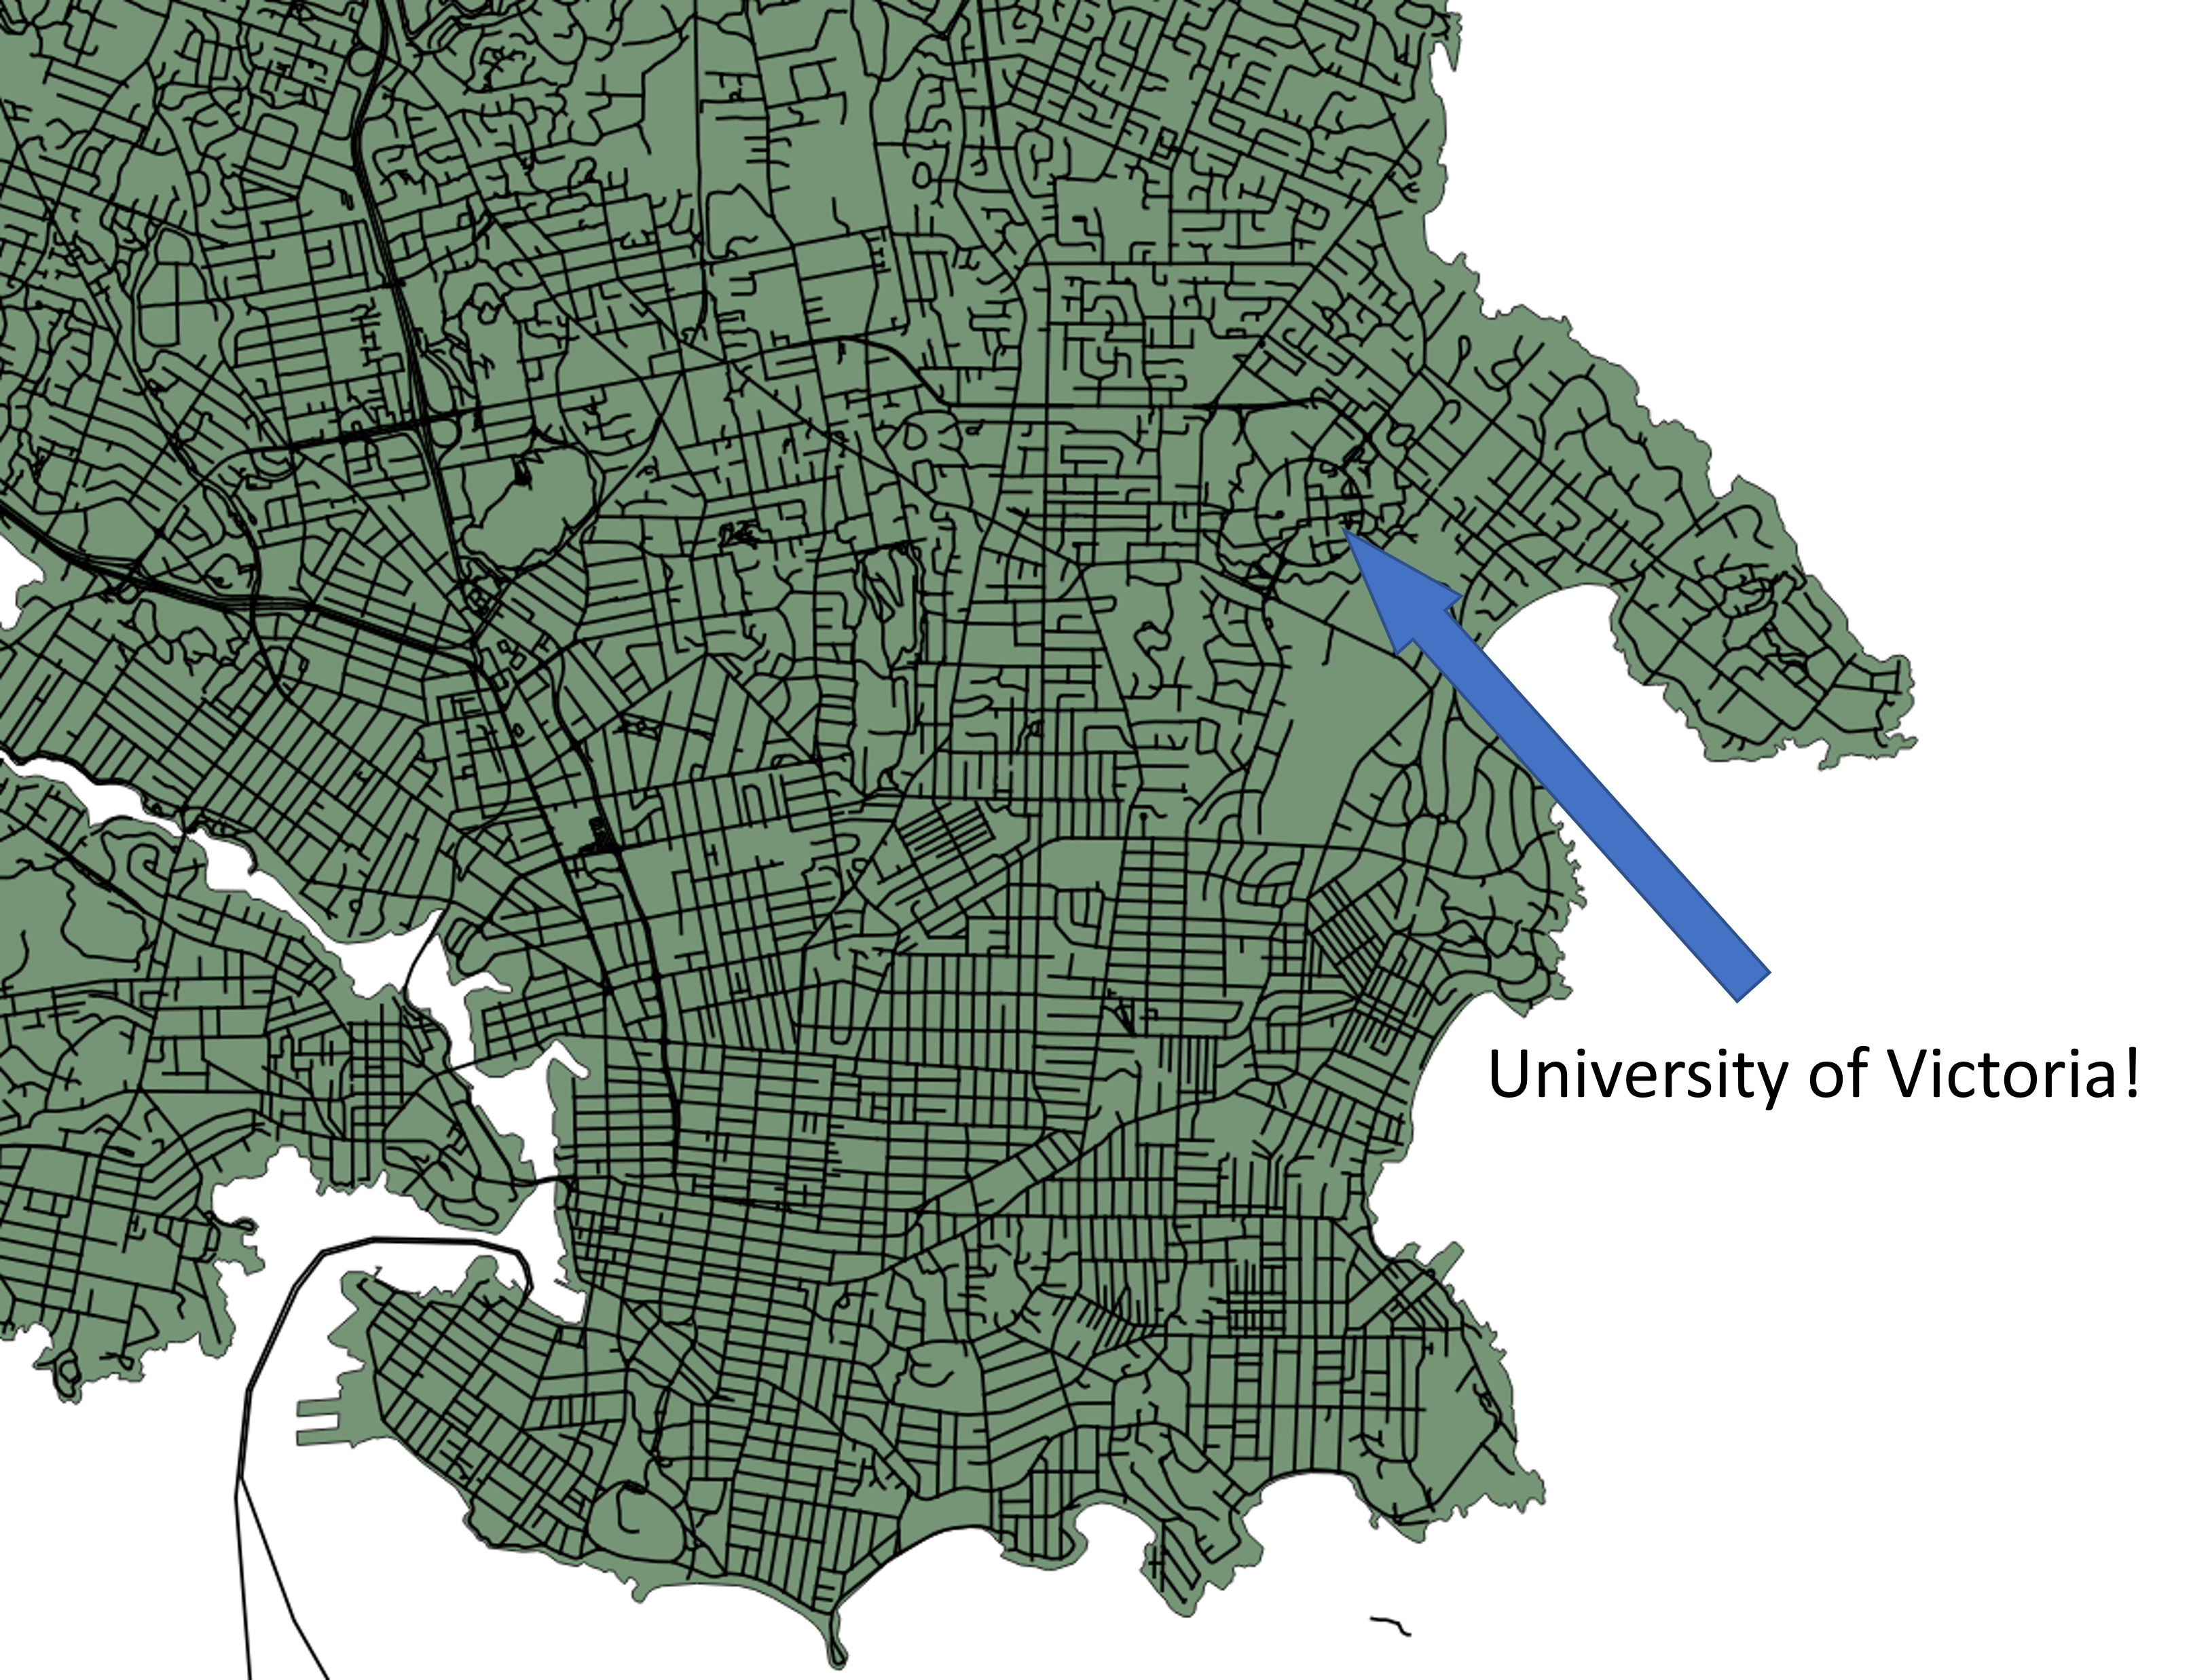
All you really need for this project is linear data for the streets in your area of interest. In my case, I'm also going to incorporate the shoreline into my ornament, so I'll need some land boundary data as well.
British Columbia Data
My map will highlight the University of Victoria in British Columbia, and fortunately the province of BC provides exactly the right kind of data that I need!
- The Digital Road Atlas contains all roads, ferry routes, airport runways, trails, etc. for the province.* One great thing about the DRA is that it includes the number of lanes for almost all roads, which will come in handy later.
- The Health Authority Boundaries dataset is relatively small but has good border information for the province so I use it for a number of projects.
Other data sources
If you're in the US, you can find road information for your state from the National Transportation Dataset or possibly from your state Department of Transportation. Your country or some other level of government might have something similar. Land border data can often be found with census data, so check out your country's census bureau to see if they have that (if you're wanting to include that information!).
Another way to get land/road/other data is by using the QuickOSM plugin in QGIS. This plugin allows you to download OpenStreetMap data for a specific area. It can be a bit overwhelming with the amount of things that are included, but coverage is often very good and sometimes includes number of lanes for roadways. You can use presets to filter for certain categories (like transportation) or just download everything on the map canvas and filter out what you don't need after the fact!
*If you're also wanting to use data for British Columbia, you can easily access the files via ftp by copying the ftp link into a File Explorer window on a Windows computer. Alternatively, if you select the custom download option, you can select an area of interest and have a link emailed to you with the data that you want.
Initial Setup and Processing
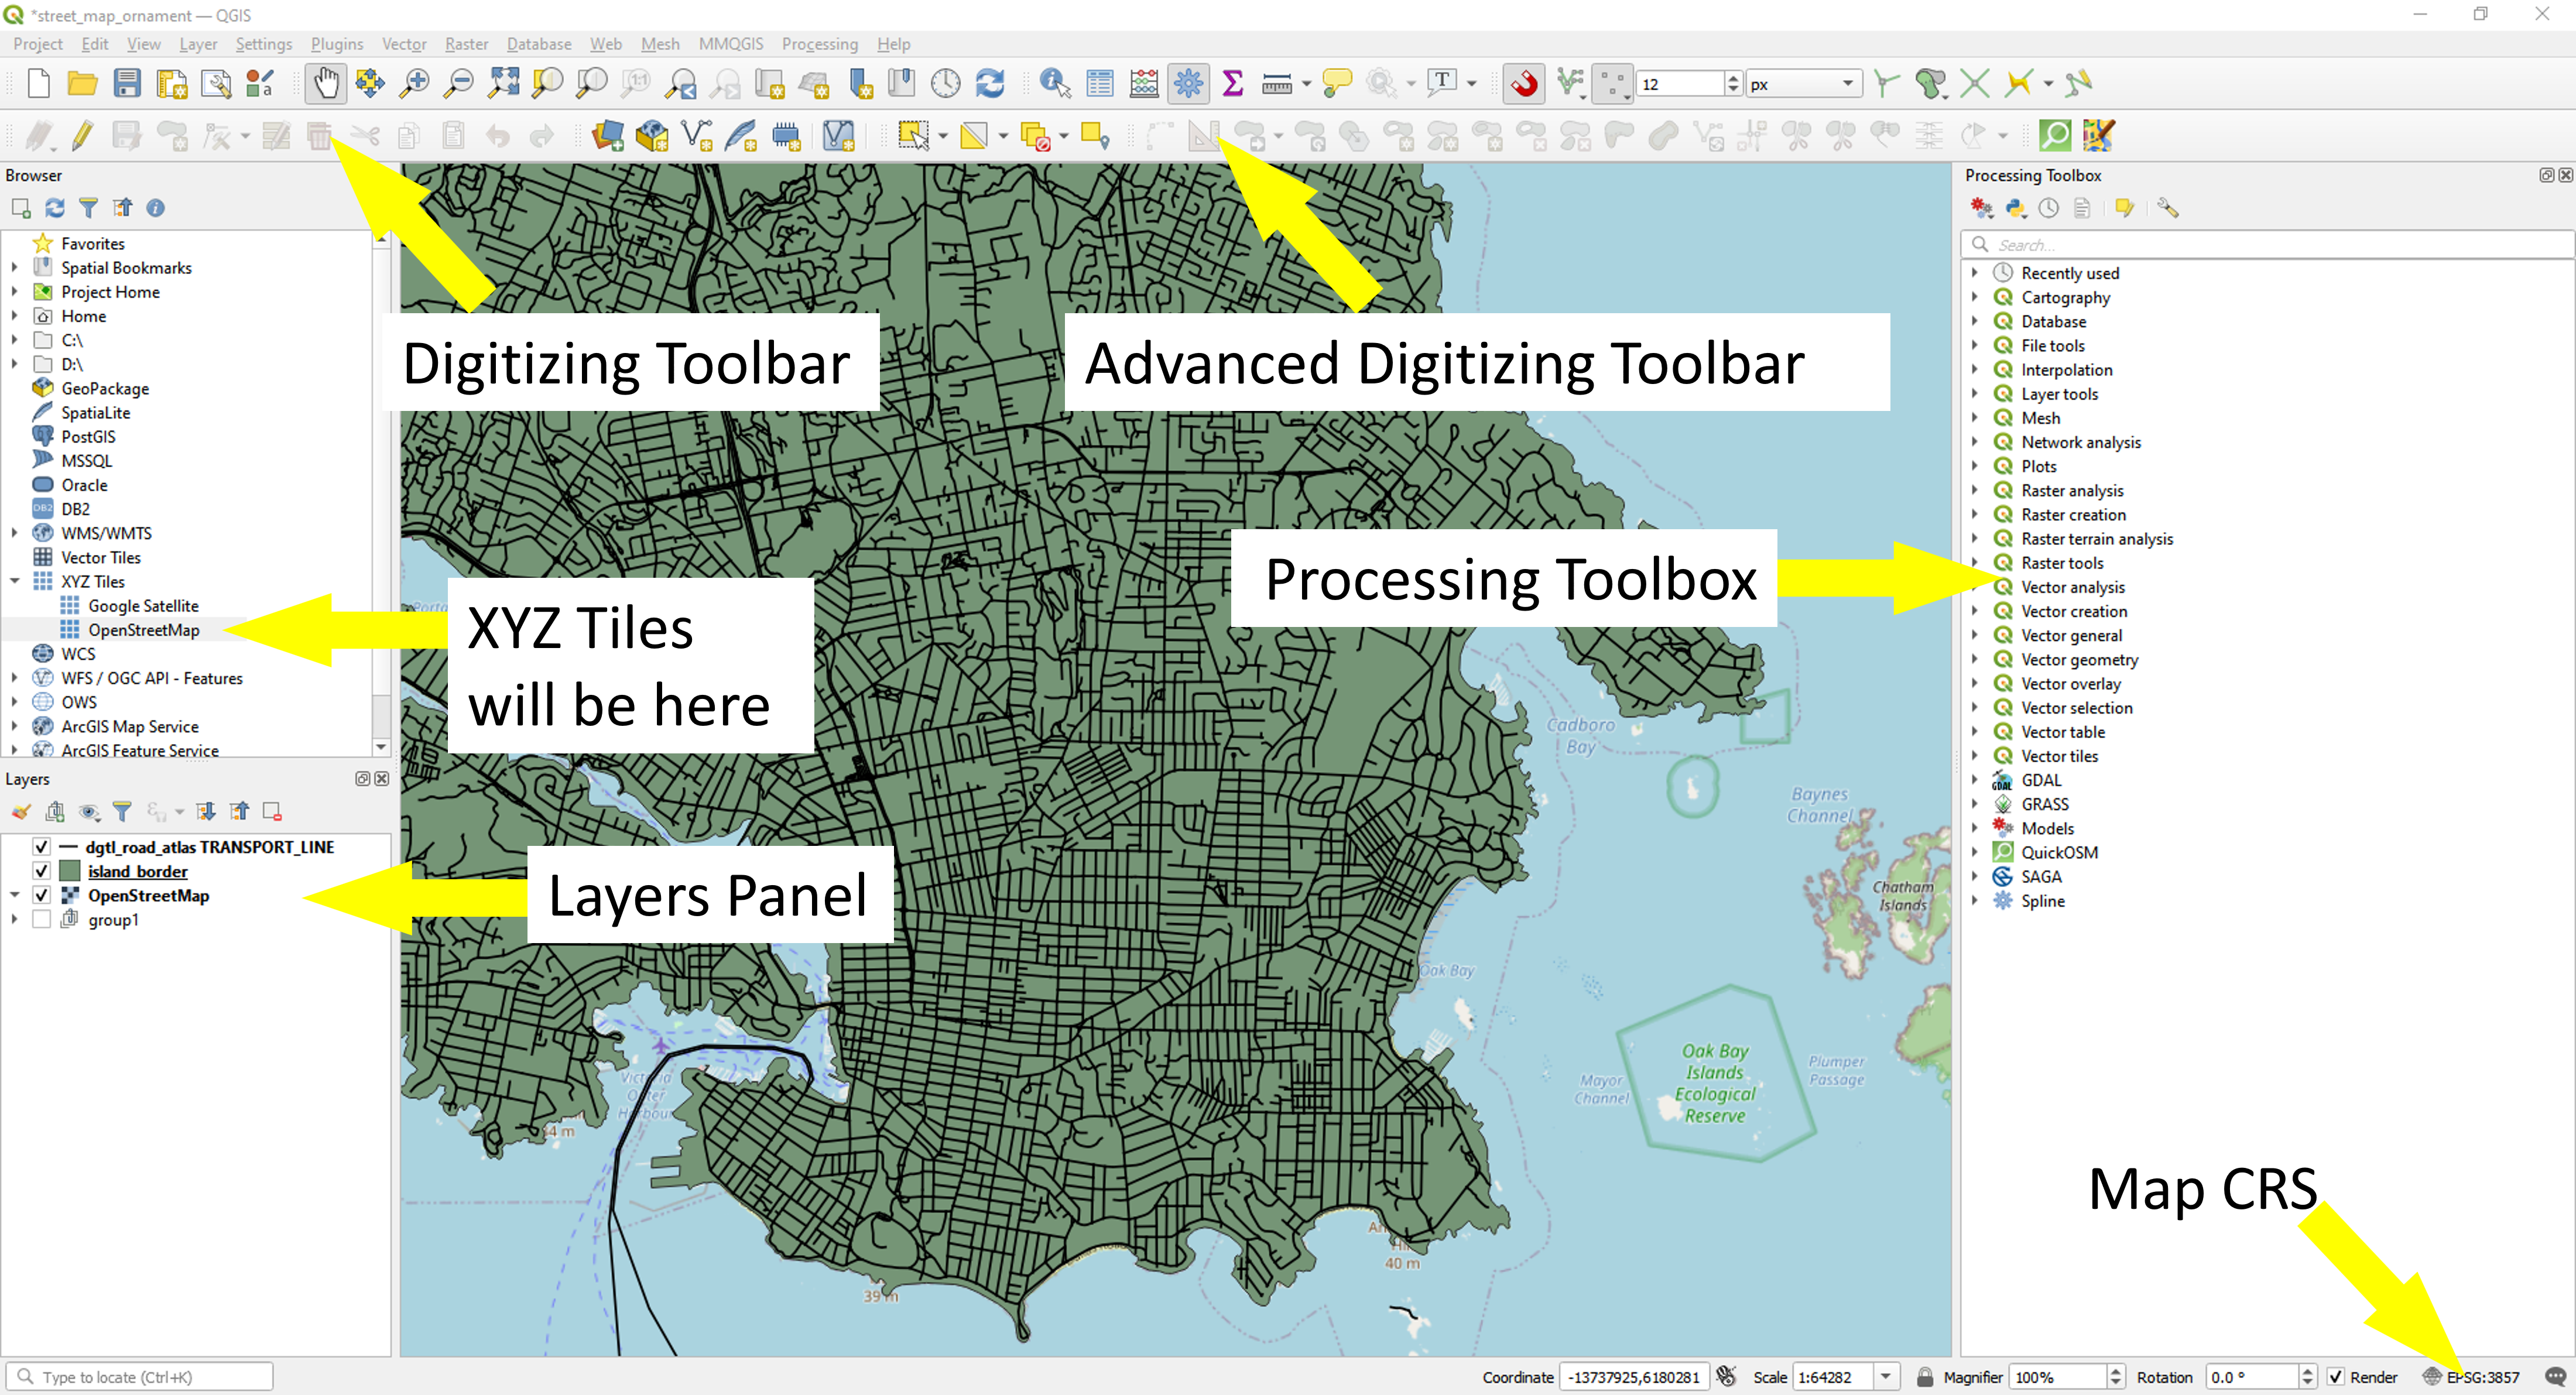
Before I begin, a friendly reminder that any process that you run in QGIS creates a new temporary layer by default. These layers are not saved unless you tell them to be saved (right-click>Export>Save Features As... or click the little memory icon next to the layer name), and will be deleted the next time QGIS is closed.
Map Projection
In QGIS, I generally like using the EPSG:3857 projection as it tends to be one that most people are used to and looks natural. To set your map projection, click on the icon in the bottom right of the screen and select the one that you want. There are thousands available depending on where you are and what you need!
Helpful Background
I also often like to have an OpenStreetMap background in place so I can easily reference where I am. To add this or other backgrounds to your map, you can follow this handy guide then access them from the QGIS 'Browser' (if it's not visible, click View>Panels>Browser) under the 'XYZ Tiles' heading and just drag and drop them into your map canvas to add them.
Paring Down Data (Initial)
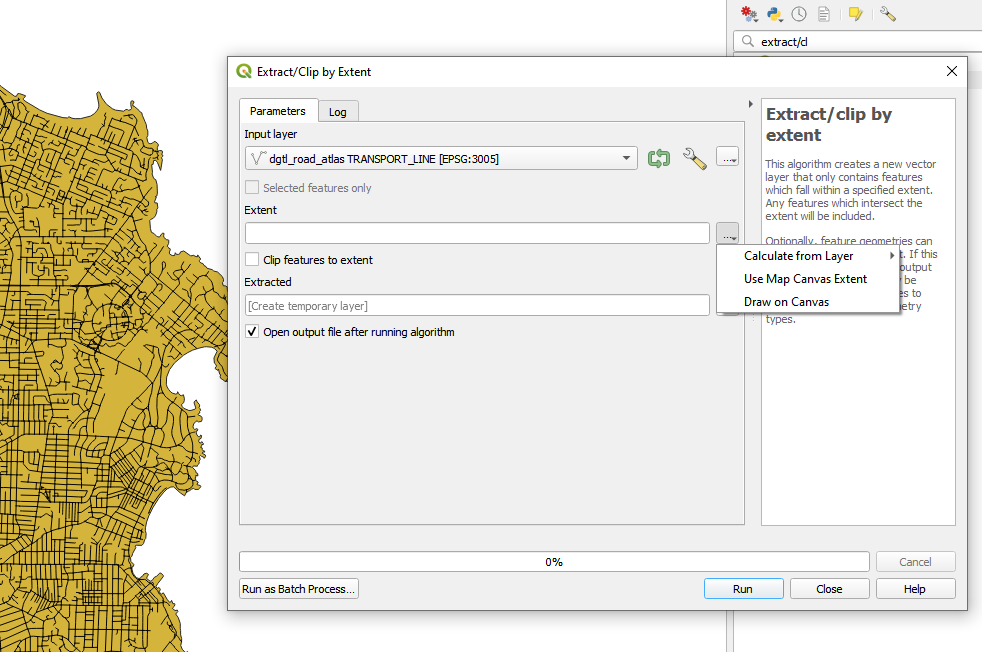
If you have a very large dataset, one thing that you can do to quickly reduce it's size and speed up loading is use the 'Extract/clip by extent' tool. Search and open this tool from the Processing Toolbox (if you don't see the Processing Toolbox, click View>Panels>Processing Toolbox to turn it on).
Move around until you have the area around your map visible in the map canvas on QGIS, then in the 'Extract/clip by extent' tool you can select the option to "Use Map Canvas Extent." Once you run this, your map should load much more quickly if it was really large to begin with!
Filtering [if Needed/wanted]
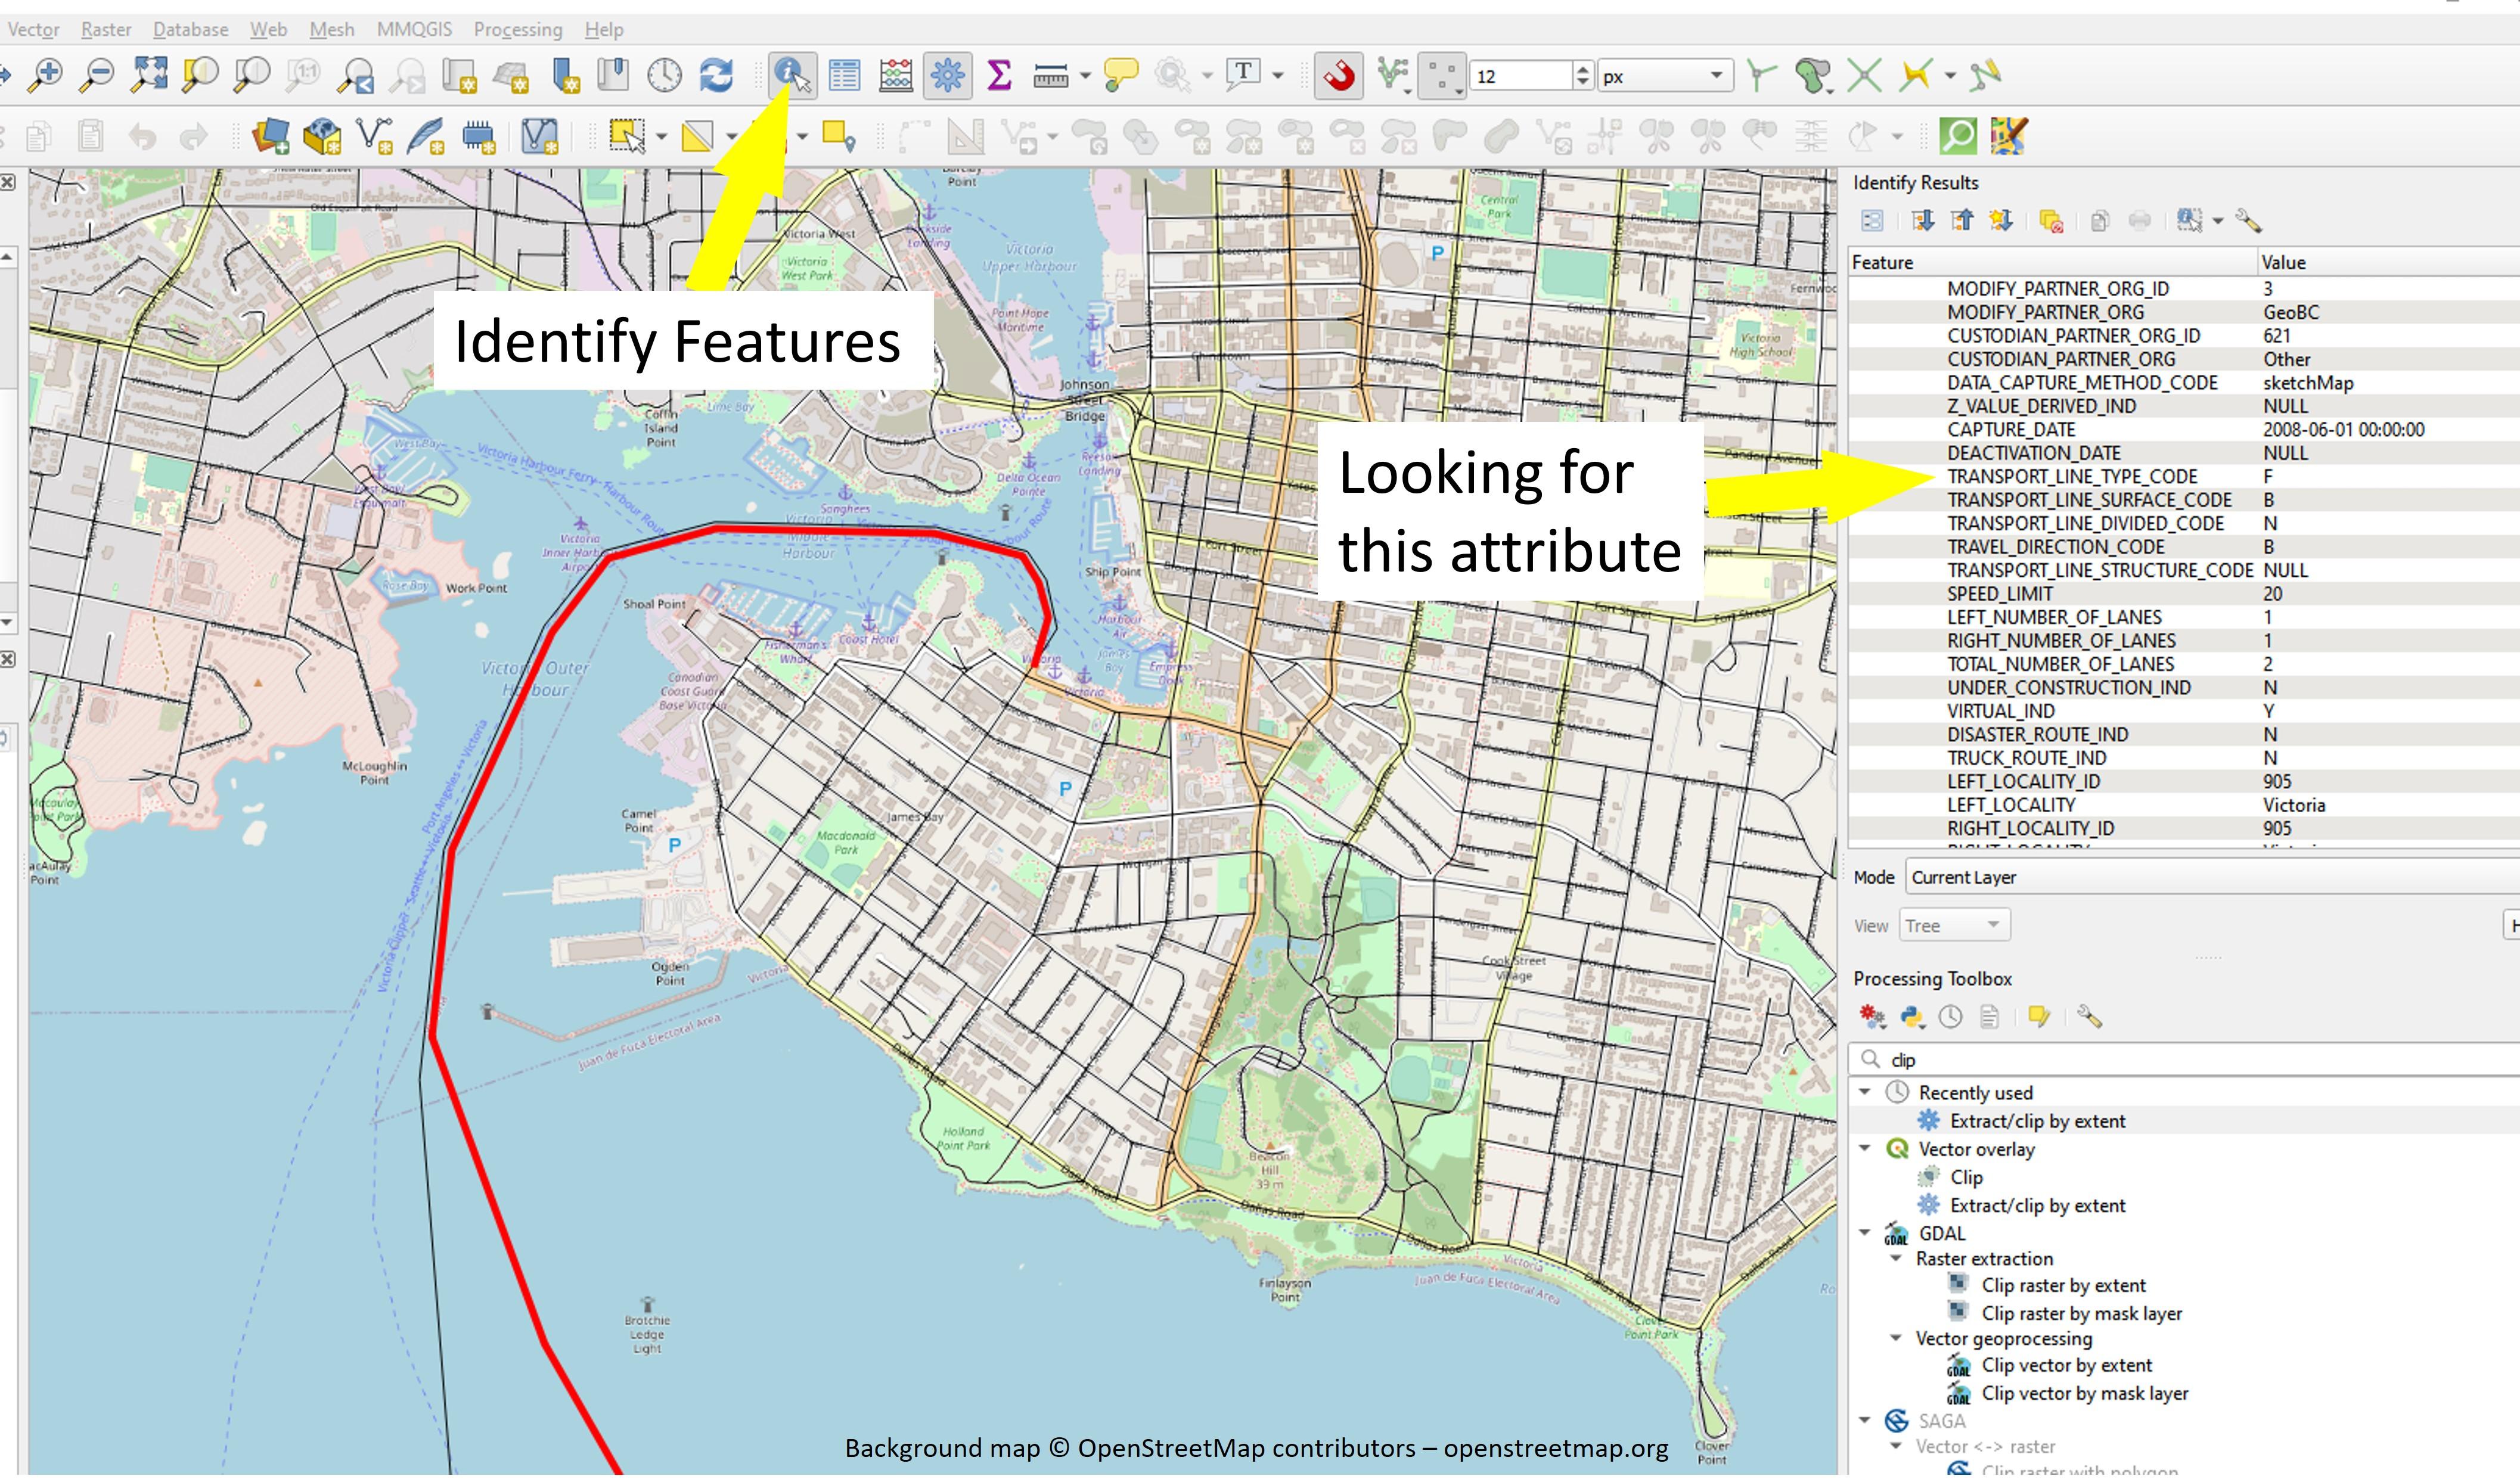
Dig around a bit in your road data to see what sort of features are available. In some cases, there may be a guide that you can get that shows you what different codes or attributes mean. For the Digital Road Atlas, this guide provides keys for different codes that are used in the data.
Identify Features [First Image]
In my case, my map won't actually include the area by the ferries, but just for demonstration, I'll show how I'd filter them out if I wanted to. In the DRA guide book, there are three different ferry codes, 'F', 'FR', and 'FP'. Since I'm not sure exactly which type are shown in my map, I can use the 'Identify Features' tool, then see that it's 'TRANSPORT_LINE_TYPE_CODE' is just 'F'.
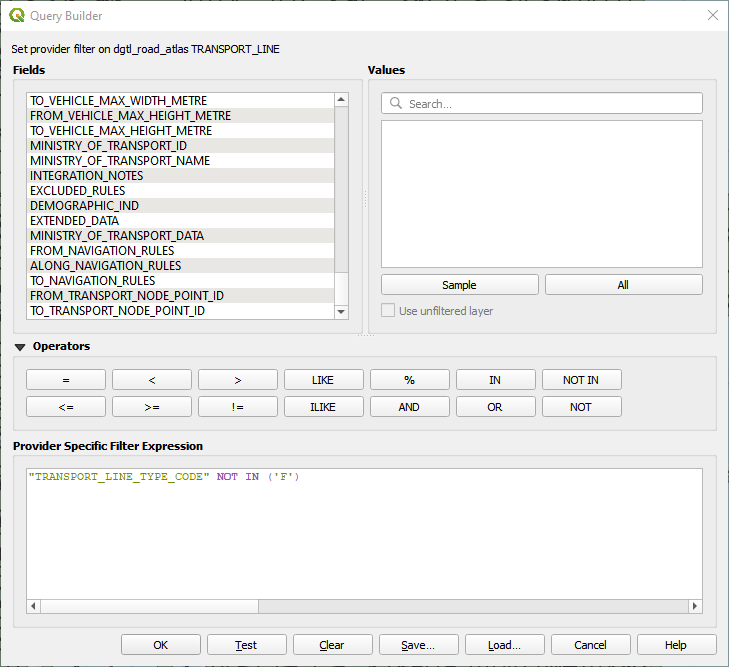
Filtering [Second Image]
To filter, right-click on the layer name ('Extracted' in this case) and click filter.
In the Query Builder that pops up, double click on 'TRANSPORT_LINE_TYPE_CODE' to add it to the filter expression.
The full expression will be:
"TRANSPORT_LINE_TYPE_CODE" NOT IN ('F')
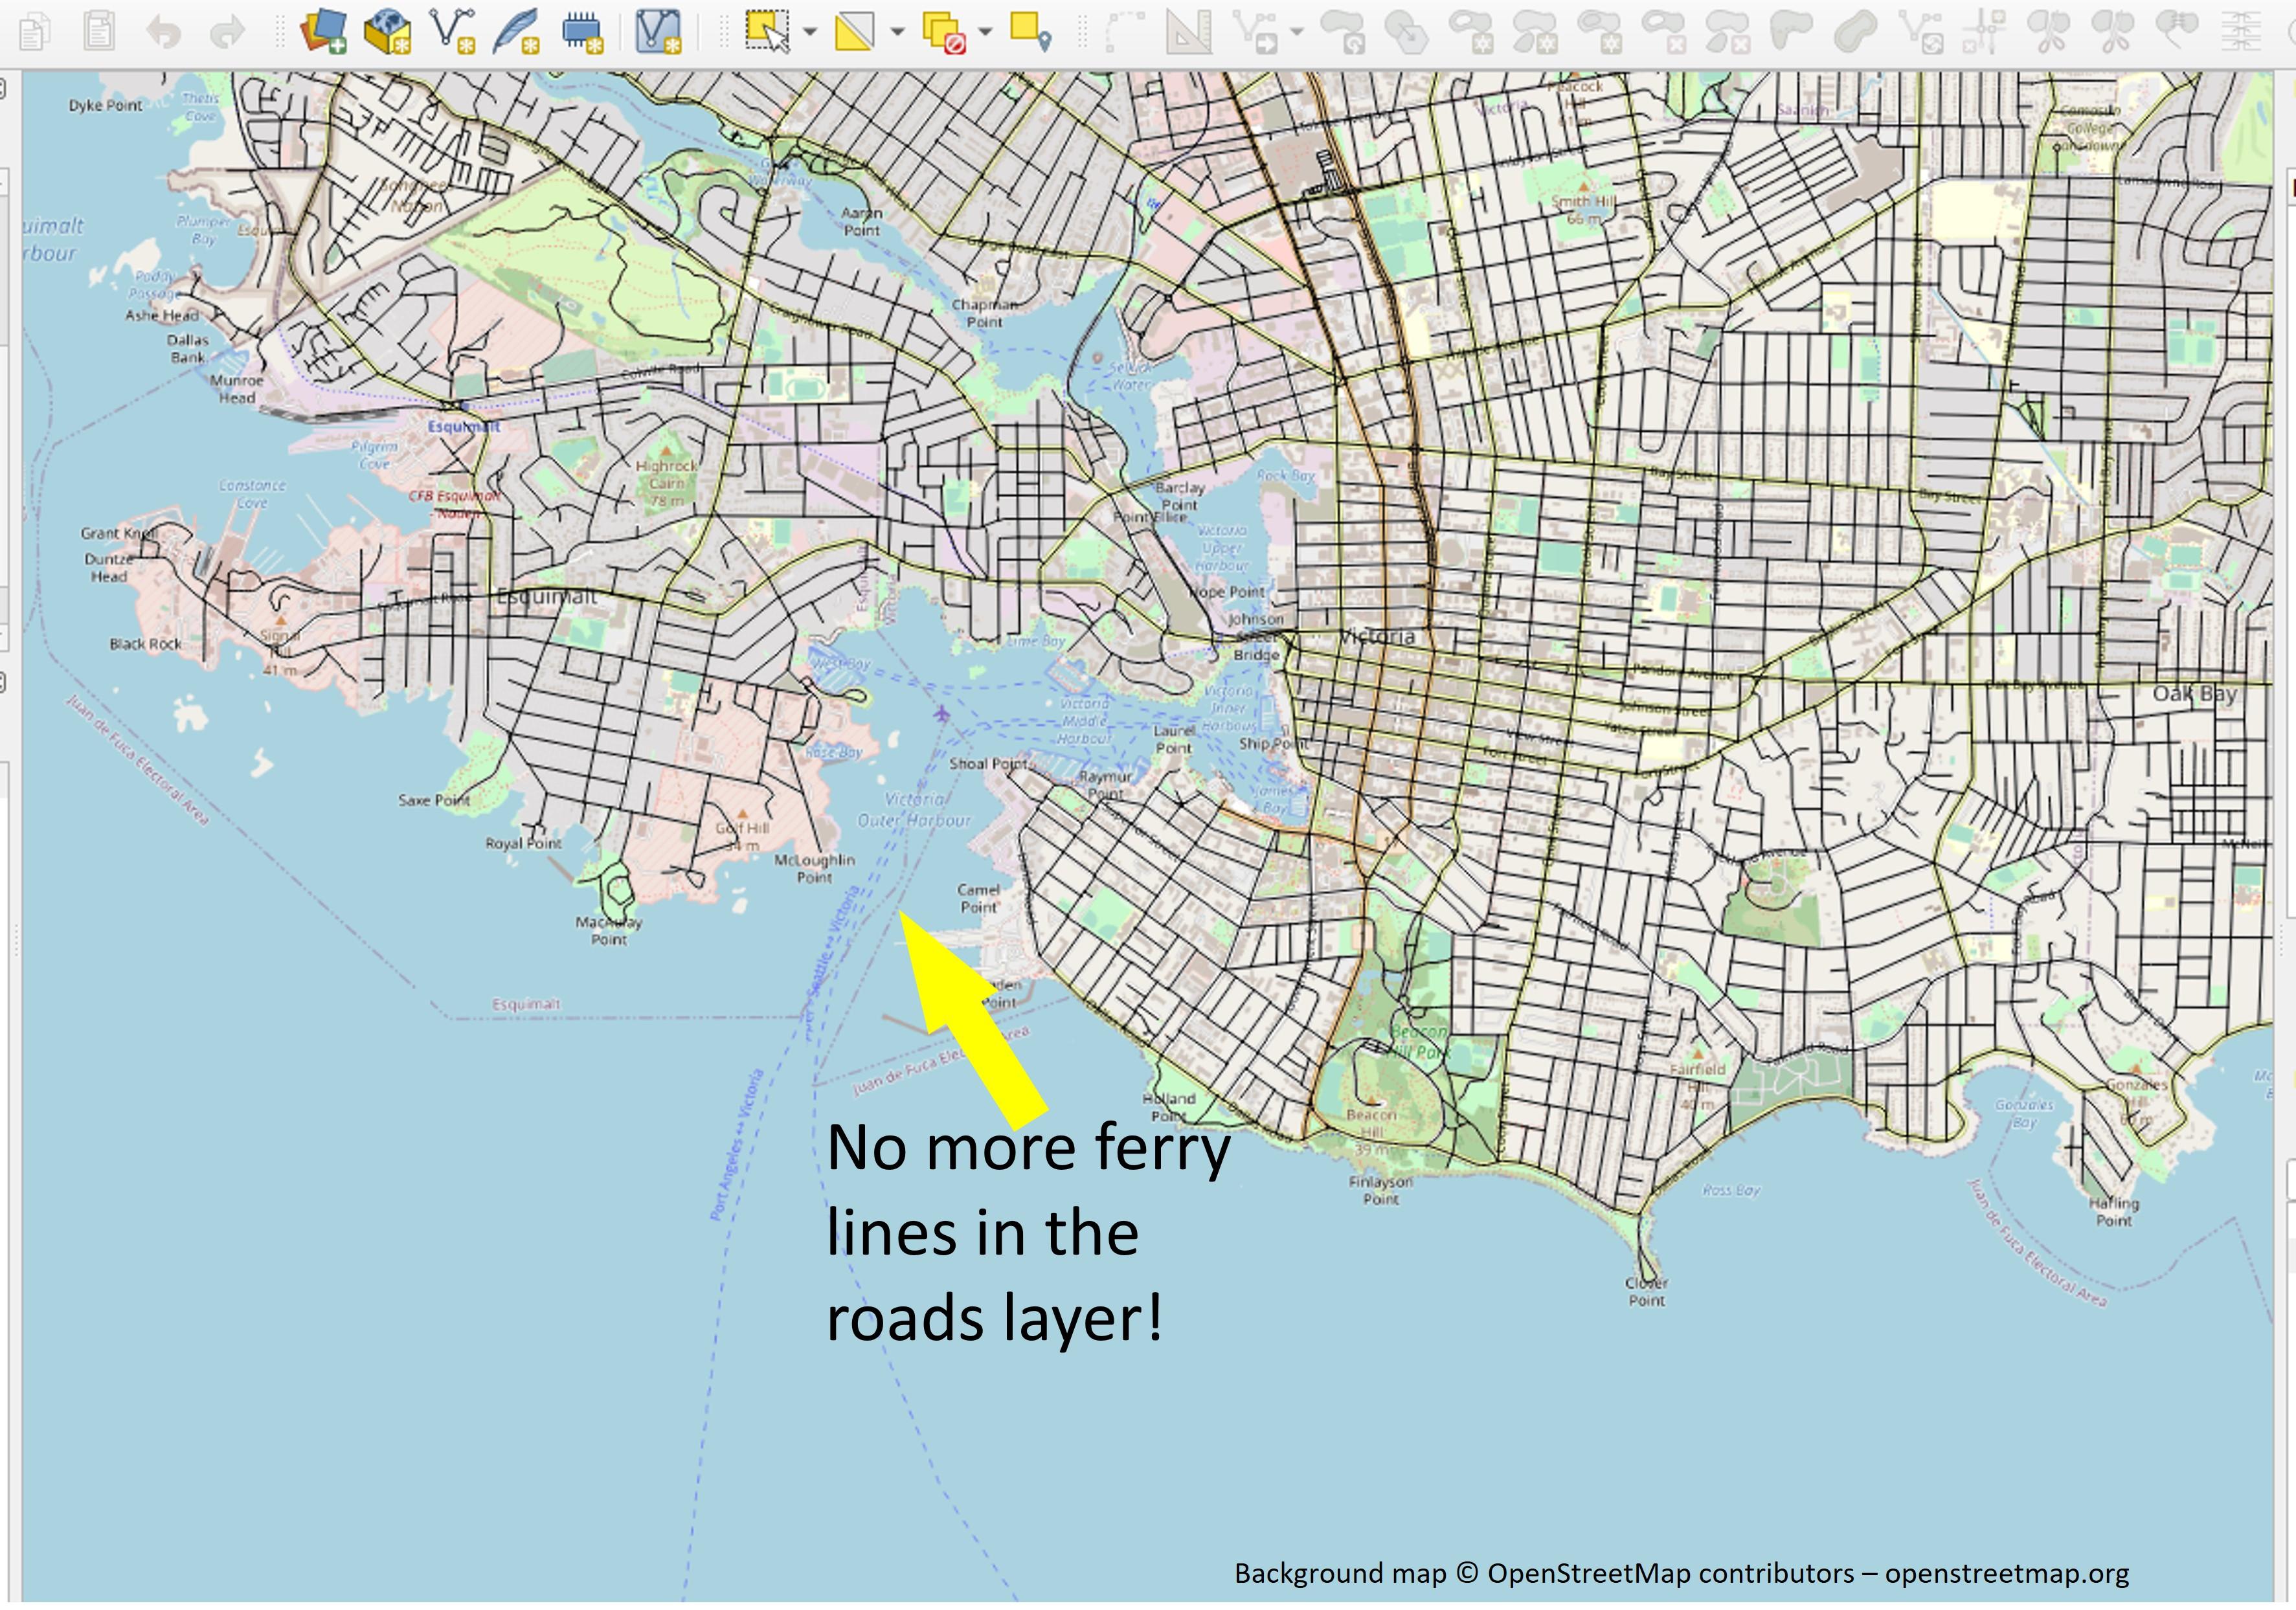
After running this, the ferry lines are gone from the road layer [third image].
This tells QGIS to keep every feature that doesn't have 'F' as its type code. Layer names in QGIS are surrounded with double quotes ("), and attributes use single quotes ('). If you want to filter out additional feature types, you can easily add more to the list inside the parentheses. You can play around with filtering different attributes and features until you find a map that you think looks good.
Size Planning
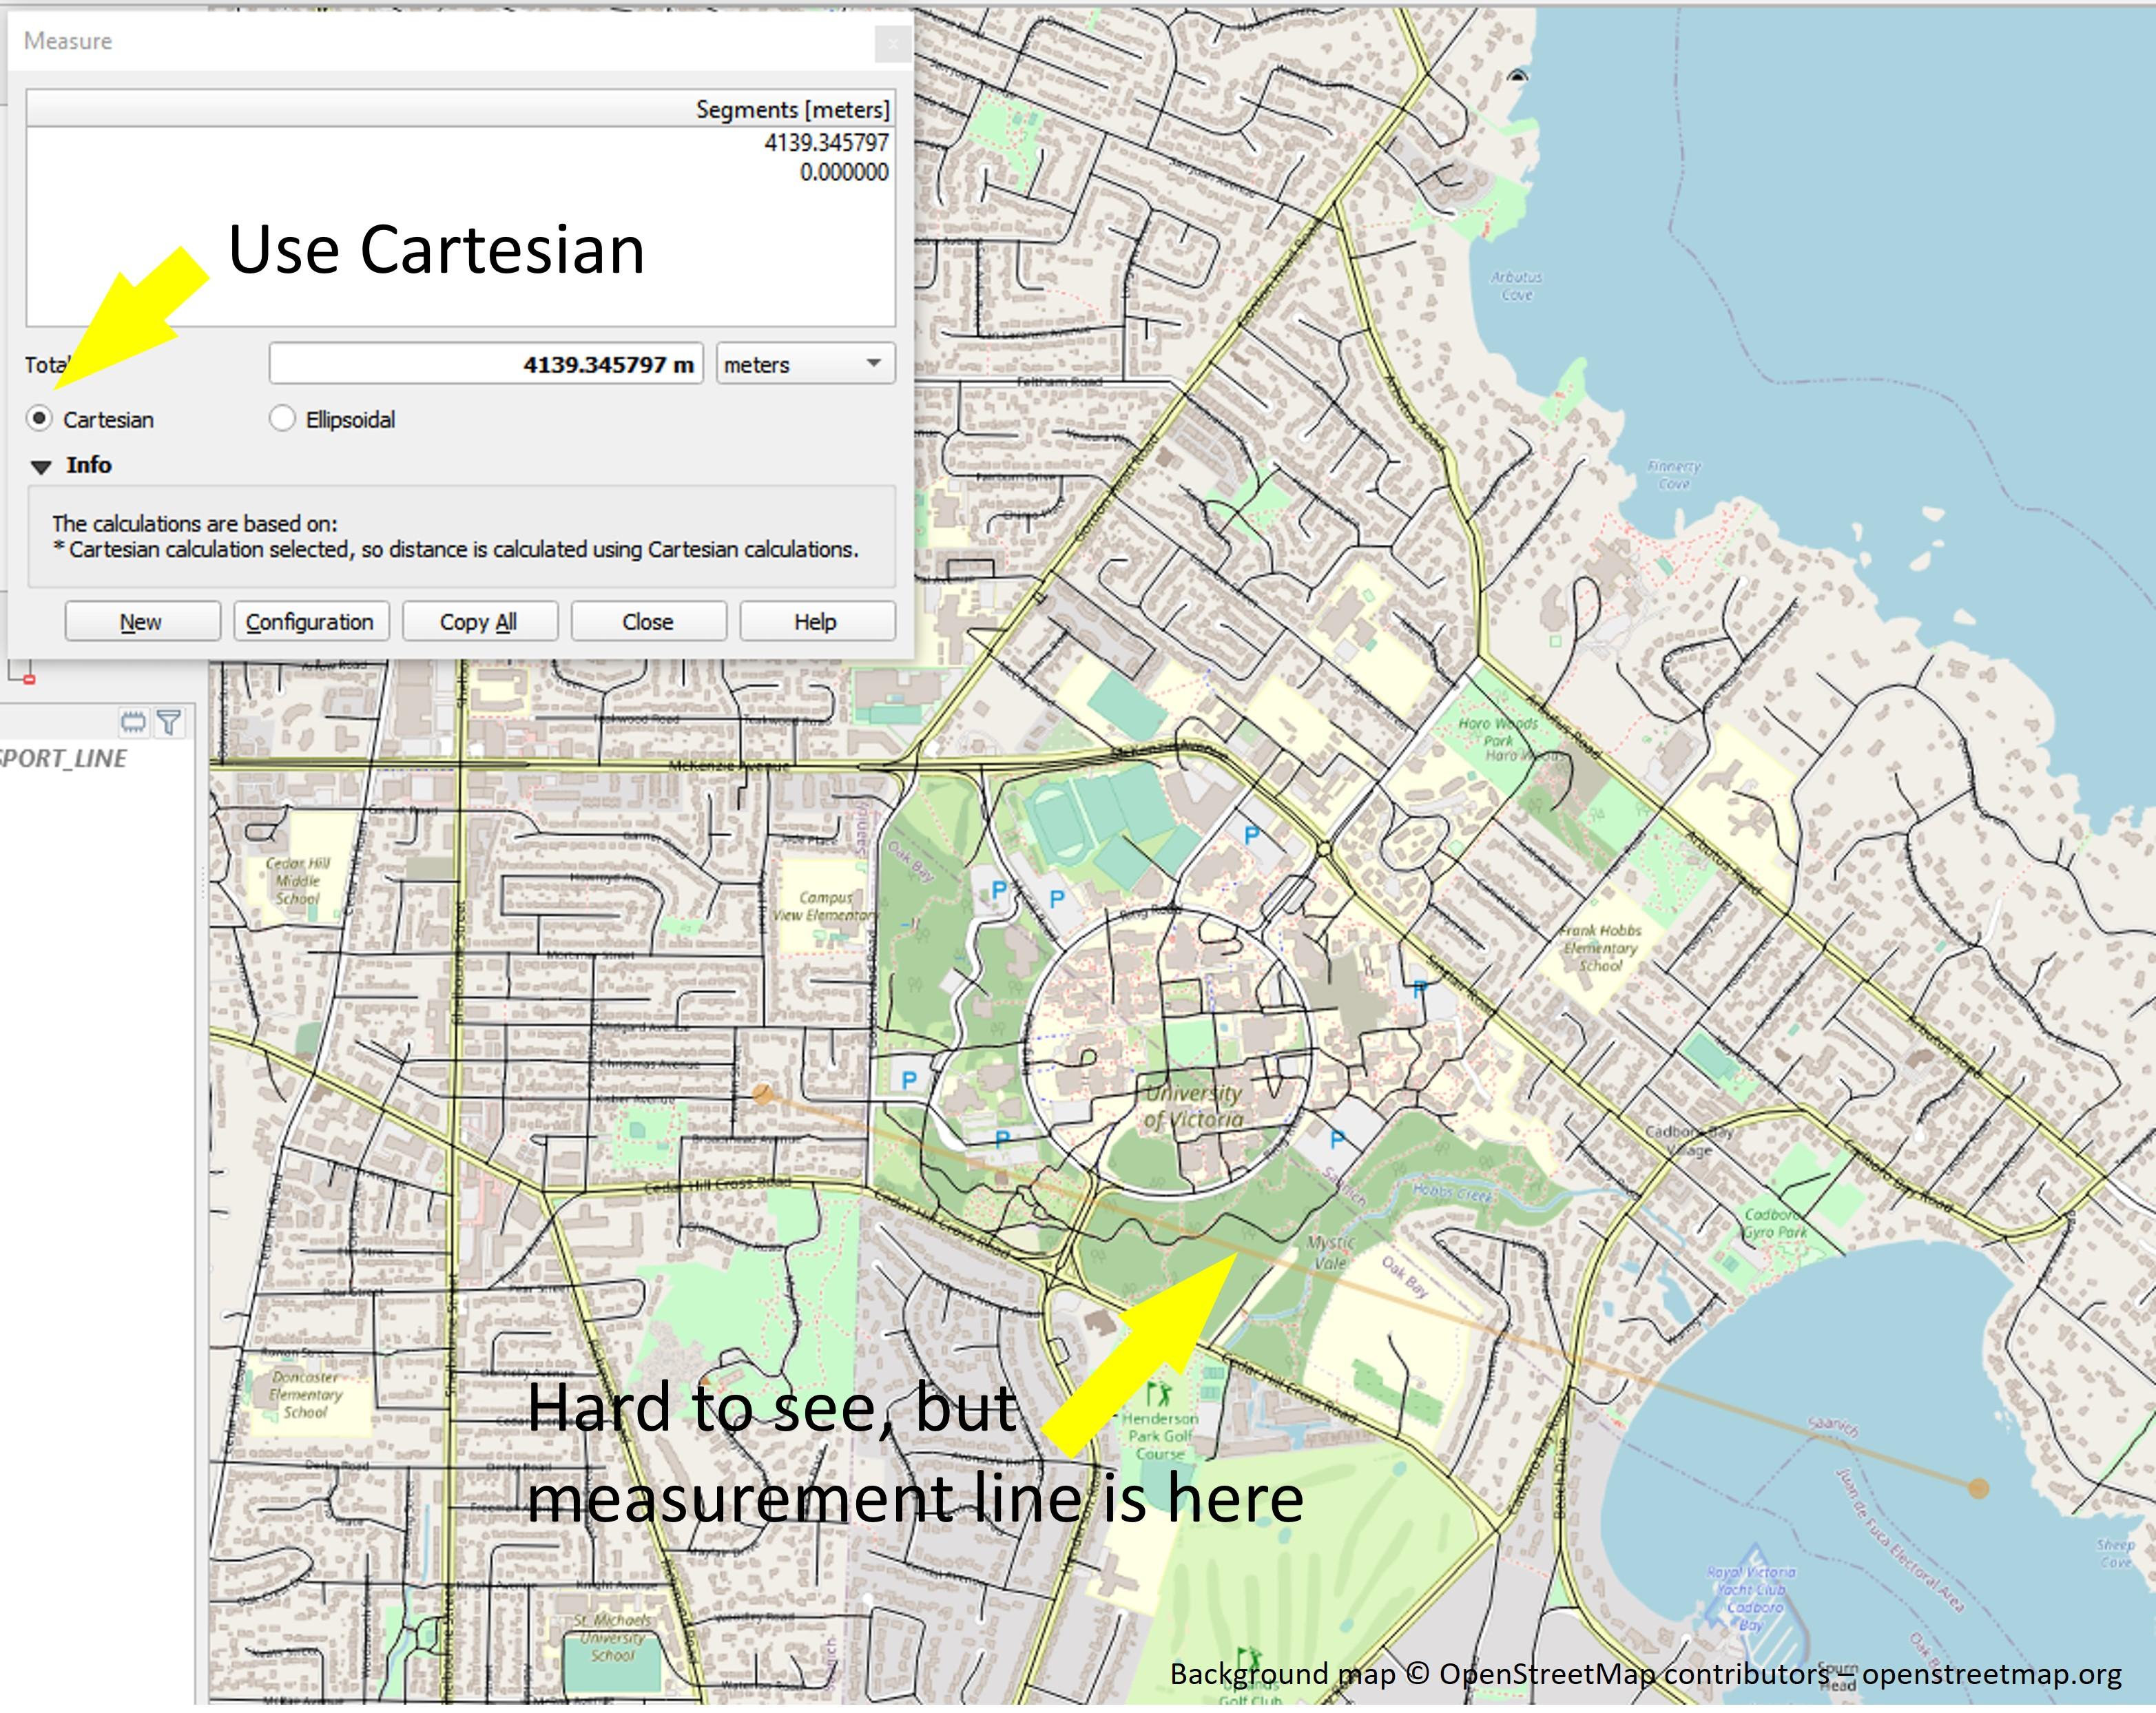
You'll need to convert between your map units and physical units, so think about how large you want your ornament to be. I usually figure about 4" is good for a large-ish ornament, which is about 100mm.
Next, figure out how large of an area you want to cover with your map. For my ornament, I want to get the university campus and hit the ocean in the surrounding area, so I'll use the measure tool to see how big of a distance that is. Keep in mind that the larger of an area that you cover, the thinner and more fragile your roads will be in order to fit them all on the ornament!
In the 'Measure' tool, select 'Cartesian' the method. My distance is about 4000m, so I'll plan to use that for the extent of my map!
Unit Conversion - VERY IMPORTANT AS IT WILL BE USED A LOT IN FUTURE STEPS
To convert between physical and map units then, we can calculate:
4000m (map units) /100mm (physical units) = 40m/mm
So every 40m on the map represents 1mm on the physical ornament.
Basic Overview and Pieces
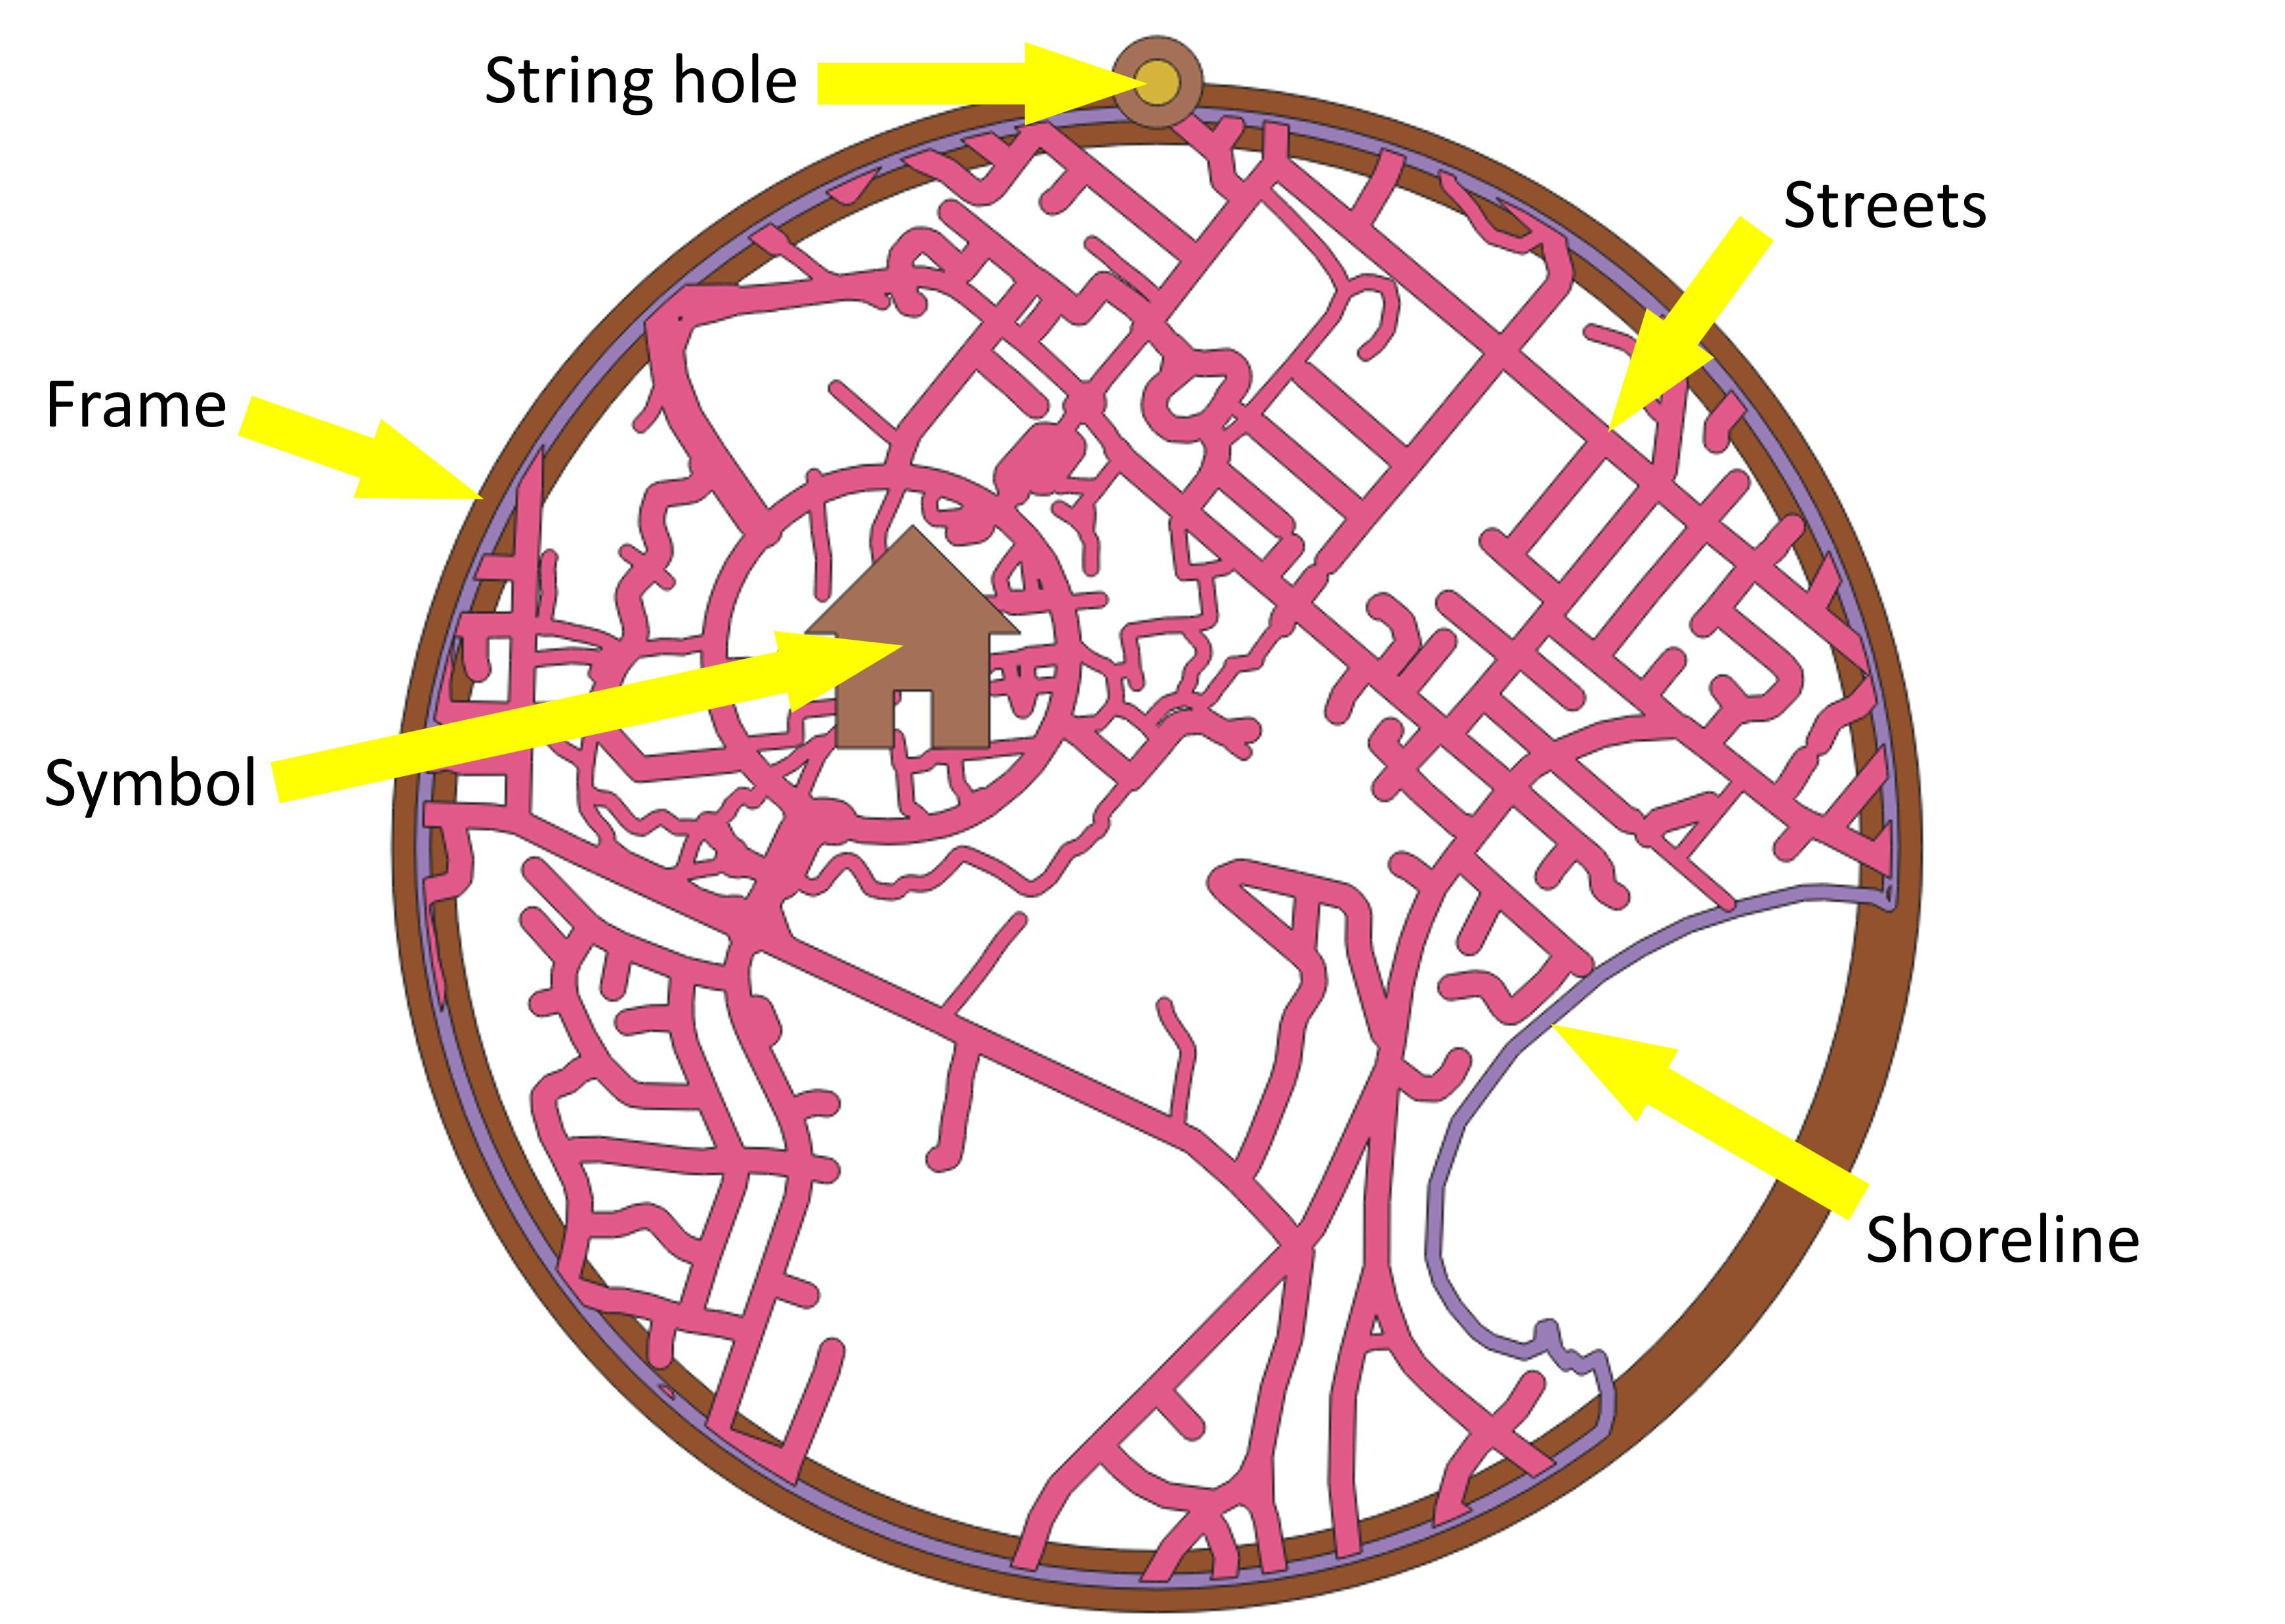
To do everything in QGIS, we need to think about our ornament in terms of the pieces that we need to create it. From there, it's easier to understand the processes that will be introduced in the following steps.
- Frame: The frame is created by making two squares or circles, then subtracting one from the other to make a ring.
- String hole: The string hole is created similarly to the frame but at a smaller scale. The "outer" part of the string hole is added to the frame first, then the "inner" hole is subtracted from it.
- Streets: The streets are created from the road data imported earlier. In my case, I vary their thickness based on the number of lanes, but this may not be an option for you depending on the data that you have.
- Symbol: I like to etch a heart or house shape into my ornaments. Other shapes can be added too, but may be tricky to create in QGIS if your goal is to avoid using other software!
- Shoreline [optional]: Obviously not applicable if you're far from the water :) I added it to my ornament to provide additional context for my location. It's created from the land border data.
Frame Creation Part 1
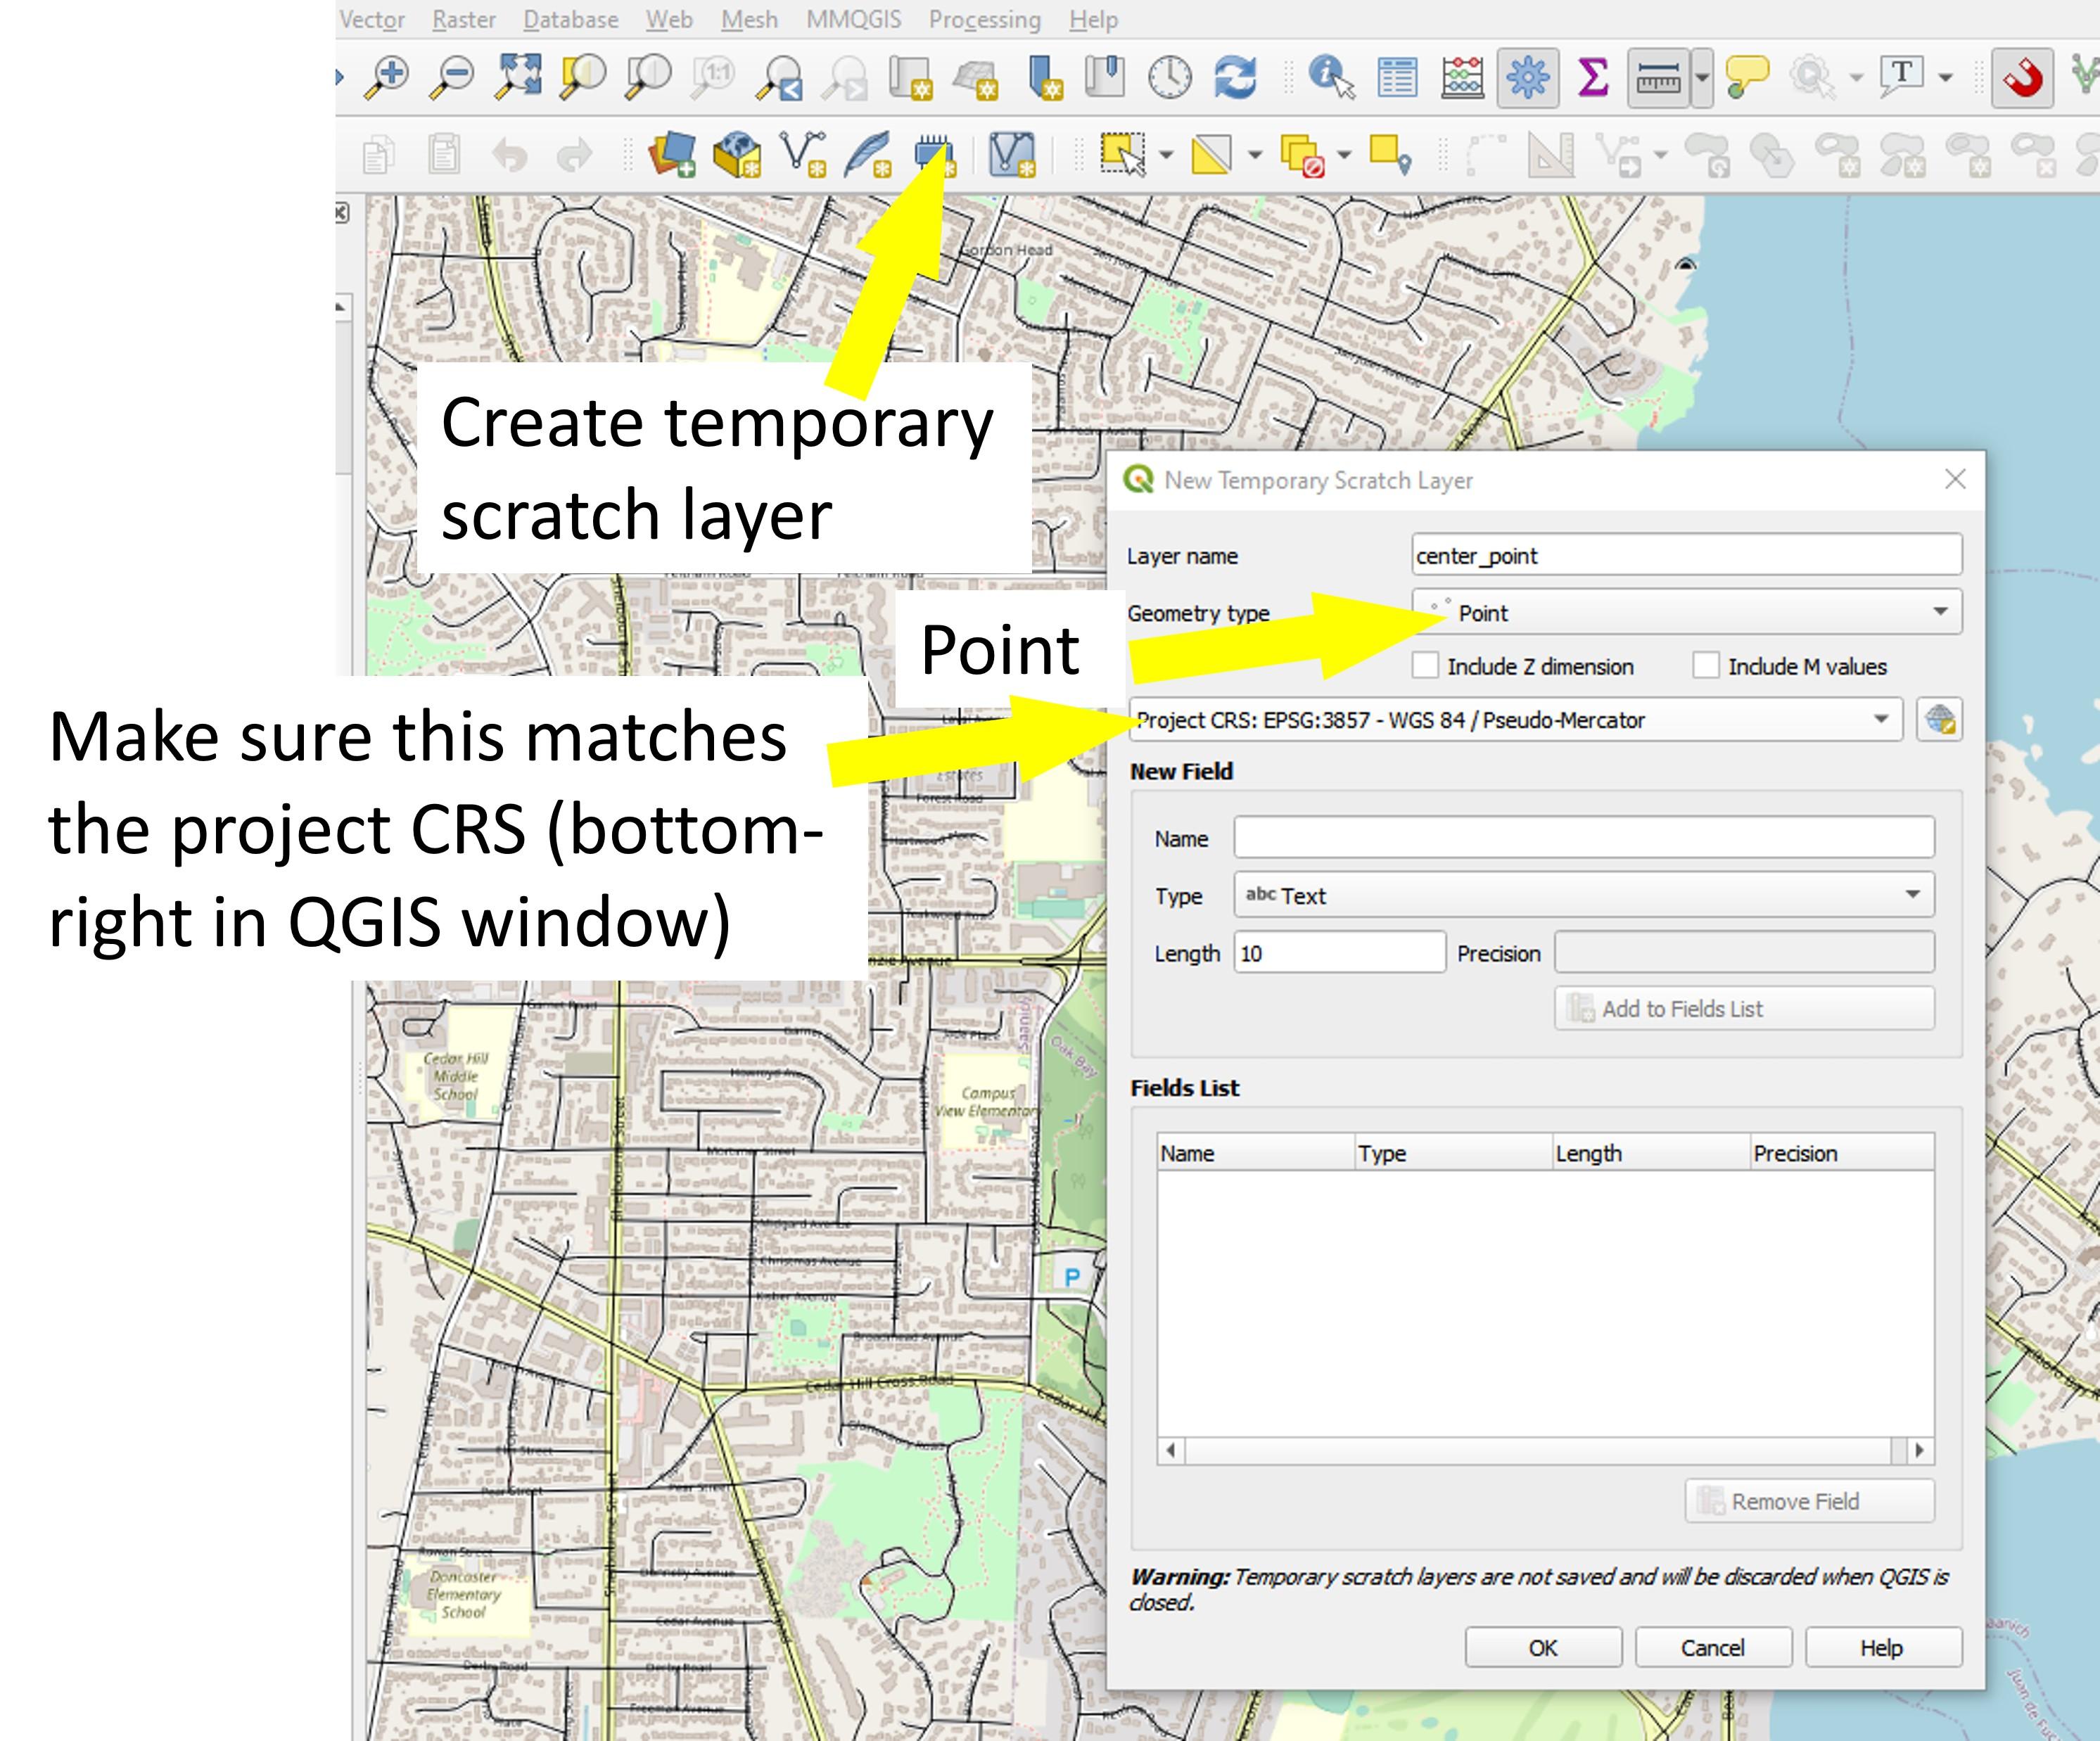
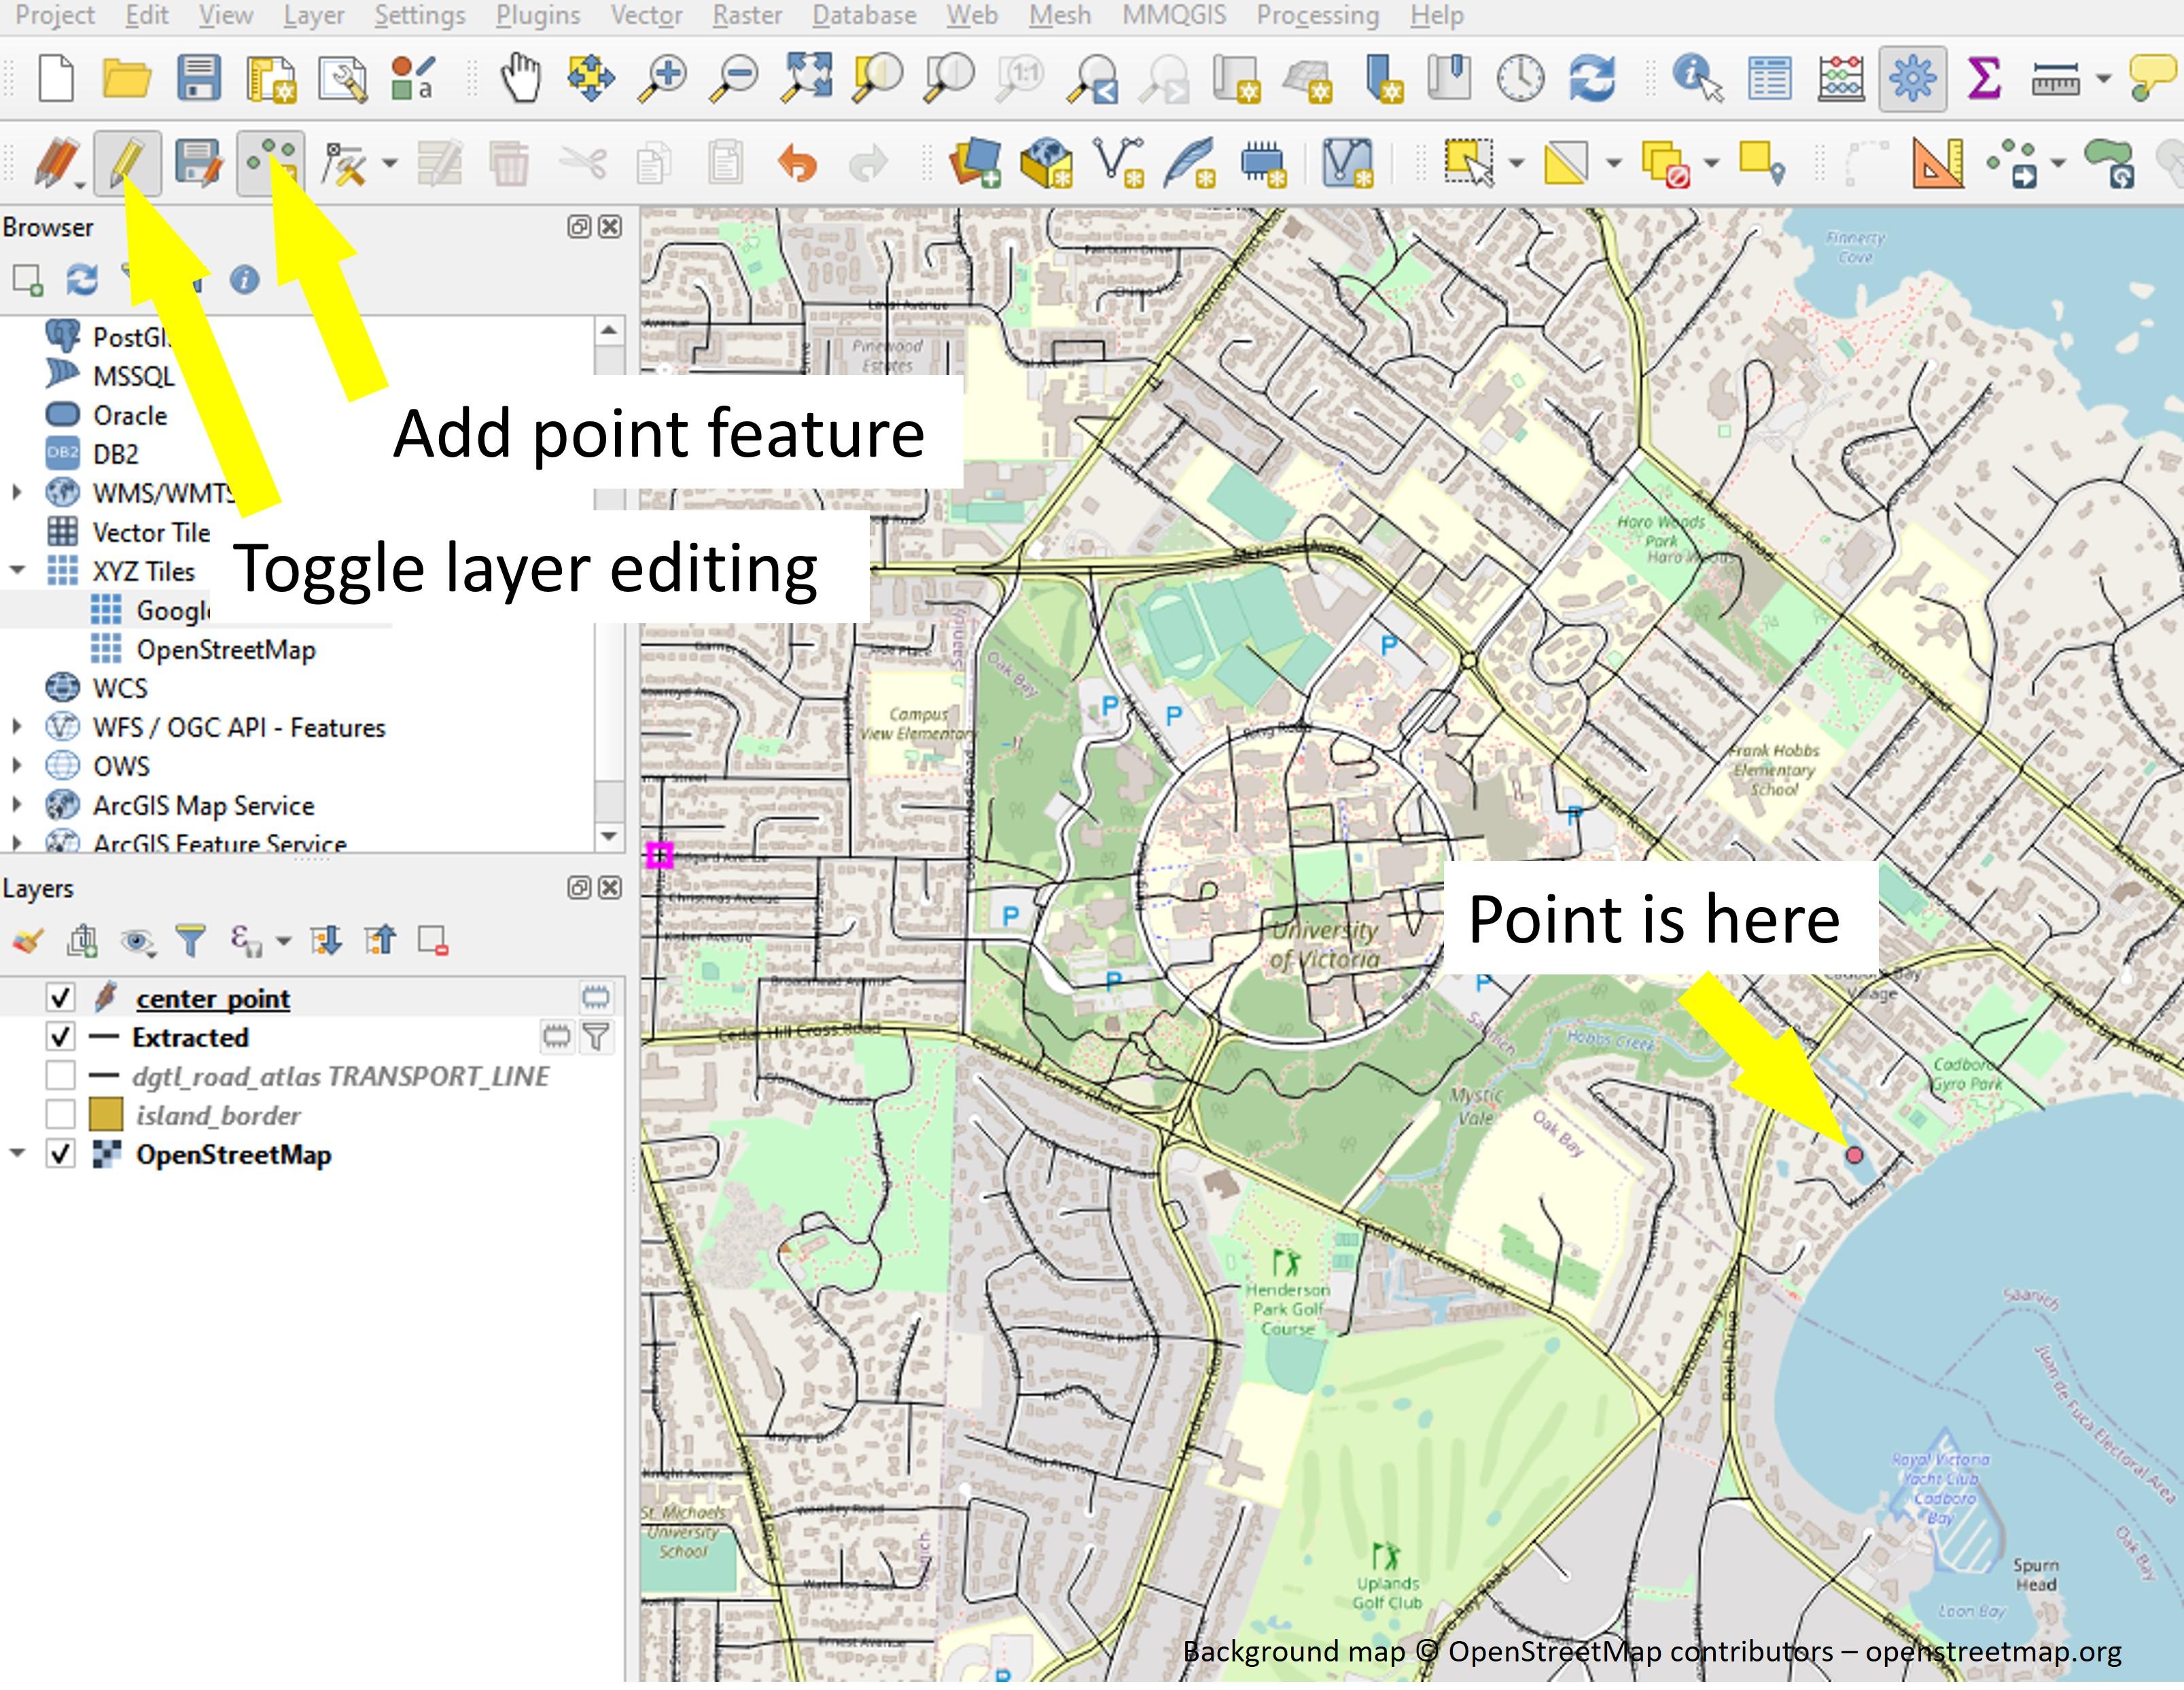
To create the frame, we'll create two concentric circles (or squares). I'm using a circle for this ornament, but the instructions for doing a square are similar. For a square, use the 'Rectangles, ovals, diamonds' tool instead of the 'Buffer' tool in Step 1 below. In future steps, create and use outer, middle, and inner squares in the same way you'd use the circles (this will become clear later).
Center Point
To make a circle, we need a center point that we'll then buffer. I usually add the points by creating a temporary scratch layer (steps shown in images). My center point won't be in the same place as the symbol that I'll add later since I want to be sure to include some of the land/water border in my map.
Frame Creation Part 2
Outer Circle
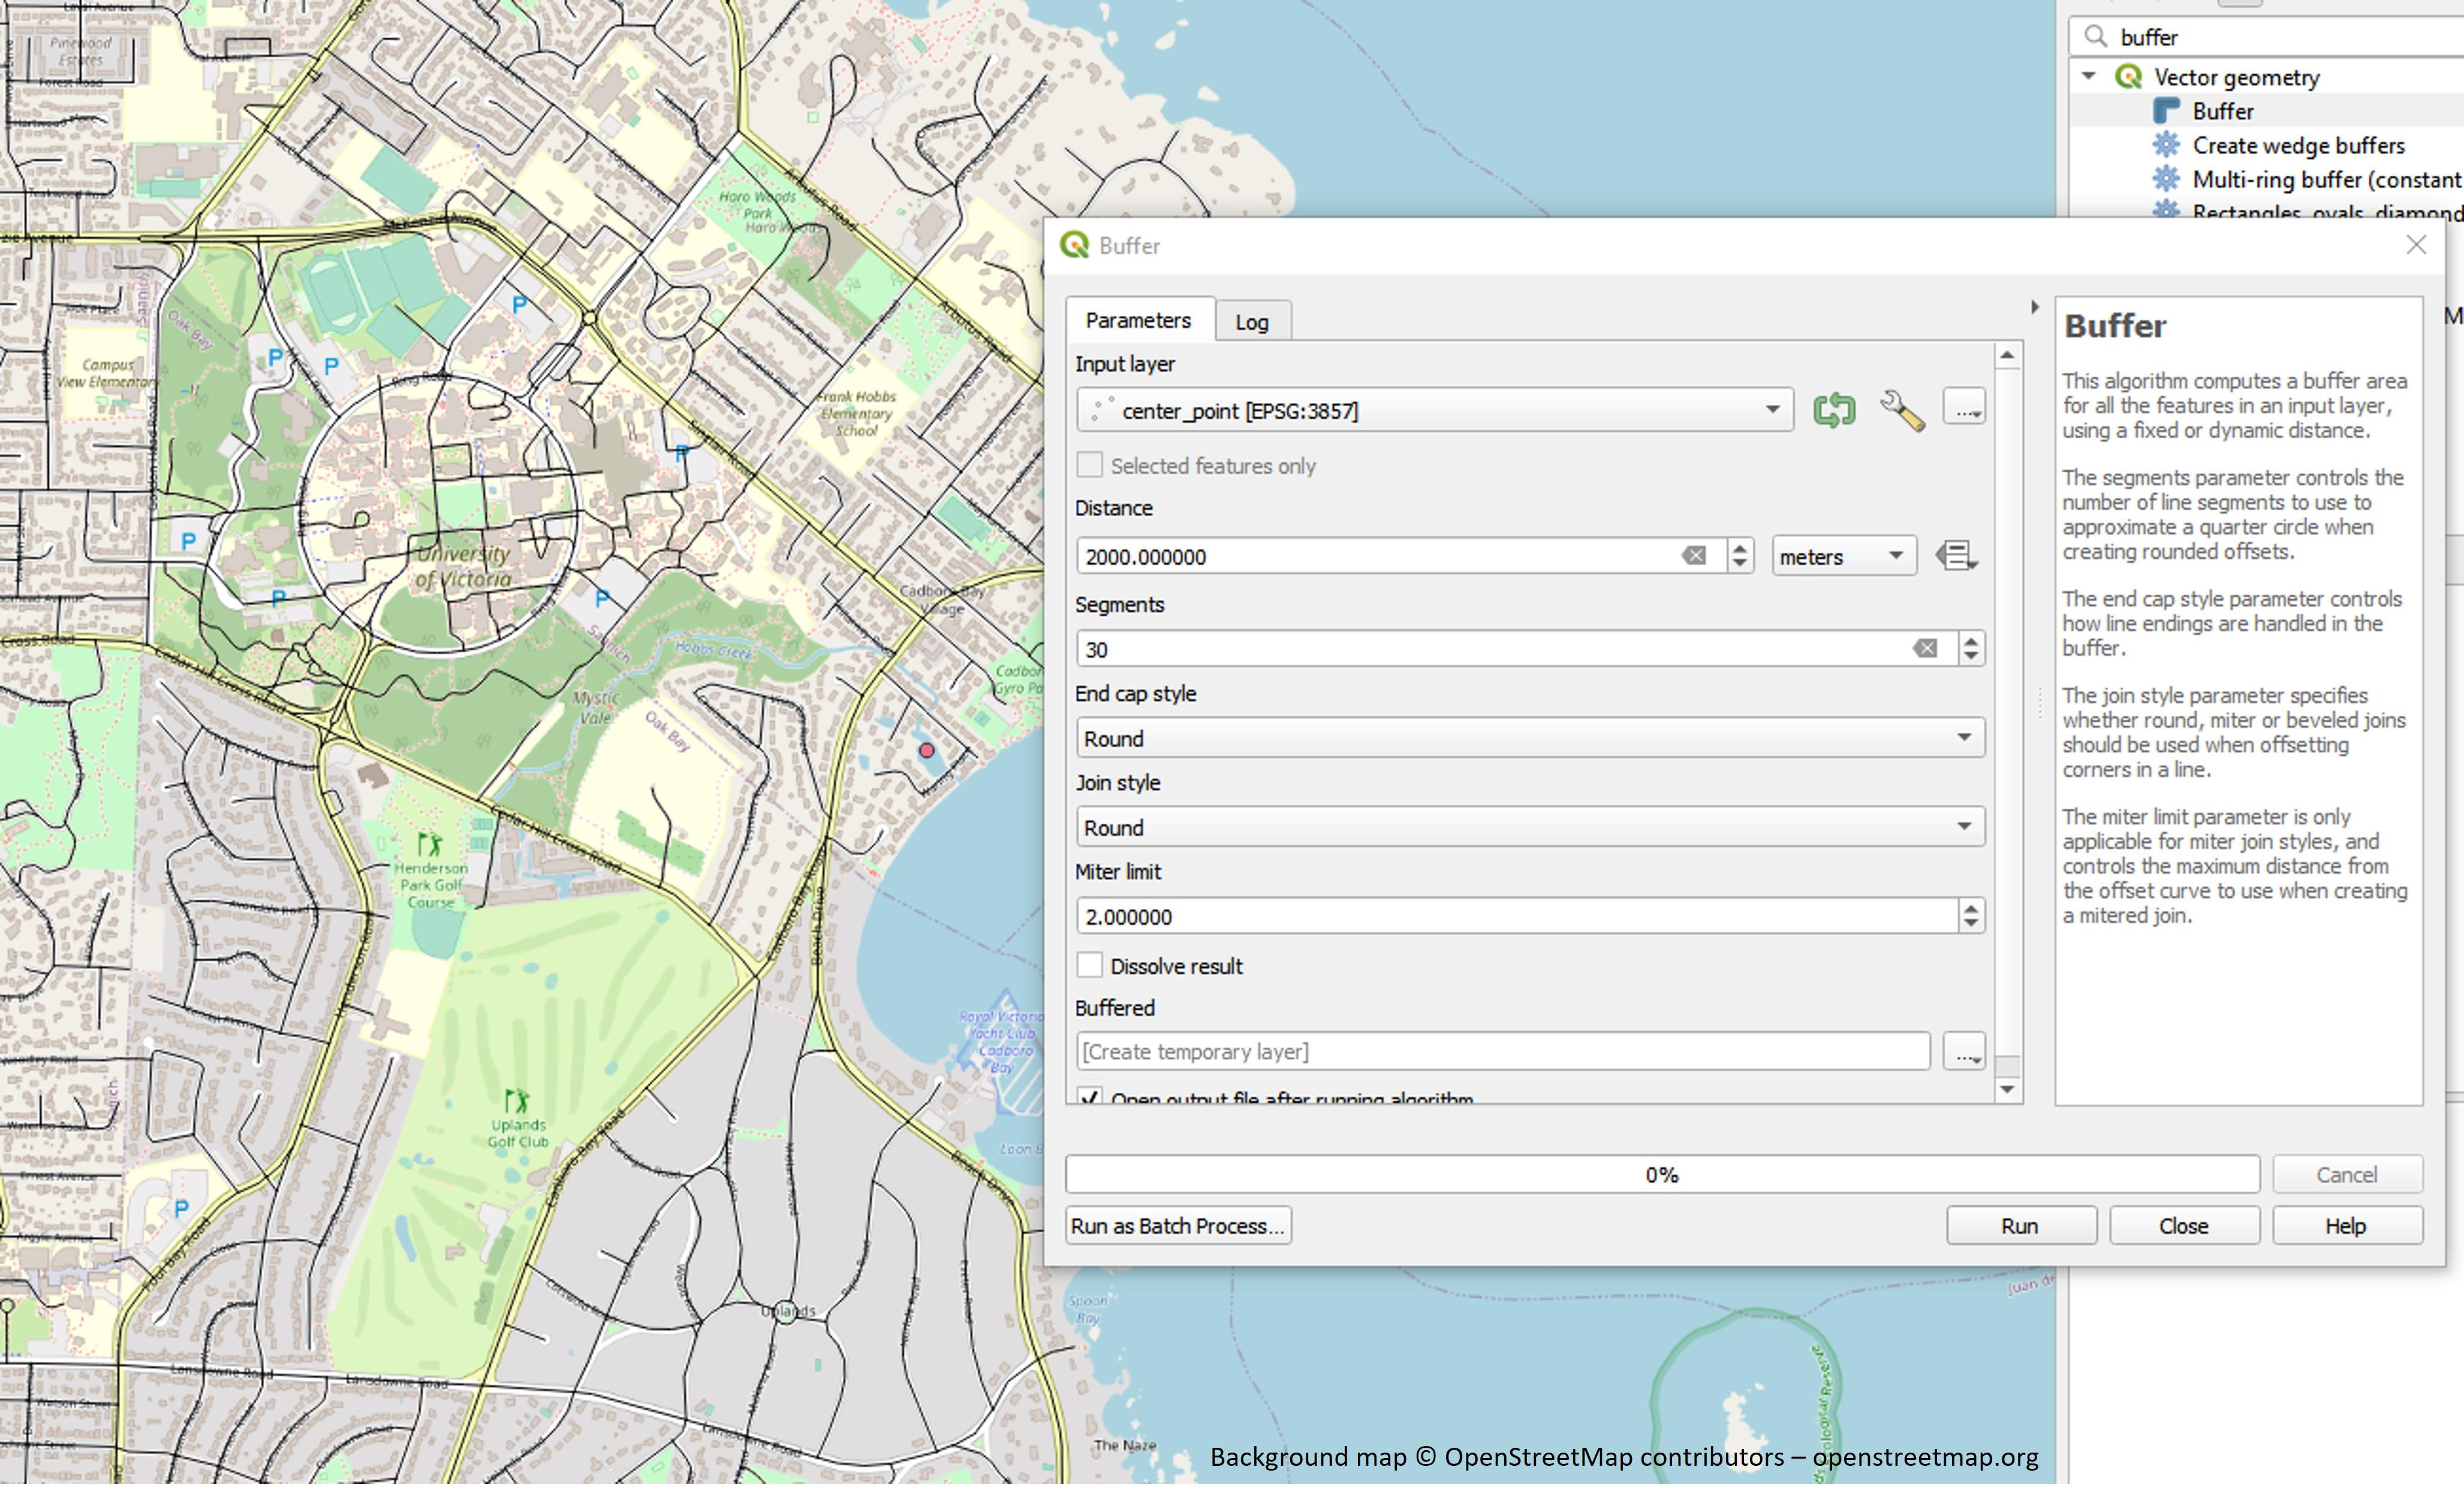
- [First image] Once you've created your point scratch layer and added a point to the map, use the 'Buffer' tool to create a circle around the point.
- The Distance for the buffer should be half of the total diameter of your ornament. In my case, the buffer distance is 2000 meters.
- Increase the number of segments to 30. This value is the number of individual line segments that make up 1/4 of the circle. QGIS doesn't handle curved line segments (this is changing, but it's not widely adopted yet), so it approximates curves with short line segments. I find that the value of 30 makes for a relatively smooth circle.
- The other values can be left unchanged.
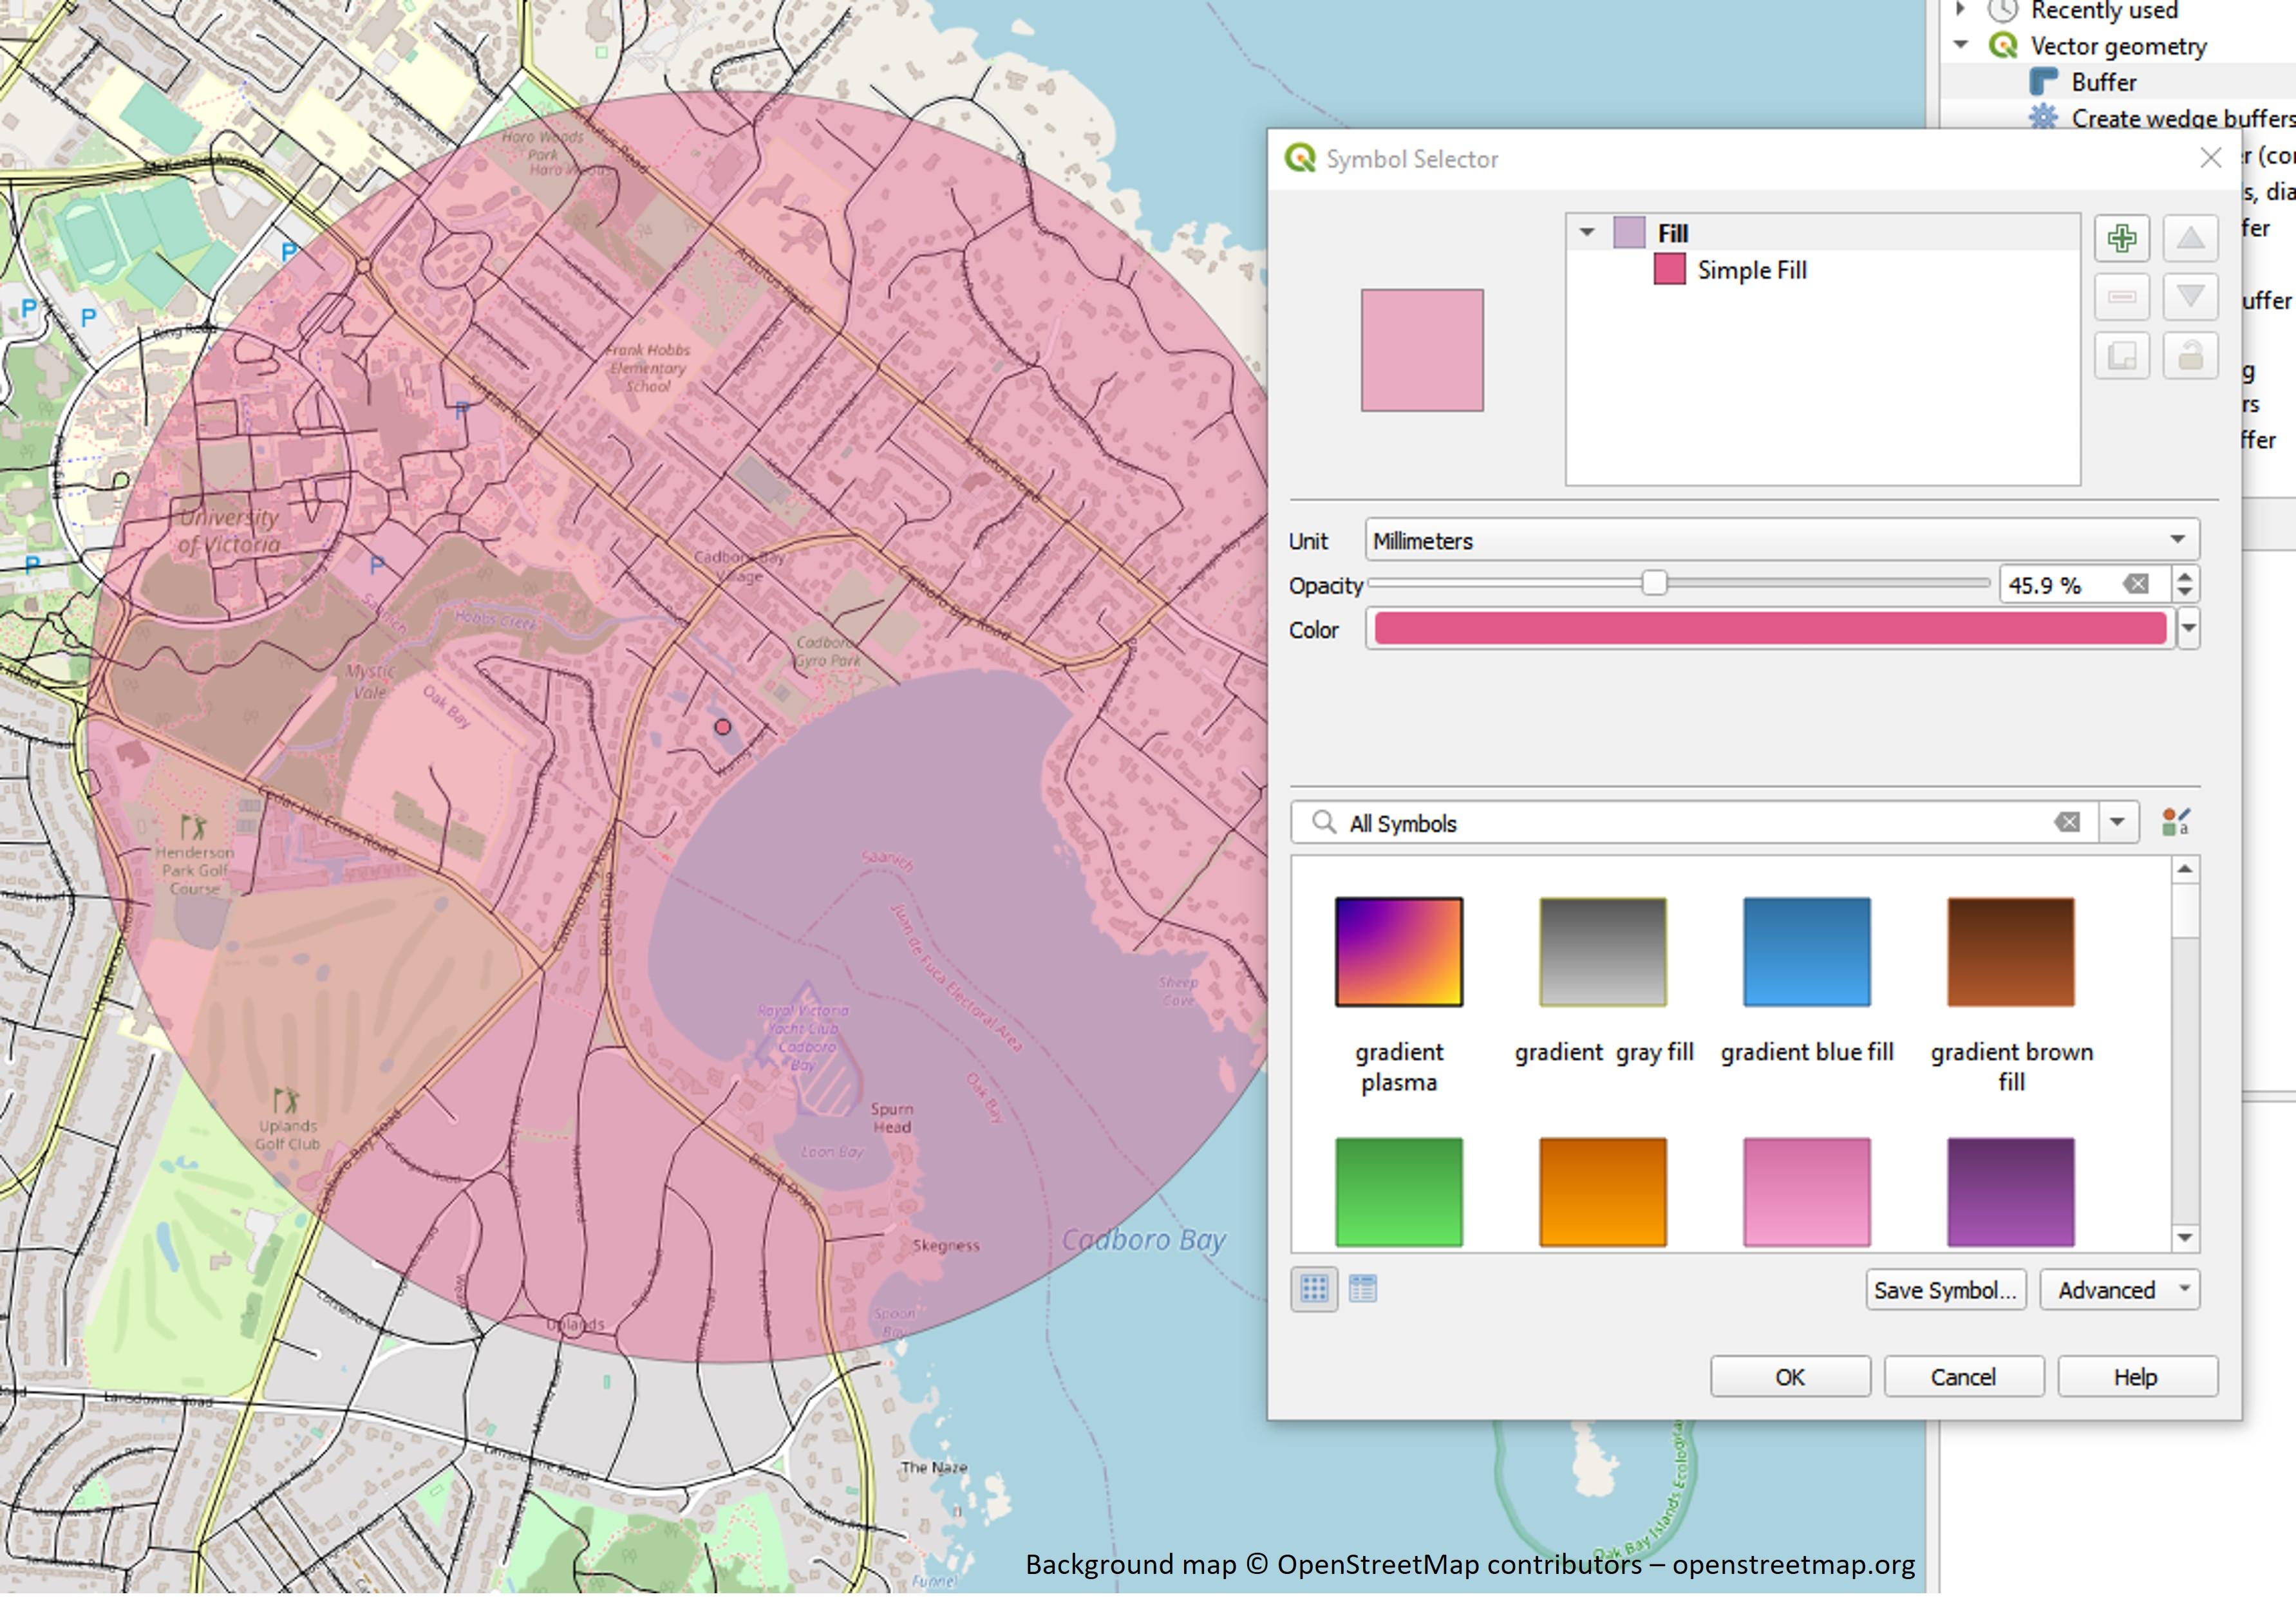
- [Second image] Notice that my initial circle doesn't include the University area, so I need to shift it around a bit. To do this, I'll change the styling of the circle to make it easier to see what's behind it:
- Right click on the 'Buffered' layer>Styles>Edit Symbol, and reduce the opacity so that you can see through the circle.
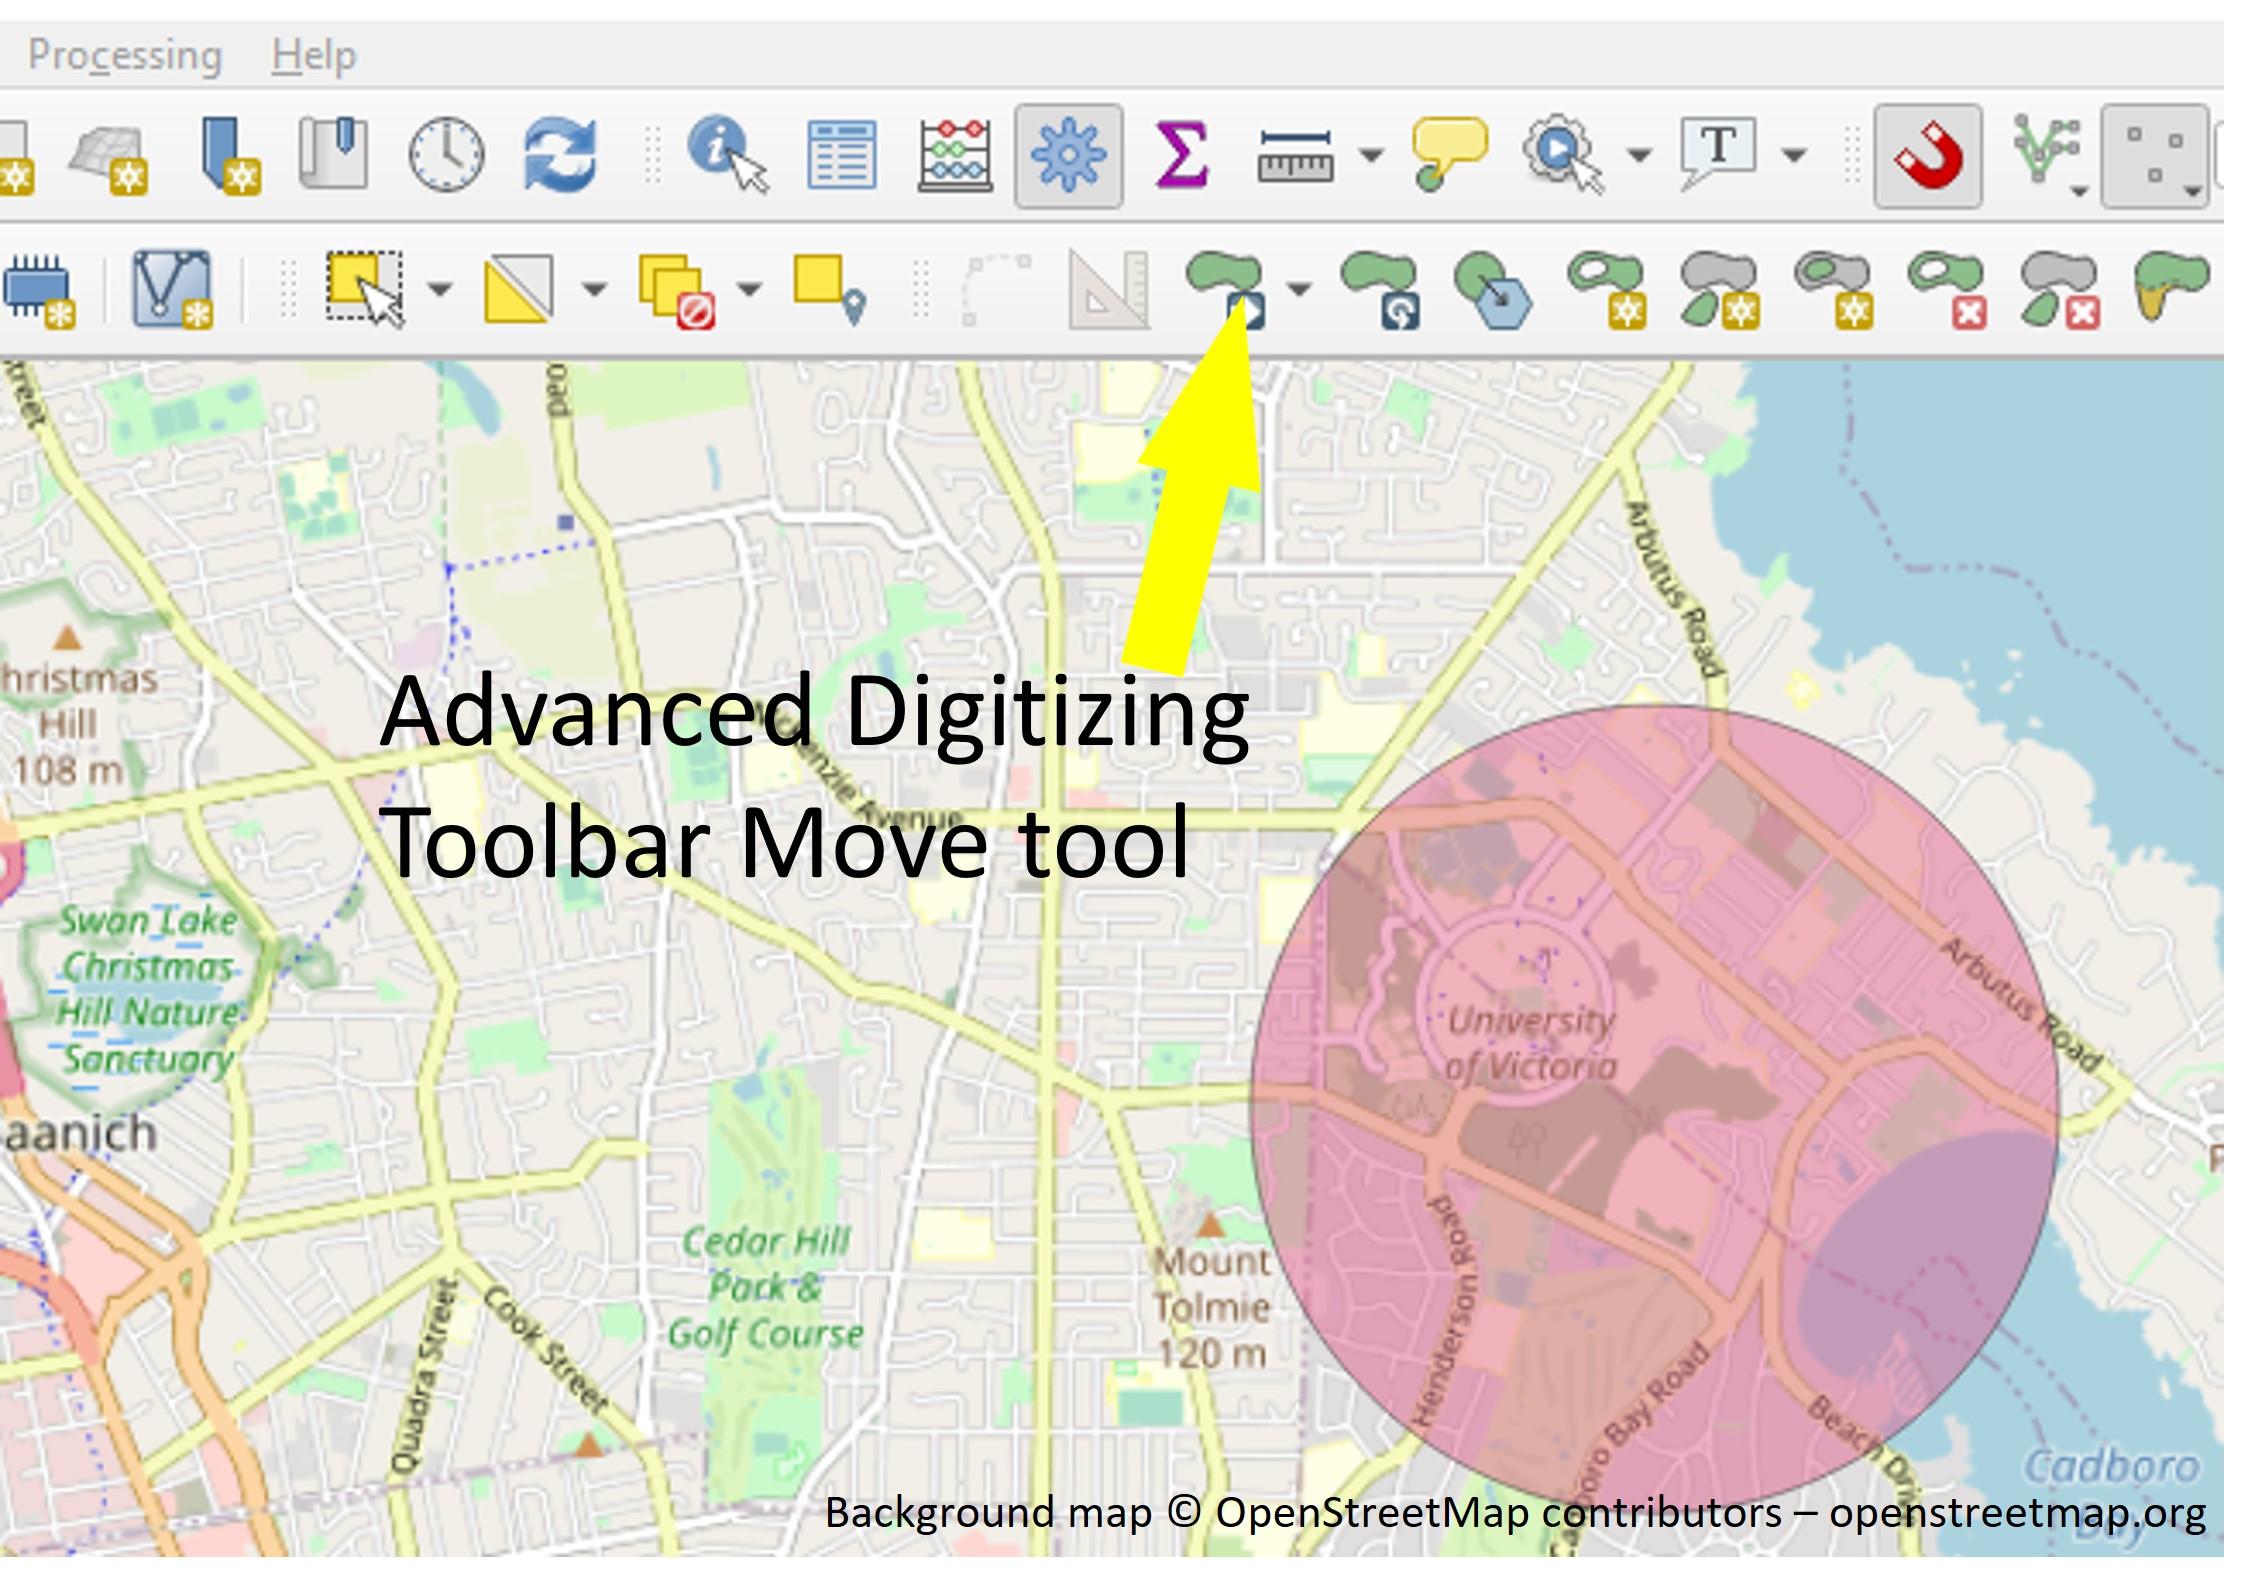
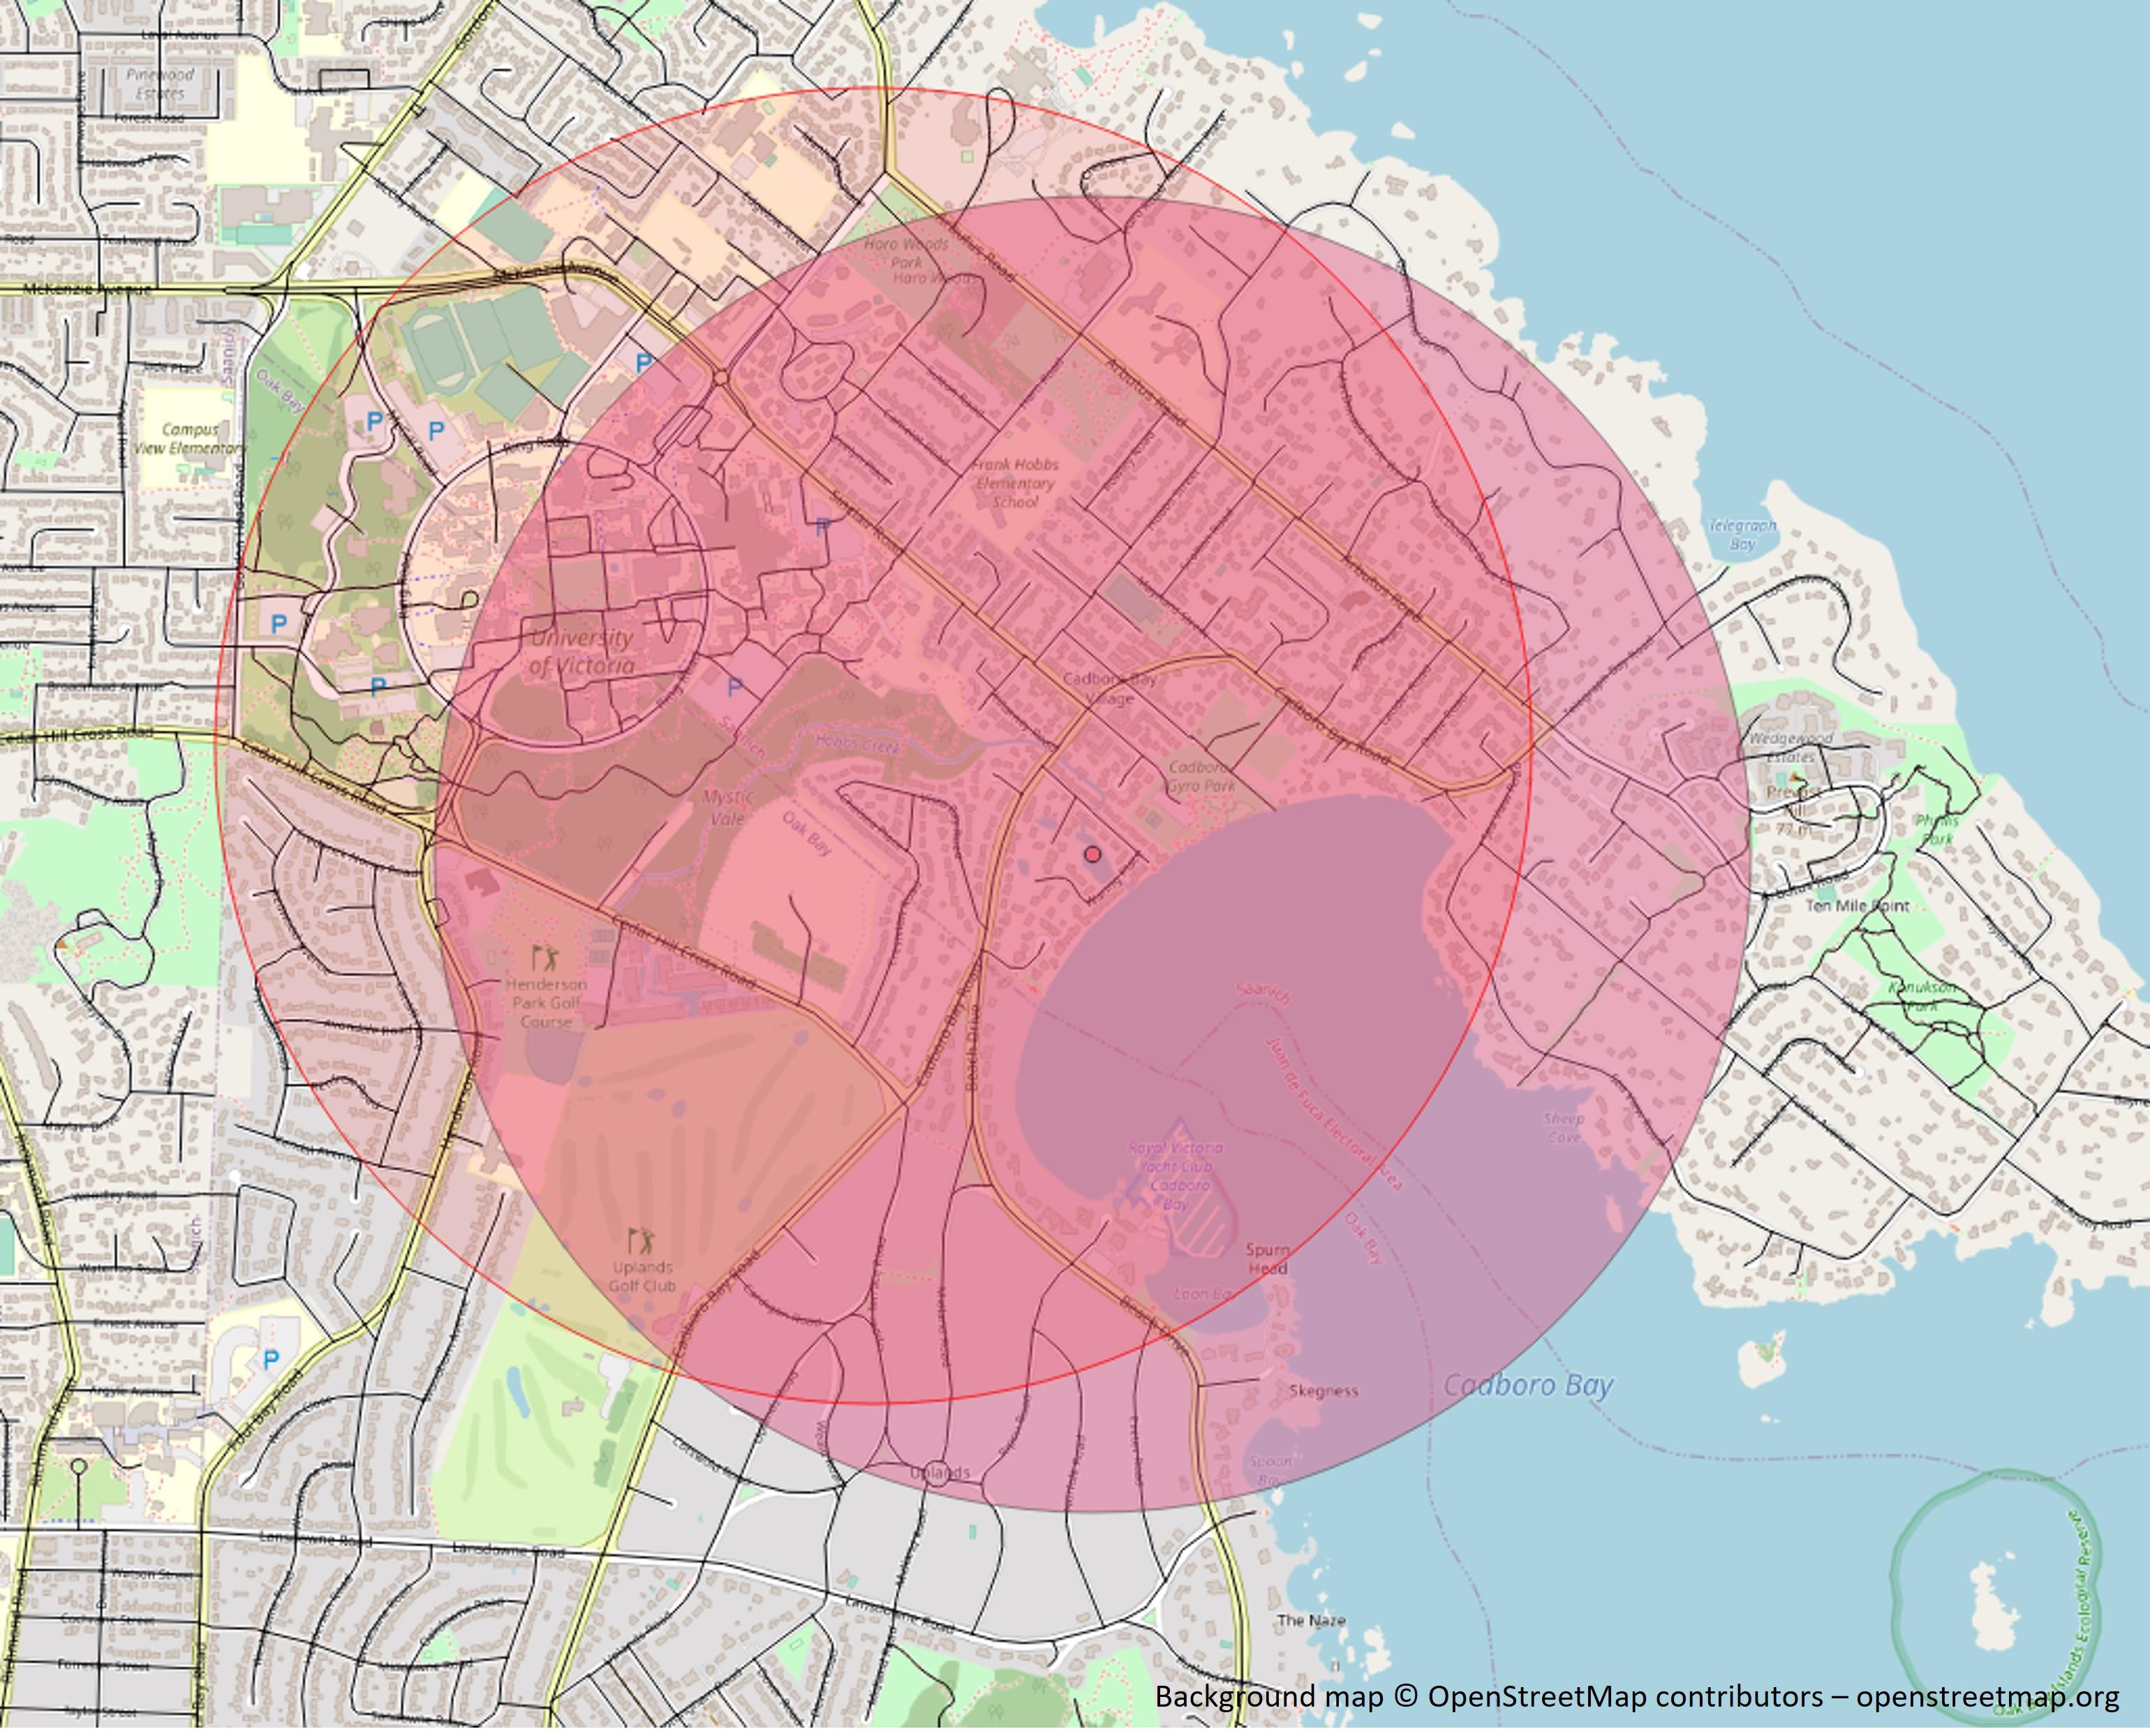
- [Third/Fourth images] To move the circle:
- Right click the 'Buffered' layer>Toggle Editing
- On the advanced digitizing toolbar, select the Move Feature icon. If you can't see the advanced digitizing toolbar, enable it with View>Toolbars>Advanced Digitizing Toolbar.
- Click in the map to select the circle, move it to where you want it, and click again to finalize the movement.
- Turn off editing of the layer in the same way that you turned it on, or by clicking on the Toggle Editing icon (pencil) in the Digitizing toolbar.
- Rename the buffered layer so you remember what it is. I renamed mine "outer_circle".
- Notice that if you move the circle, the center point is no longer at the circle's center. If you move the circle, you can delete the center point as we'll be creating a new one later. If you didn't move your circle, leave the center point layer as is.
Inner Circle [Fifth Image]
The inner circle will be subtracted from the outer circle to make a frame.
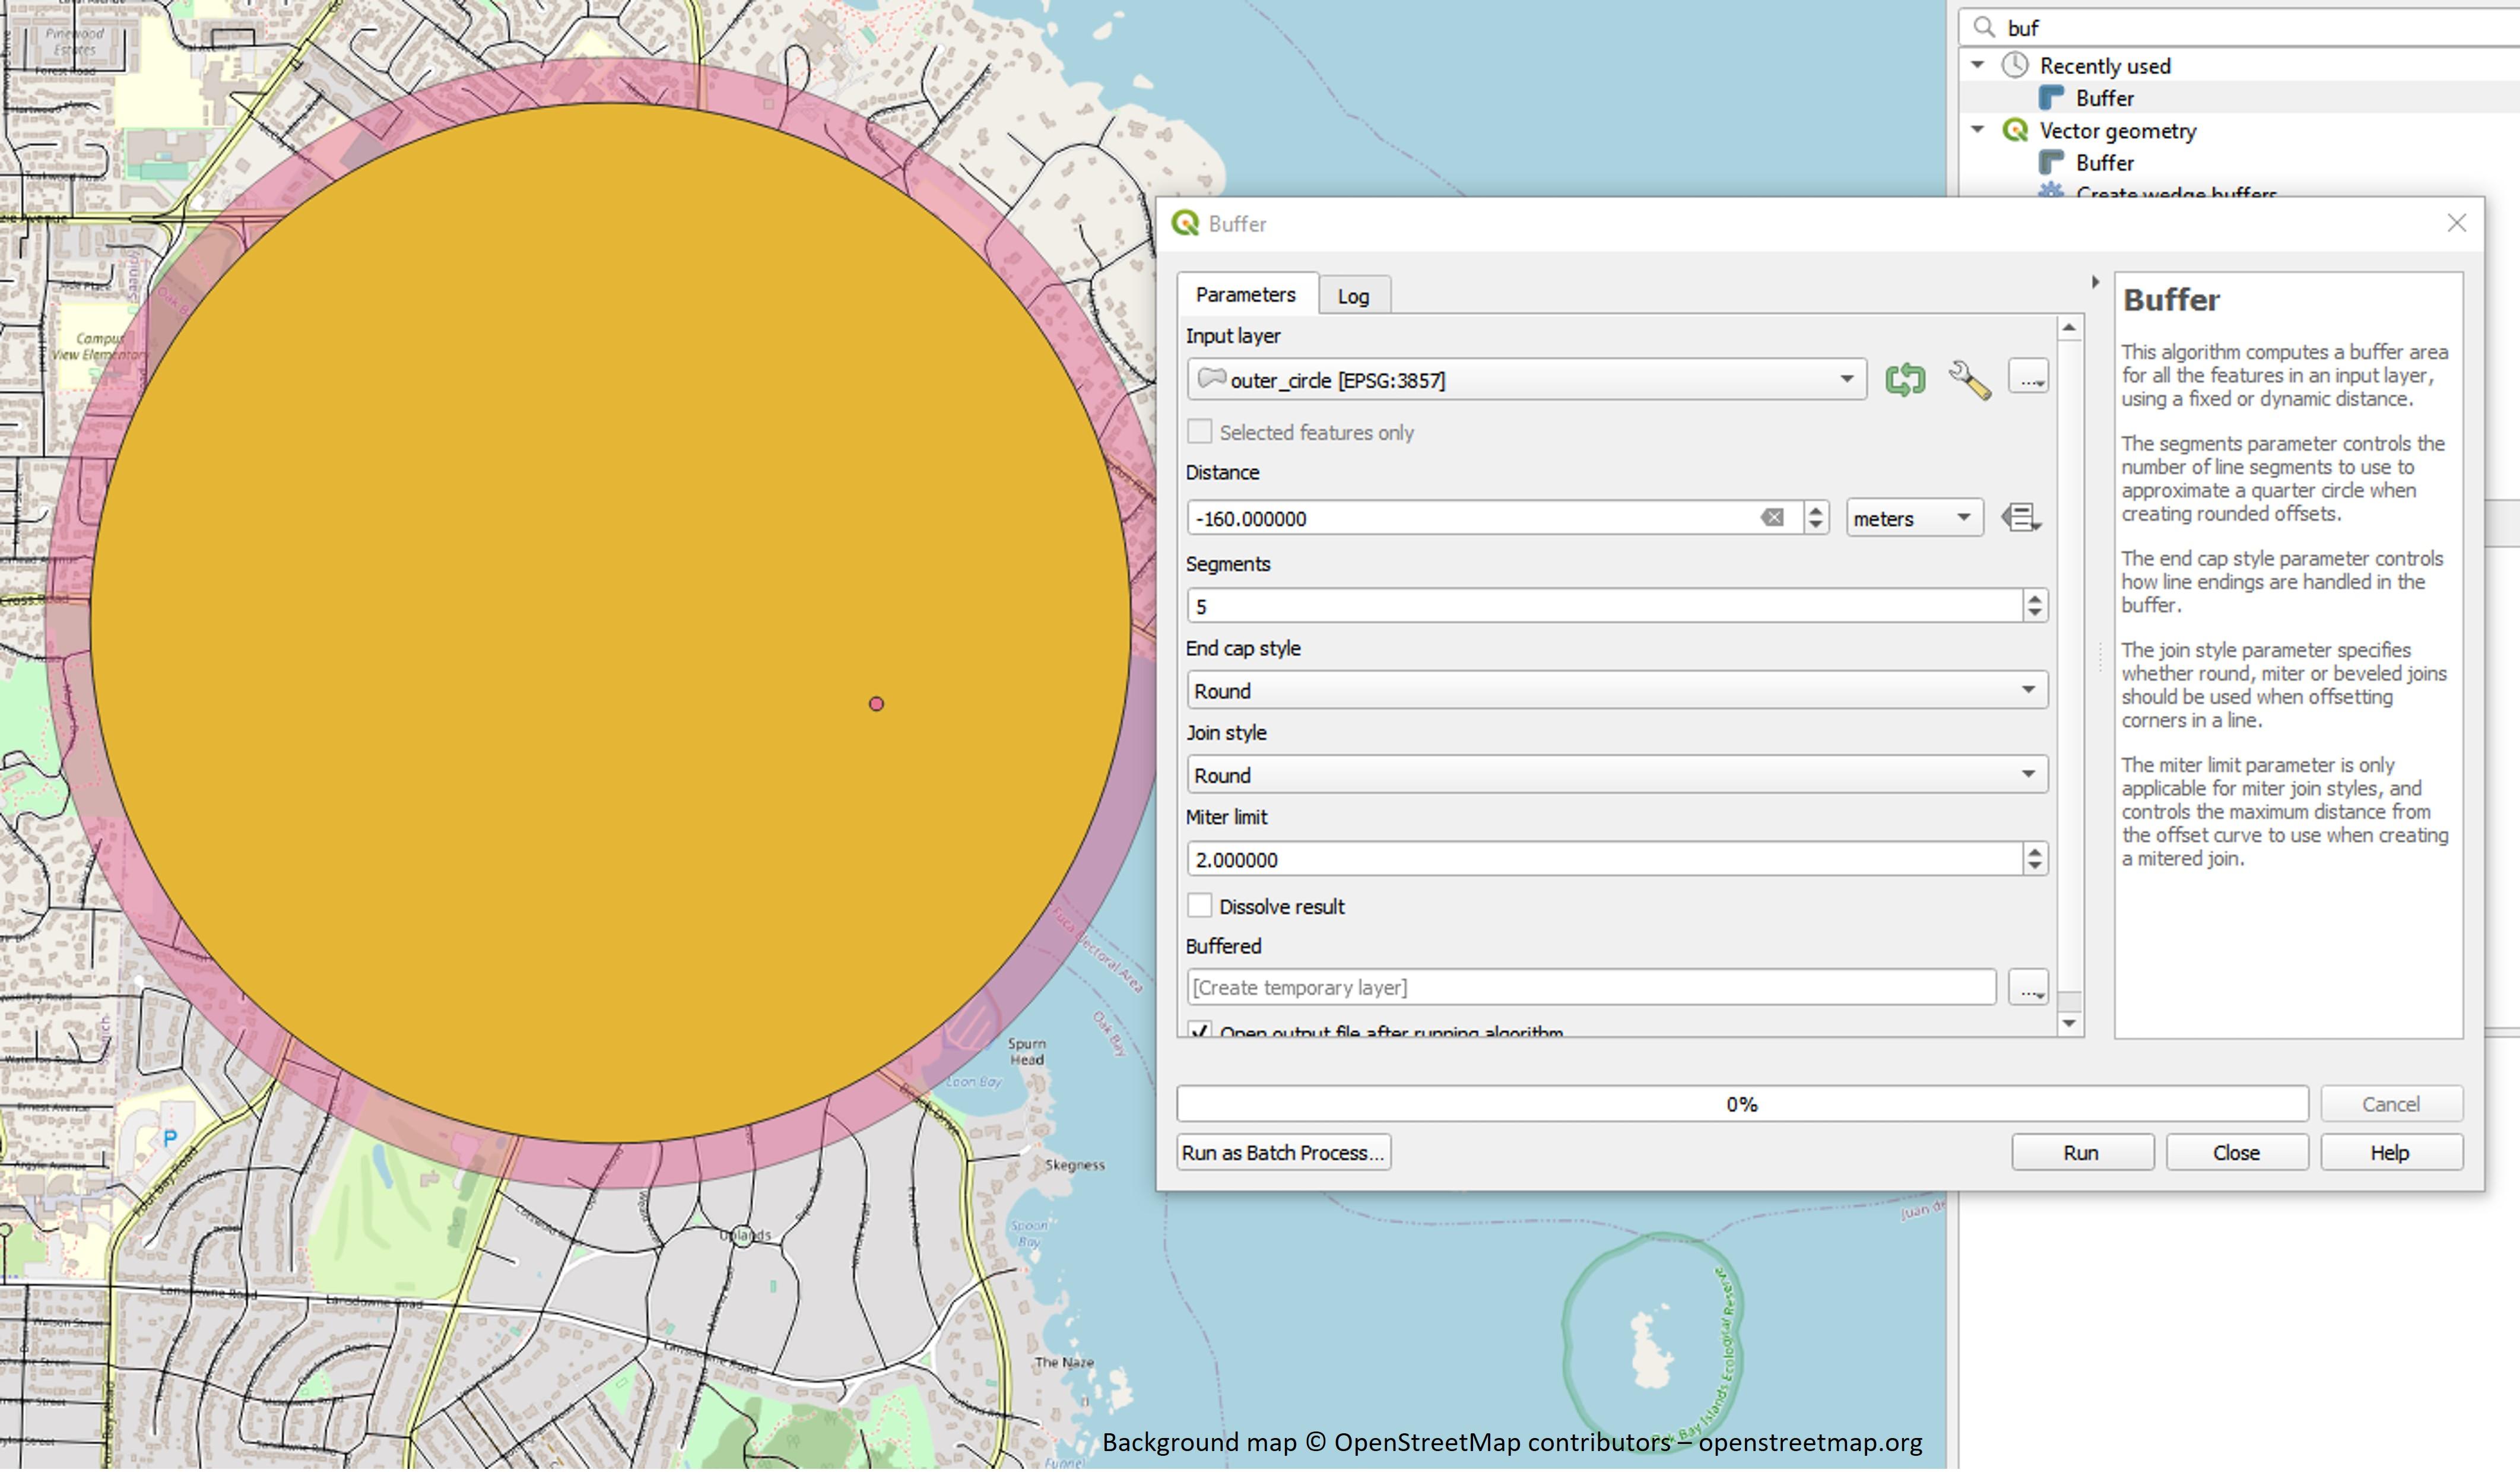
- To create the inner circle, select the outer circle layer, then select the 'Buffer' tool again.
- This time, the dimensions for the buffer tool will be whatever width you want to make the frame. I usually like my frames to be around 4mm, so my buffer distance will be 4mm*40m/mm = -160 meters. Notice this number is negative as it ends up creating a smaller circle!
- You can leave the Segments at the default value of 5, since this circle is being created from another circle rather than from a point, so the line segments already create a relatively smooth arc.
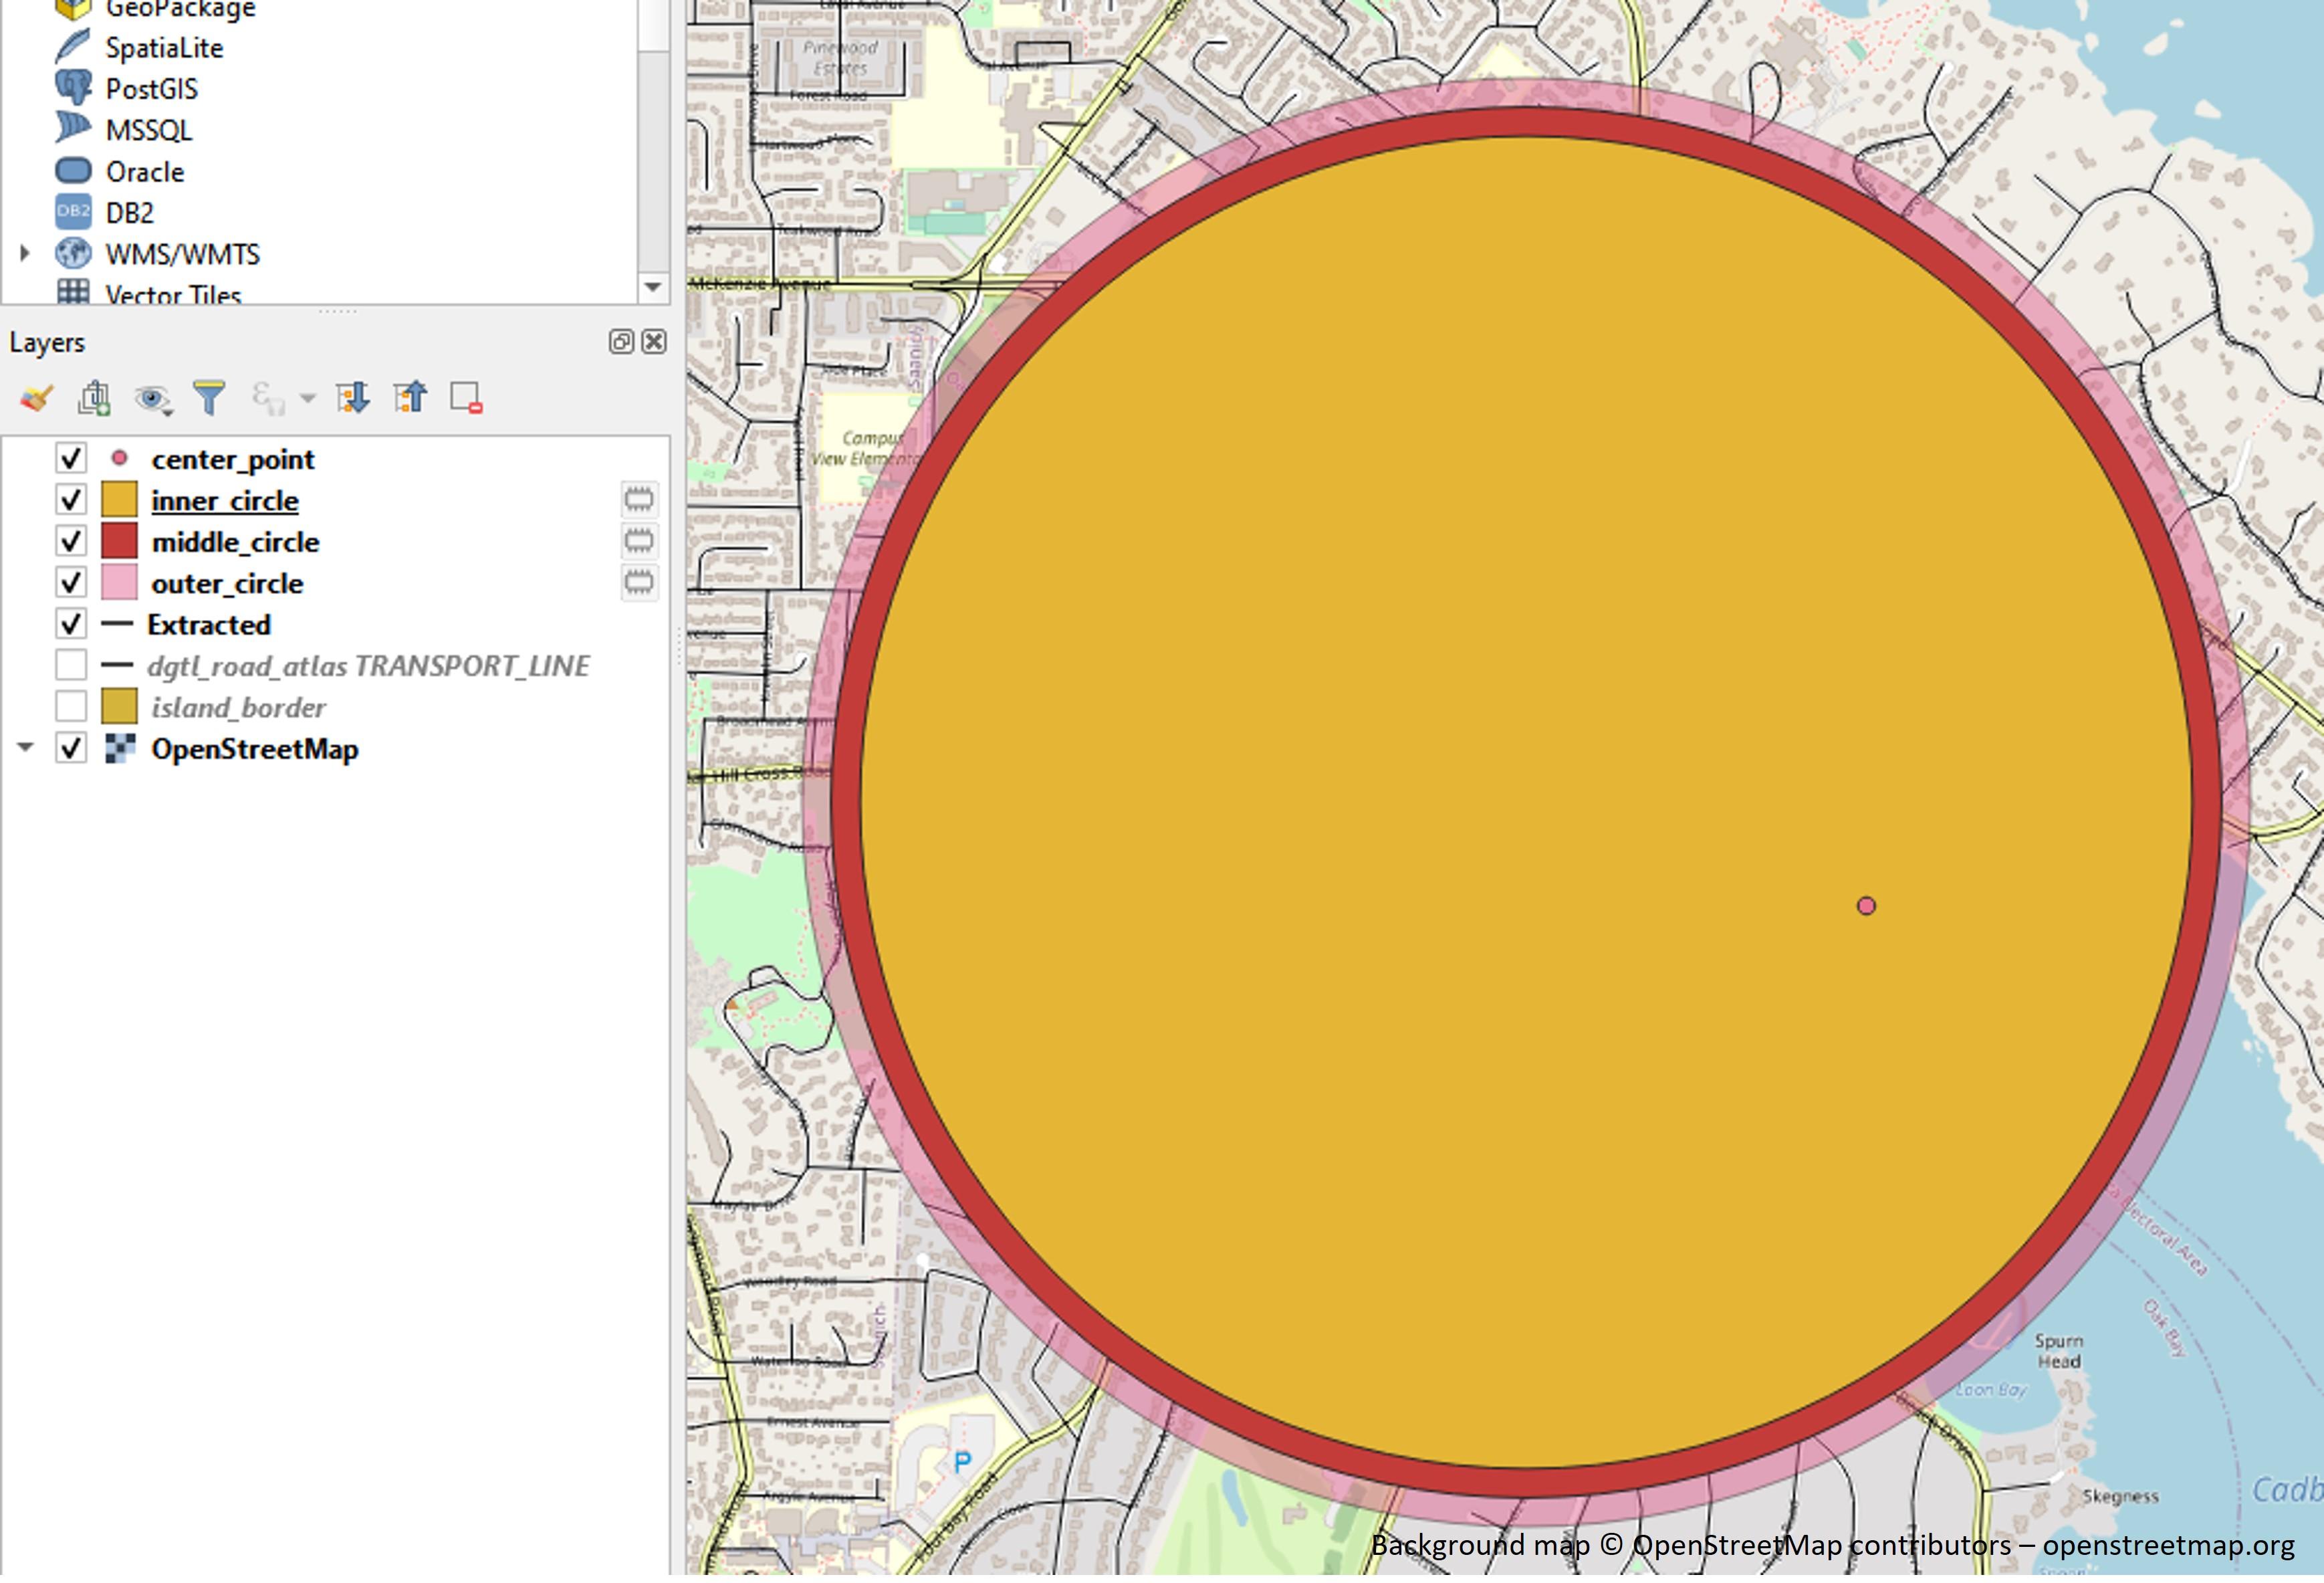
Middle Circle [Last Image]
We'll also create a middle circle that will be used for clipping some of the other layers in the map later. This will be explained in a bit more detail later, but for now, just trust that it will be useful!
- You can leave the Buffer dialog open from creating the middle circle, and this time use half the distance that you did for the inner circle. In my case, that's -80 meters.
Rename the inner and middle circles so that you keep them straight! Remember that you can always drag layers in the Layers panel to move them up and down on the map to change their visibility.
Frame Creation Part 3
We don't need the middle circle for now, so we can turn off that layer and instead just work with the outer and inner circle. As mentioned in the previous step, we'll create a new center point for the circles that will come in handy later.
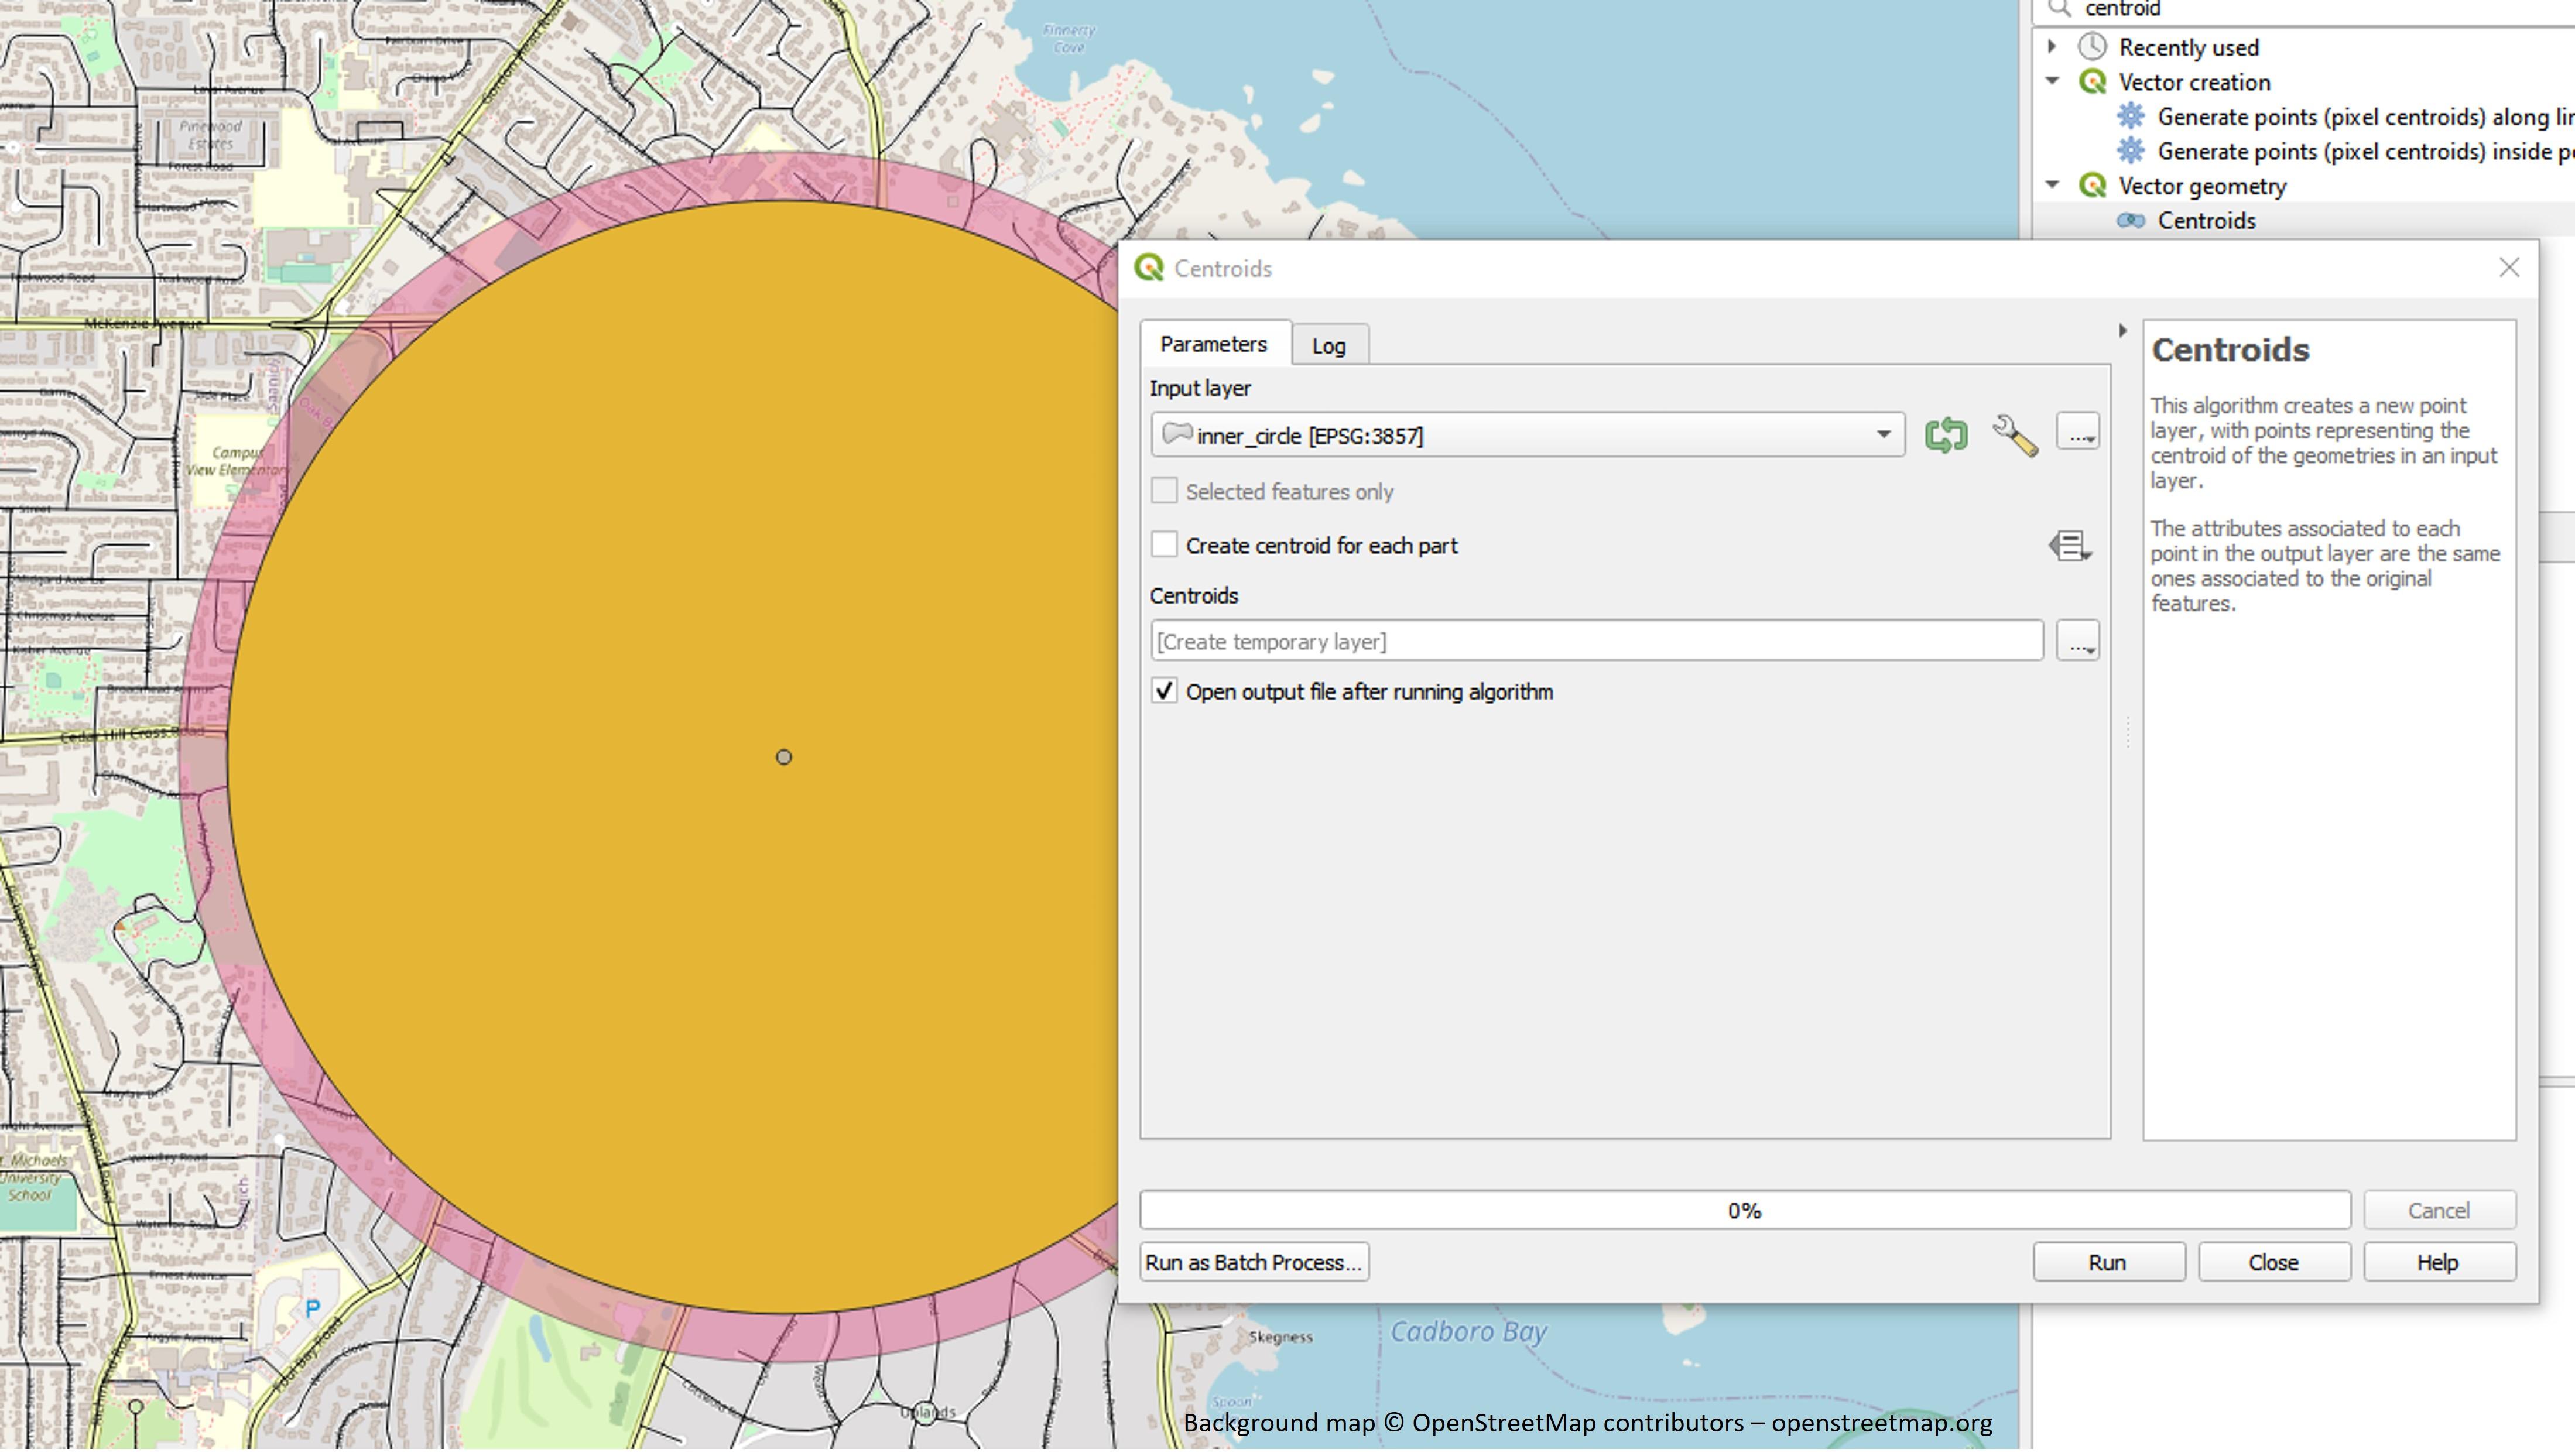
New Center Point Creation [First Image]
To create a new center point:
- Select any one of the circle layers in the Layers panel.
- Select the 'Centroids' tool from the processing toolbox and run it to create an updated center point.
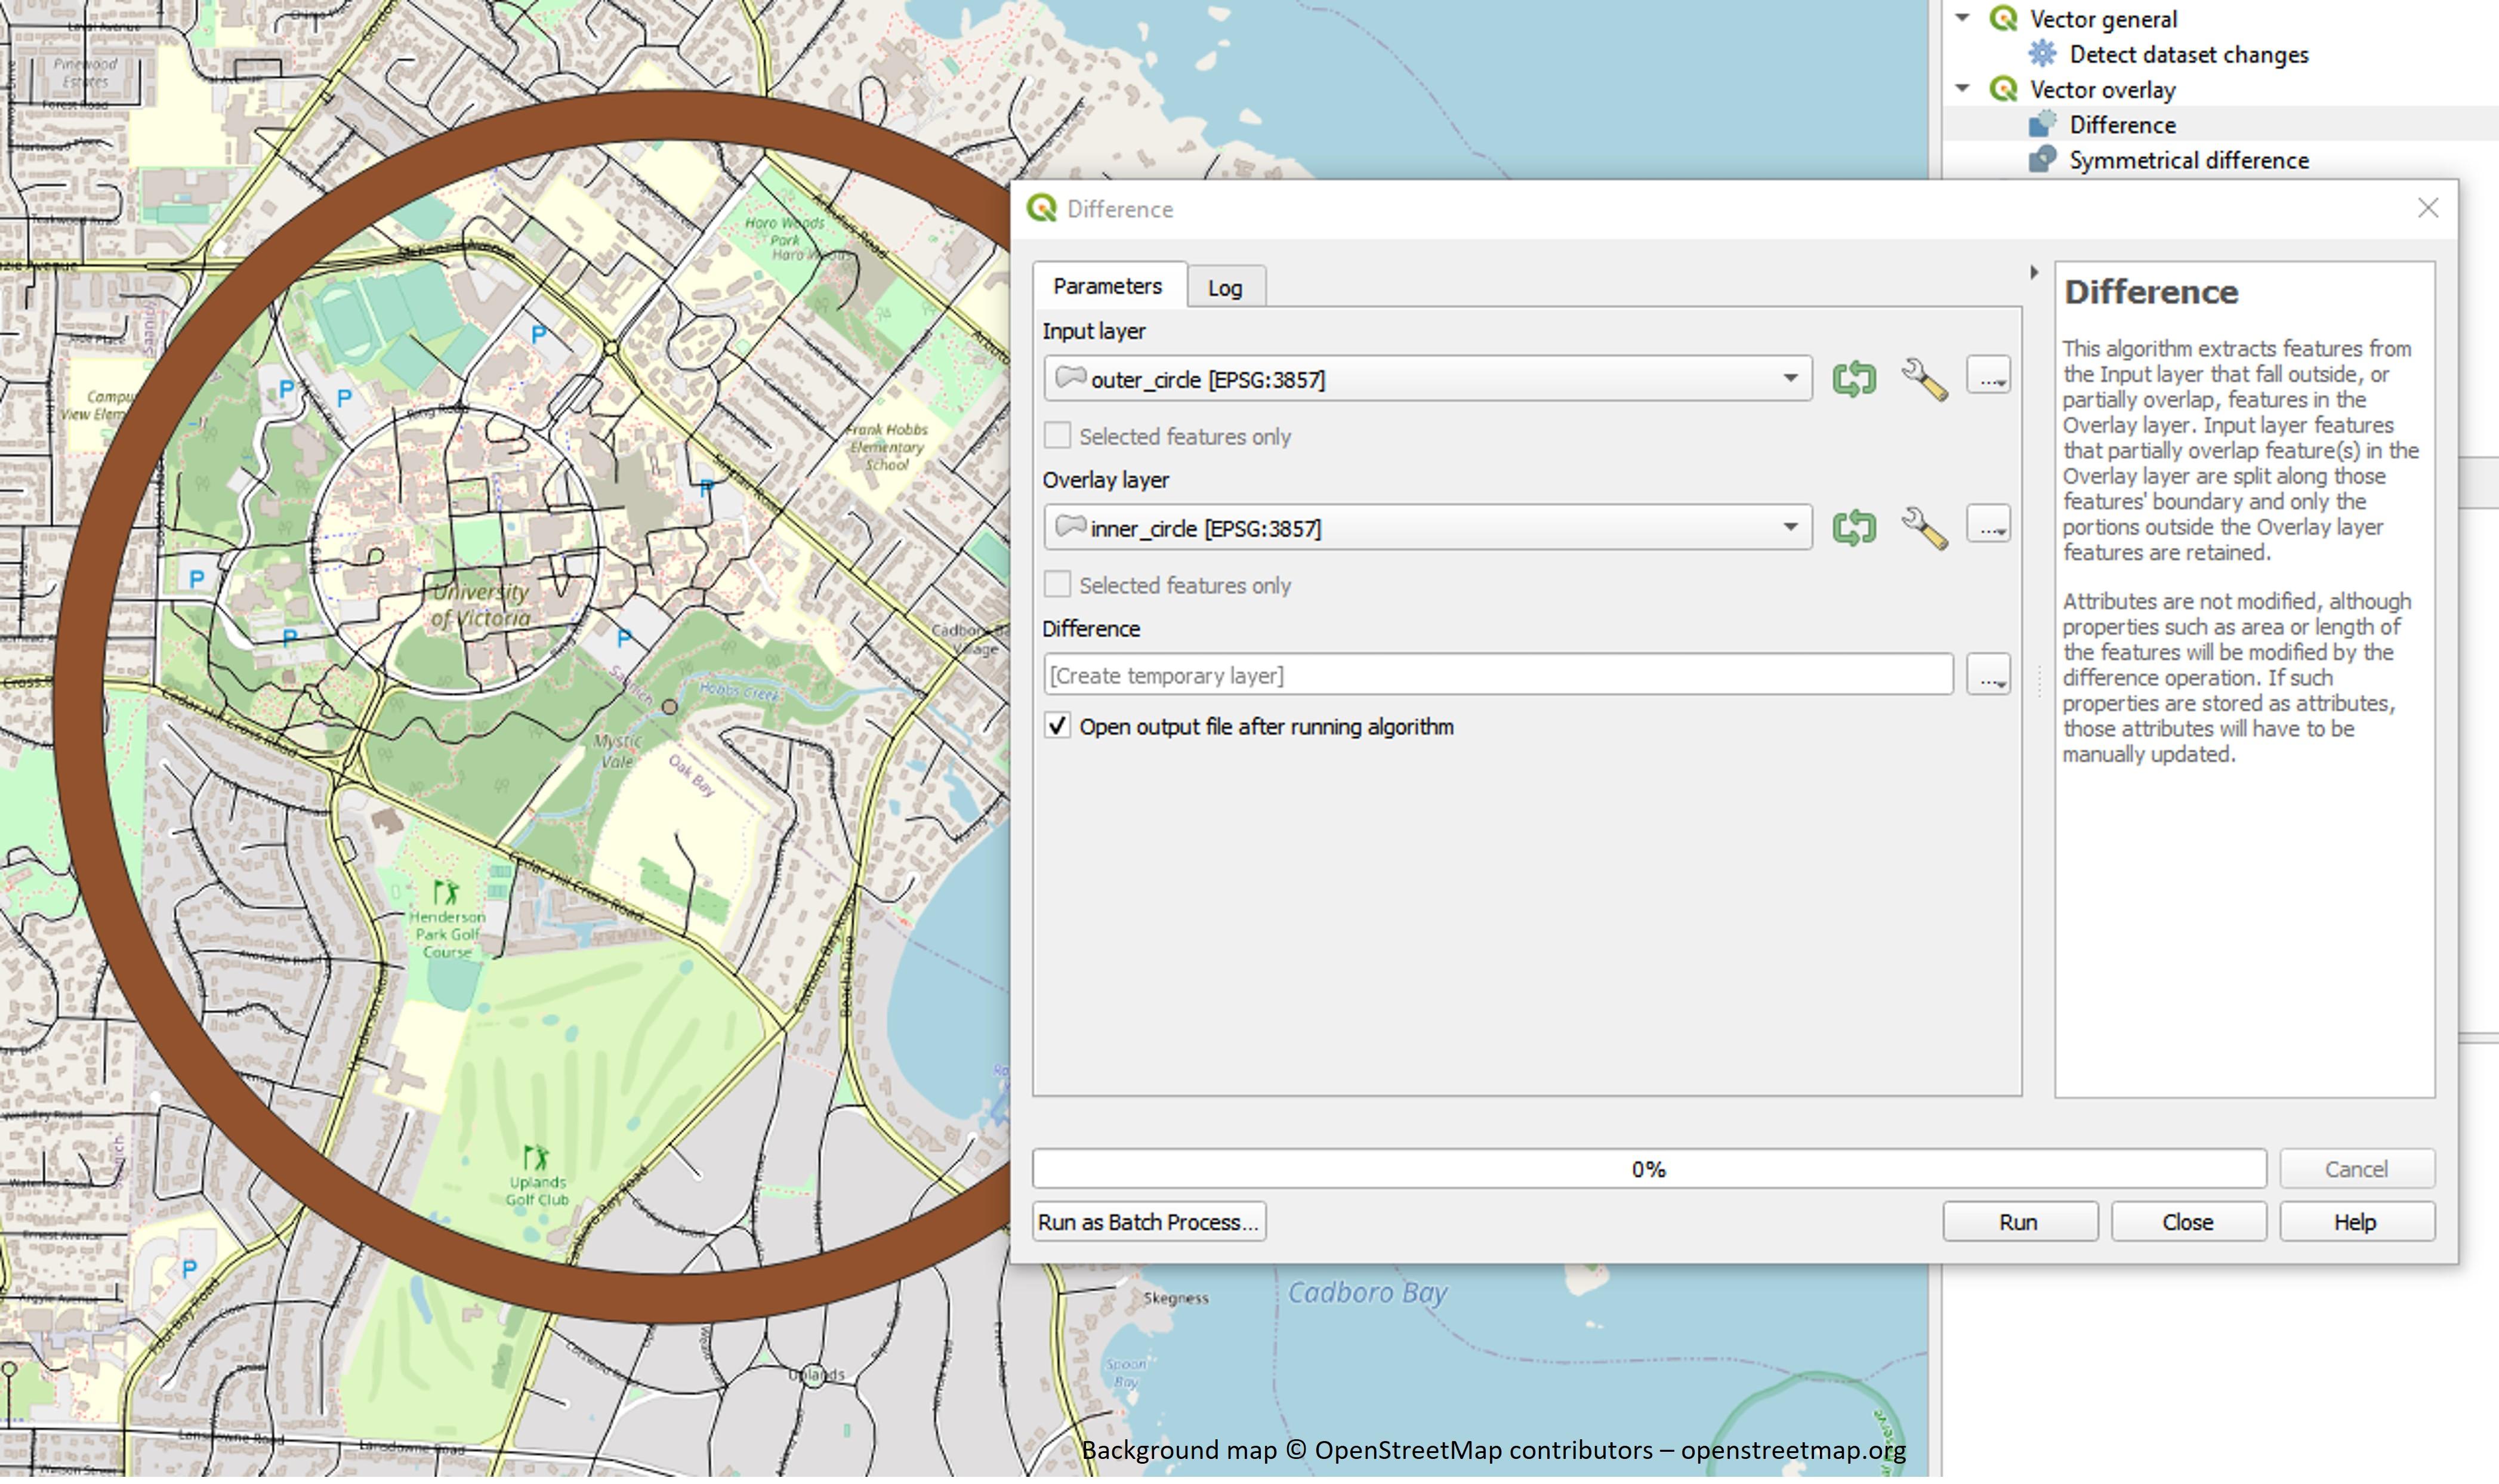
Frame Border Creation [Second Image]
To create the frame border, we'll subtract the inner circle from the outer circle:
- Select the 'Difference' tool from the processing toolbox.
- Set the outer_circle as the Input layer and the inner_circle as the overlay layer.
I've hidden the inner and outer circles for this image so you can see just the frame border by itself.
String Hole Preparation [Third and Fourth Images]
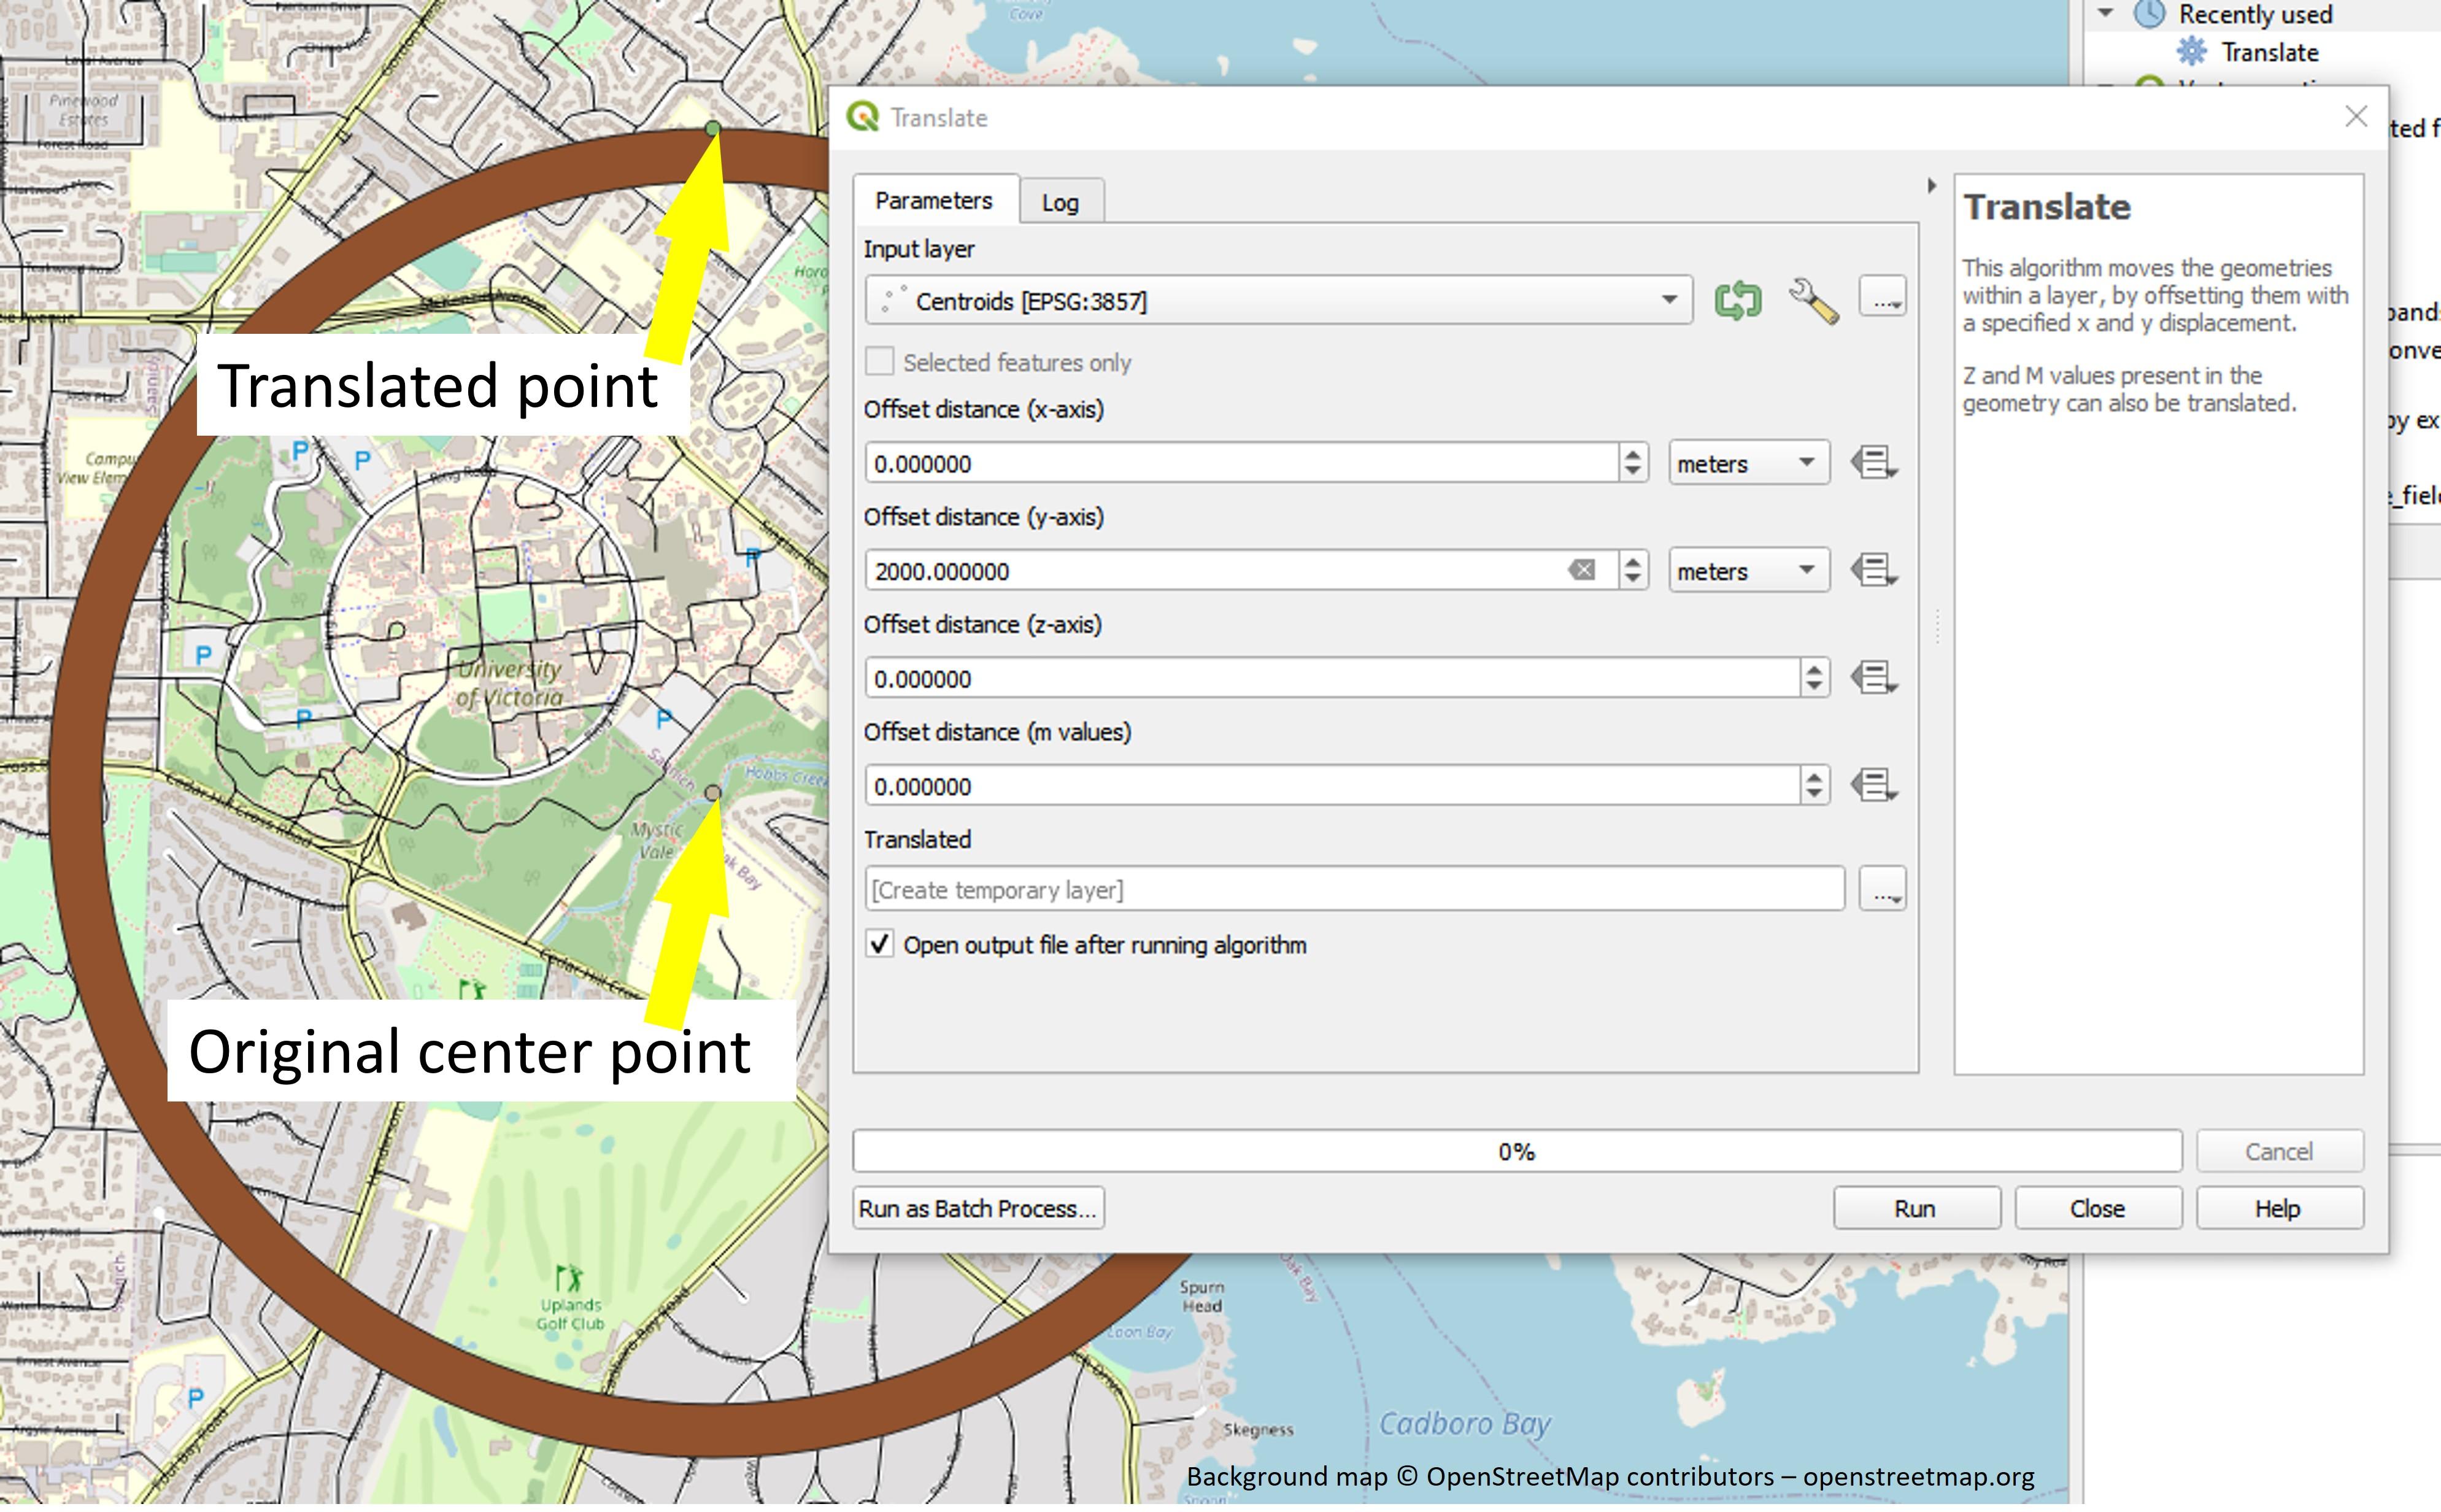
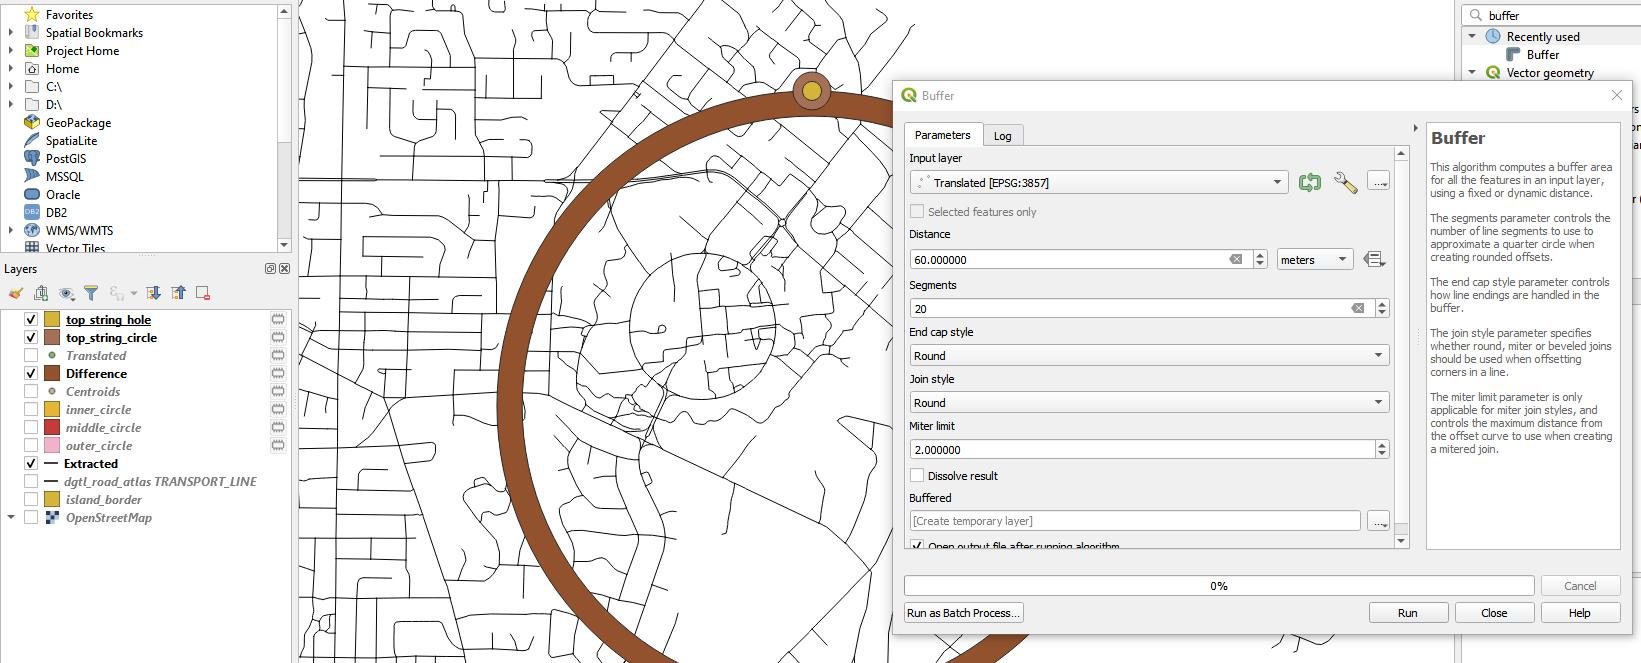
We'll want to have a hole at the top of our ornament for hanging. This hole will be constructed in the same way as the frame border by using a set of concentric circles, so we again need a center point that we can use to construct circles at the very top of the frame border. We'll use the centroid point that we created to help us do this.
- Select the 'Translate' tool from the processing toolbox.
- Select the 'Centroids' layer as the Input layer
- Set the 'Offset distance (y-axis) to be equal to the buffer distance of your outer circle. This will move the point to the very top of the outer circle. In my case, this is 2000 meters.
- Buffer the translated point to create a circle at the top. I like to have a 6mm outer string circle and a 3mm inner string hole, so my buffer distances will be:
- 6mm/2*40m/mm = 120 meters for the outer string circle, and
- 3mm/2*40m/mm = 60 meters for the inner string hole.
- I usually reduce the Segments to 20 for these holes since they're much smaller than the overall frame border size.
- If you choose different dimensions for your top circle and it extends into the area inside the frame, you can turn on editing for the top circle layer, select the Vertex Tool, and select and delete nodes that are in the way. To avoid having to do this, just make sure that your frame is thicker than the radius of your outer string circle.
- Rename these layers so you'll be able to use them later, but you don't need to do anything else with them for now.
Road Prep
Once you have the location for your map chosen, you can clip the roads to that area. This could be done a few steps earlier, but I generally like leaving as many roads as possible in the surrounding area in case I don't like how things look inside the frame or want to shift things around a bit in previous steps.*
The road prep consists of clipping the roads to the outer_circle and reprojecting them to the correct Coordinate Reference System for the project (the projection number in the bottom-right corner of QGIS that we set earlier). Reprojection is essential for the buffering of the roads to be done properly in the next step.
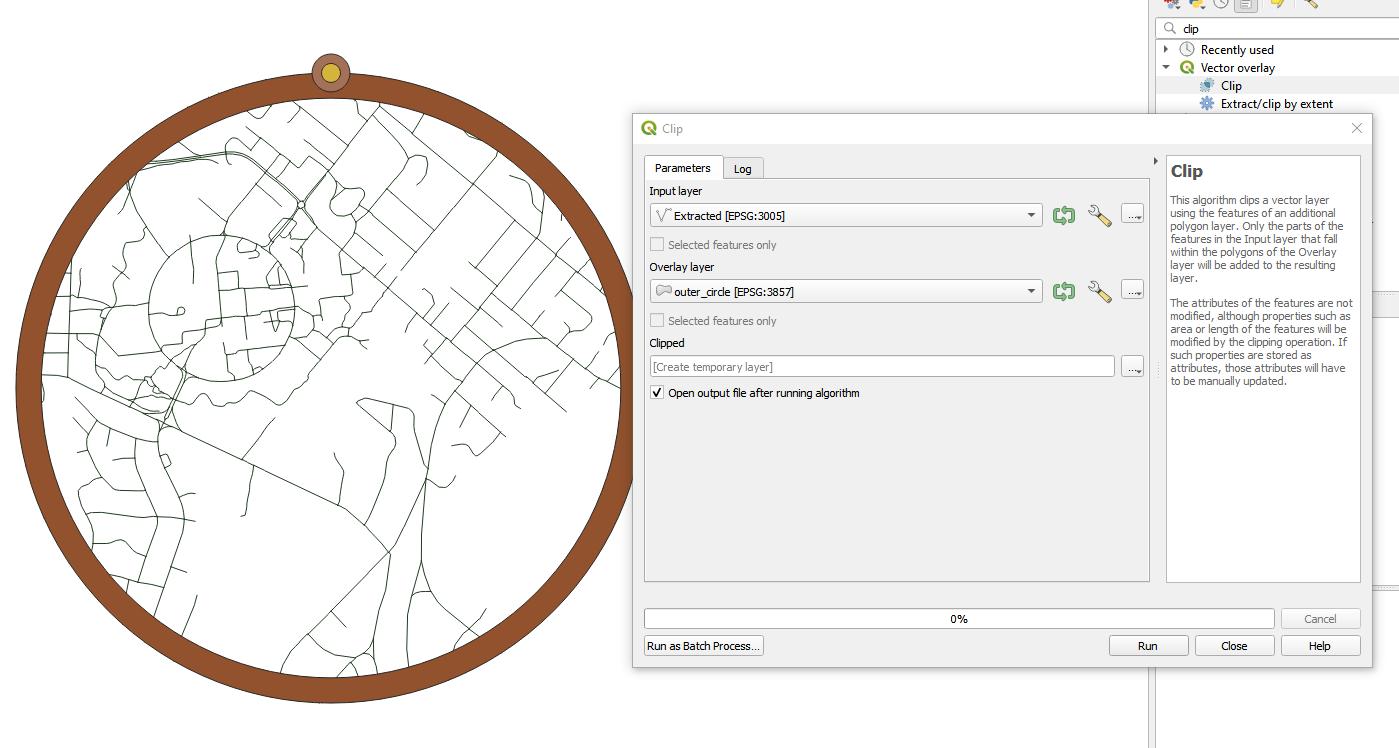
Clipping the Roads [First Image]
Clipping the roads gets rid of all of the roads outside of the frame area.
- Open the 'Clip' tool from the processing toolbox.
- For the Input Layer, select the 'Extracted' layer that you created way back in Step 2.
- For the Overlay layer, select the outer_circle layer.
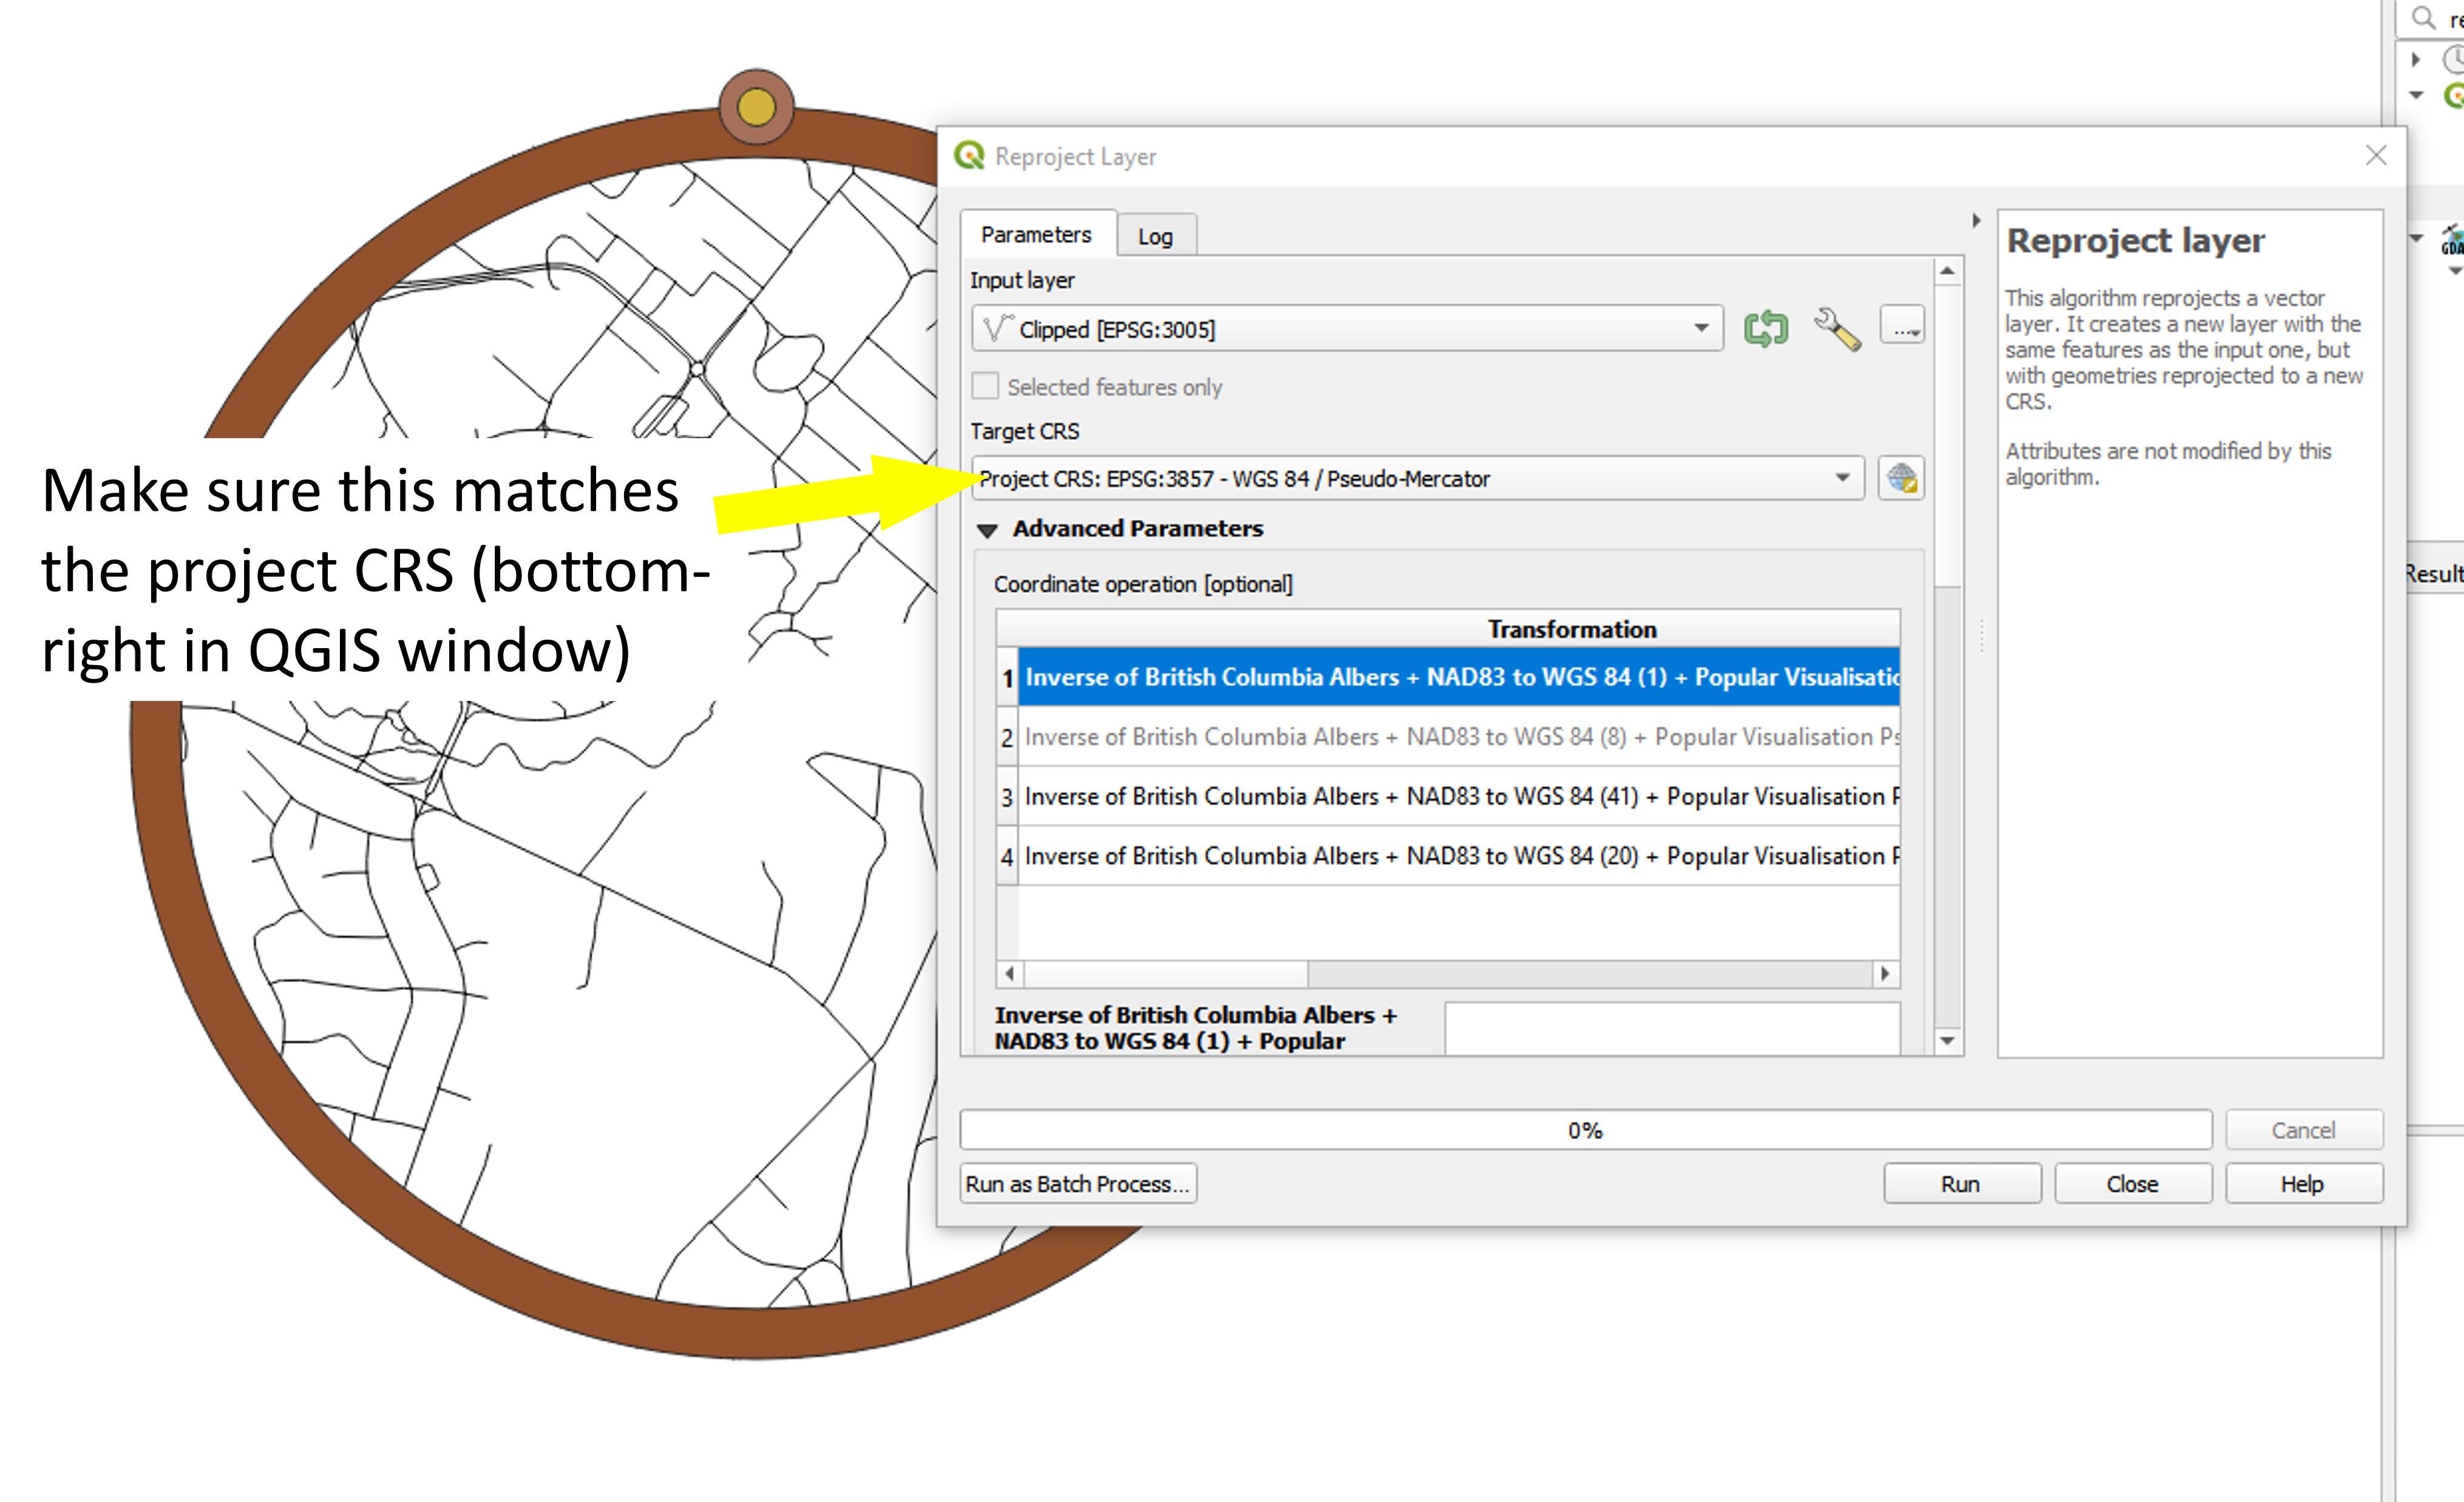
Reprojecting the Roads [Second Image]
- Open the 'Reproject Layer' tool from the processing toolbox.
- The Input layer should be the clipped layer that you just created.
- The Target CRS should be the Project CRS, which in my case is EPSG:3857.
- You can ignore the Advanced Parameters.
- The reprojected layer will look exactly the same as it did before, but QGIS will now process it differently because of the projection assigned to it.
*The clipping can also be done after buffering the roads, but the reprojection still needs to be done before the buffering. The advantage to buffering before clipping is that you only need to clip once, whereas the method that I'm doing here results in needing to clip twice. In addition, it allows you to quickly make multiple maps of the same area. The advantage of clipping before buffering is that the model processes more quickly, so it's easier to test multiple options for buffering in the next step.
Road Buffering (Constant Buffer)
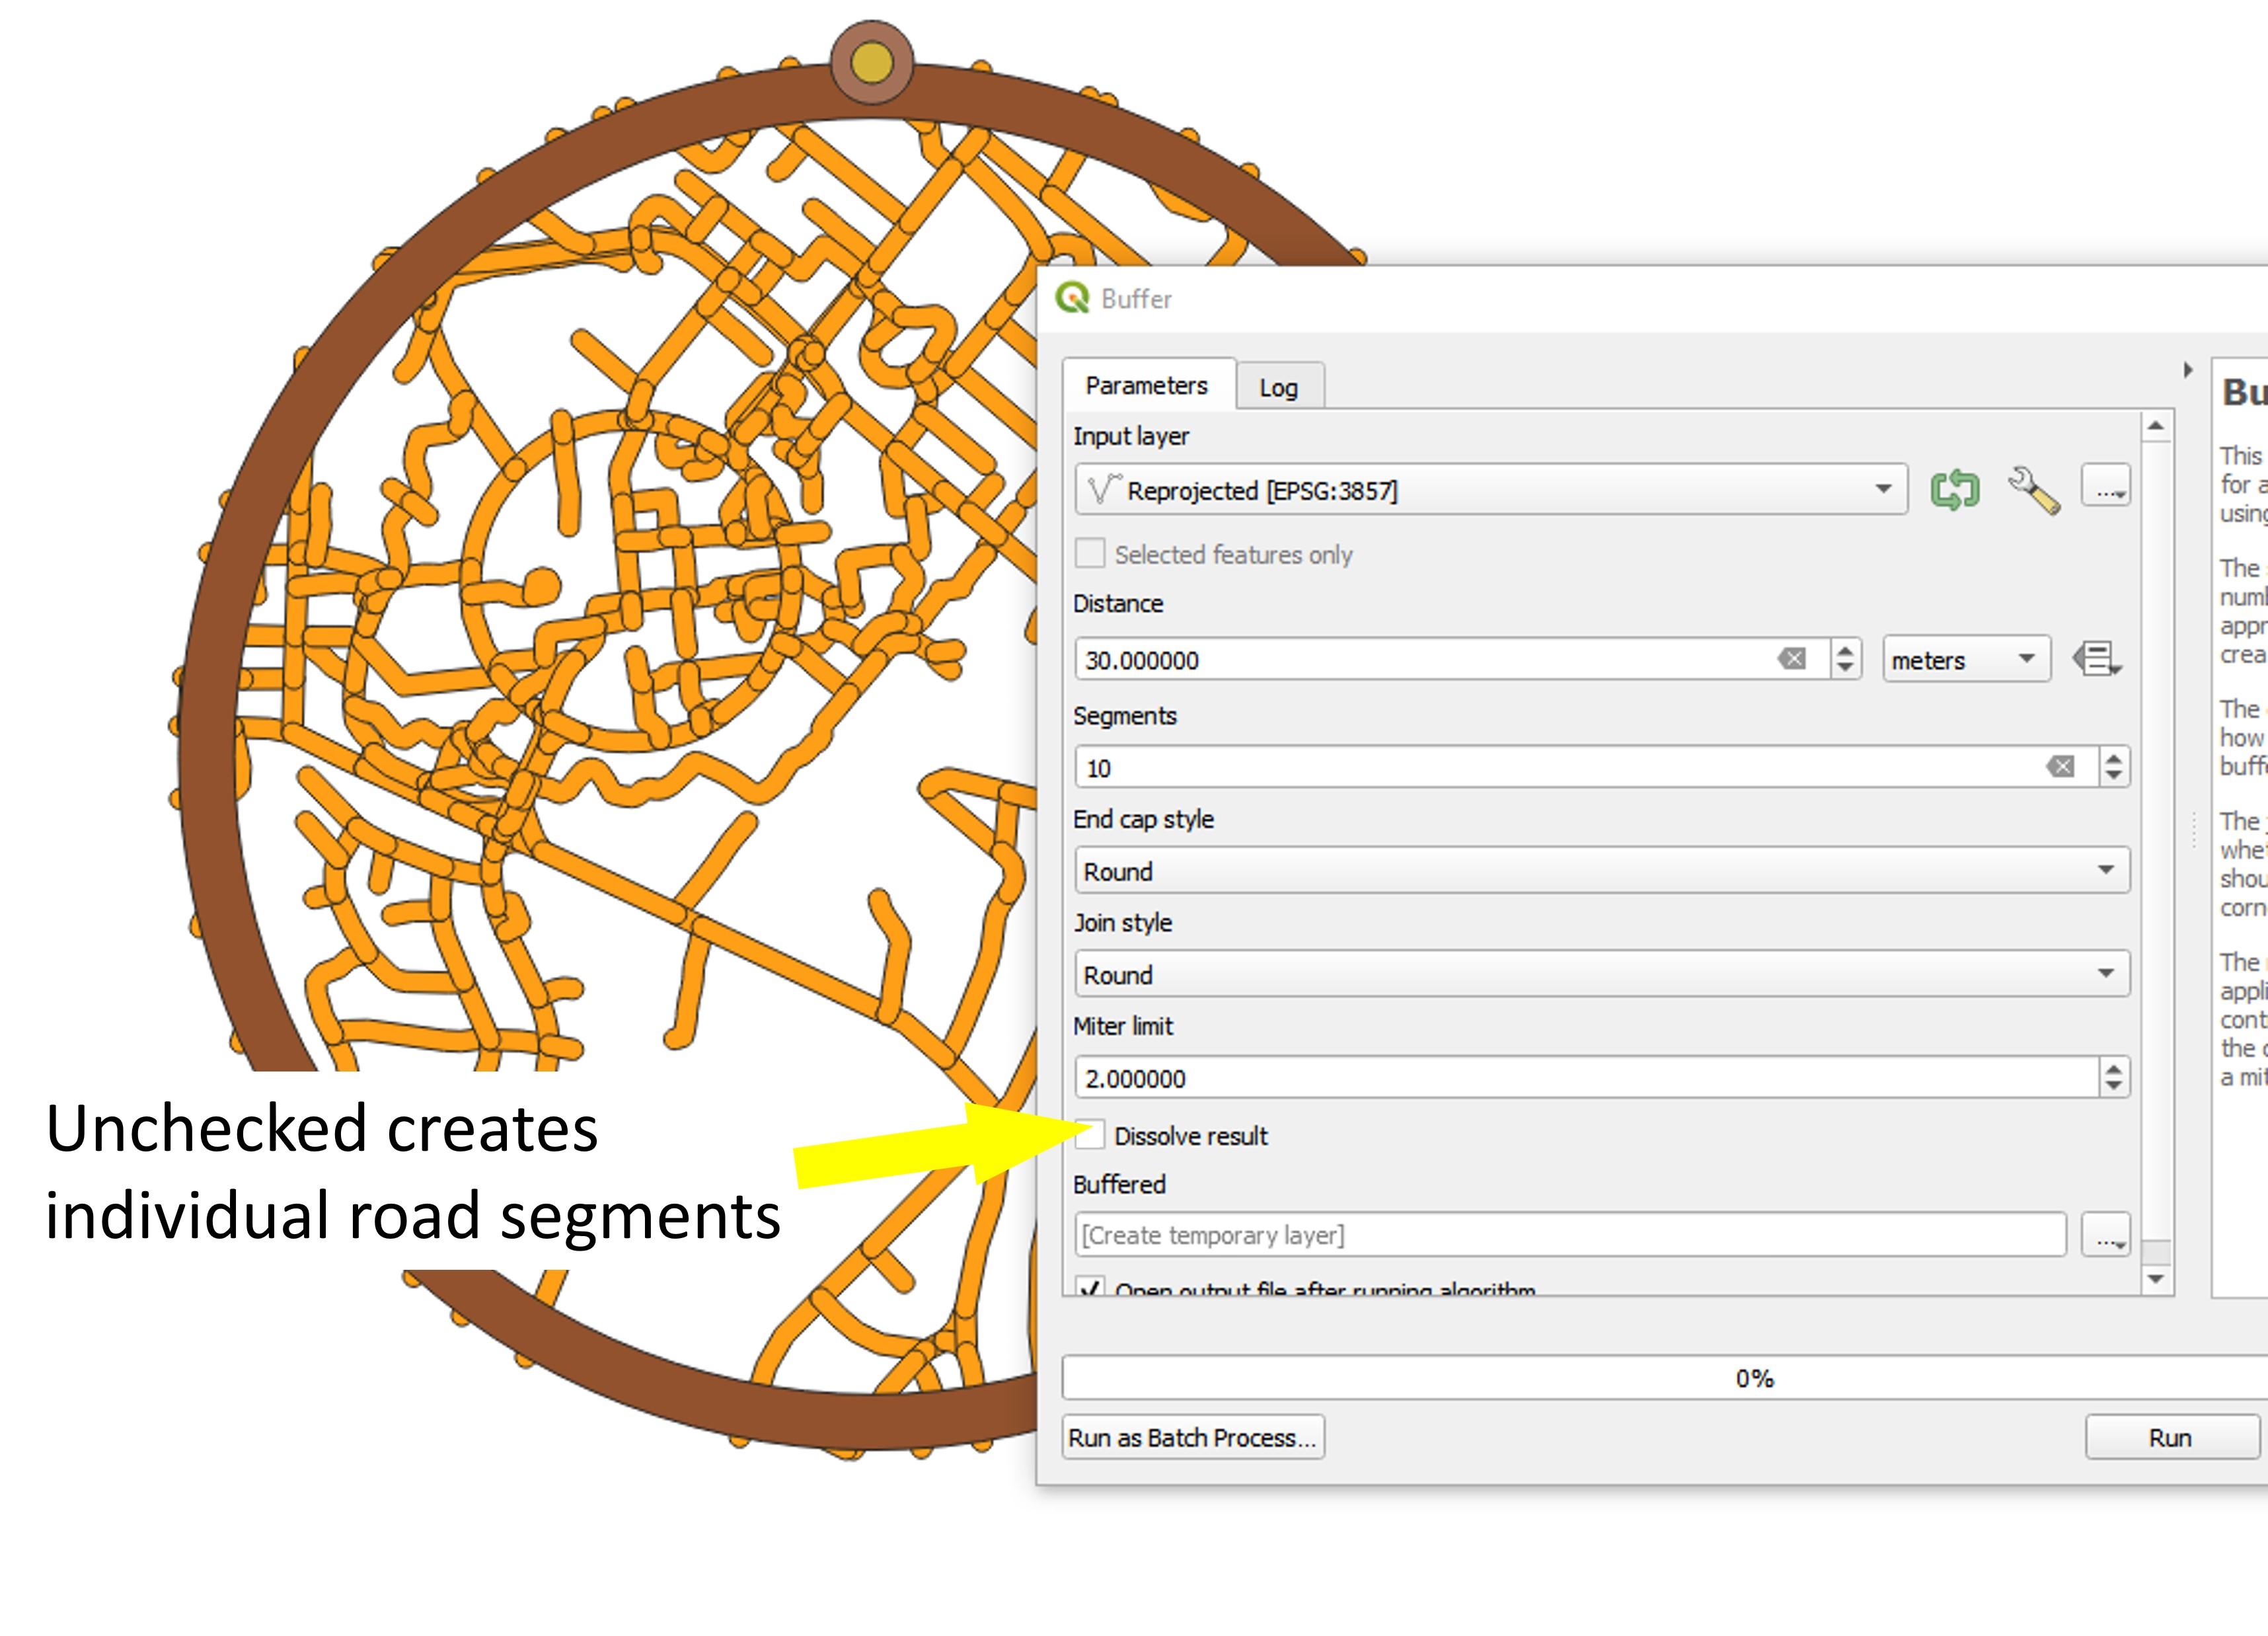
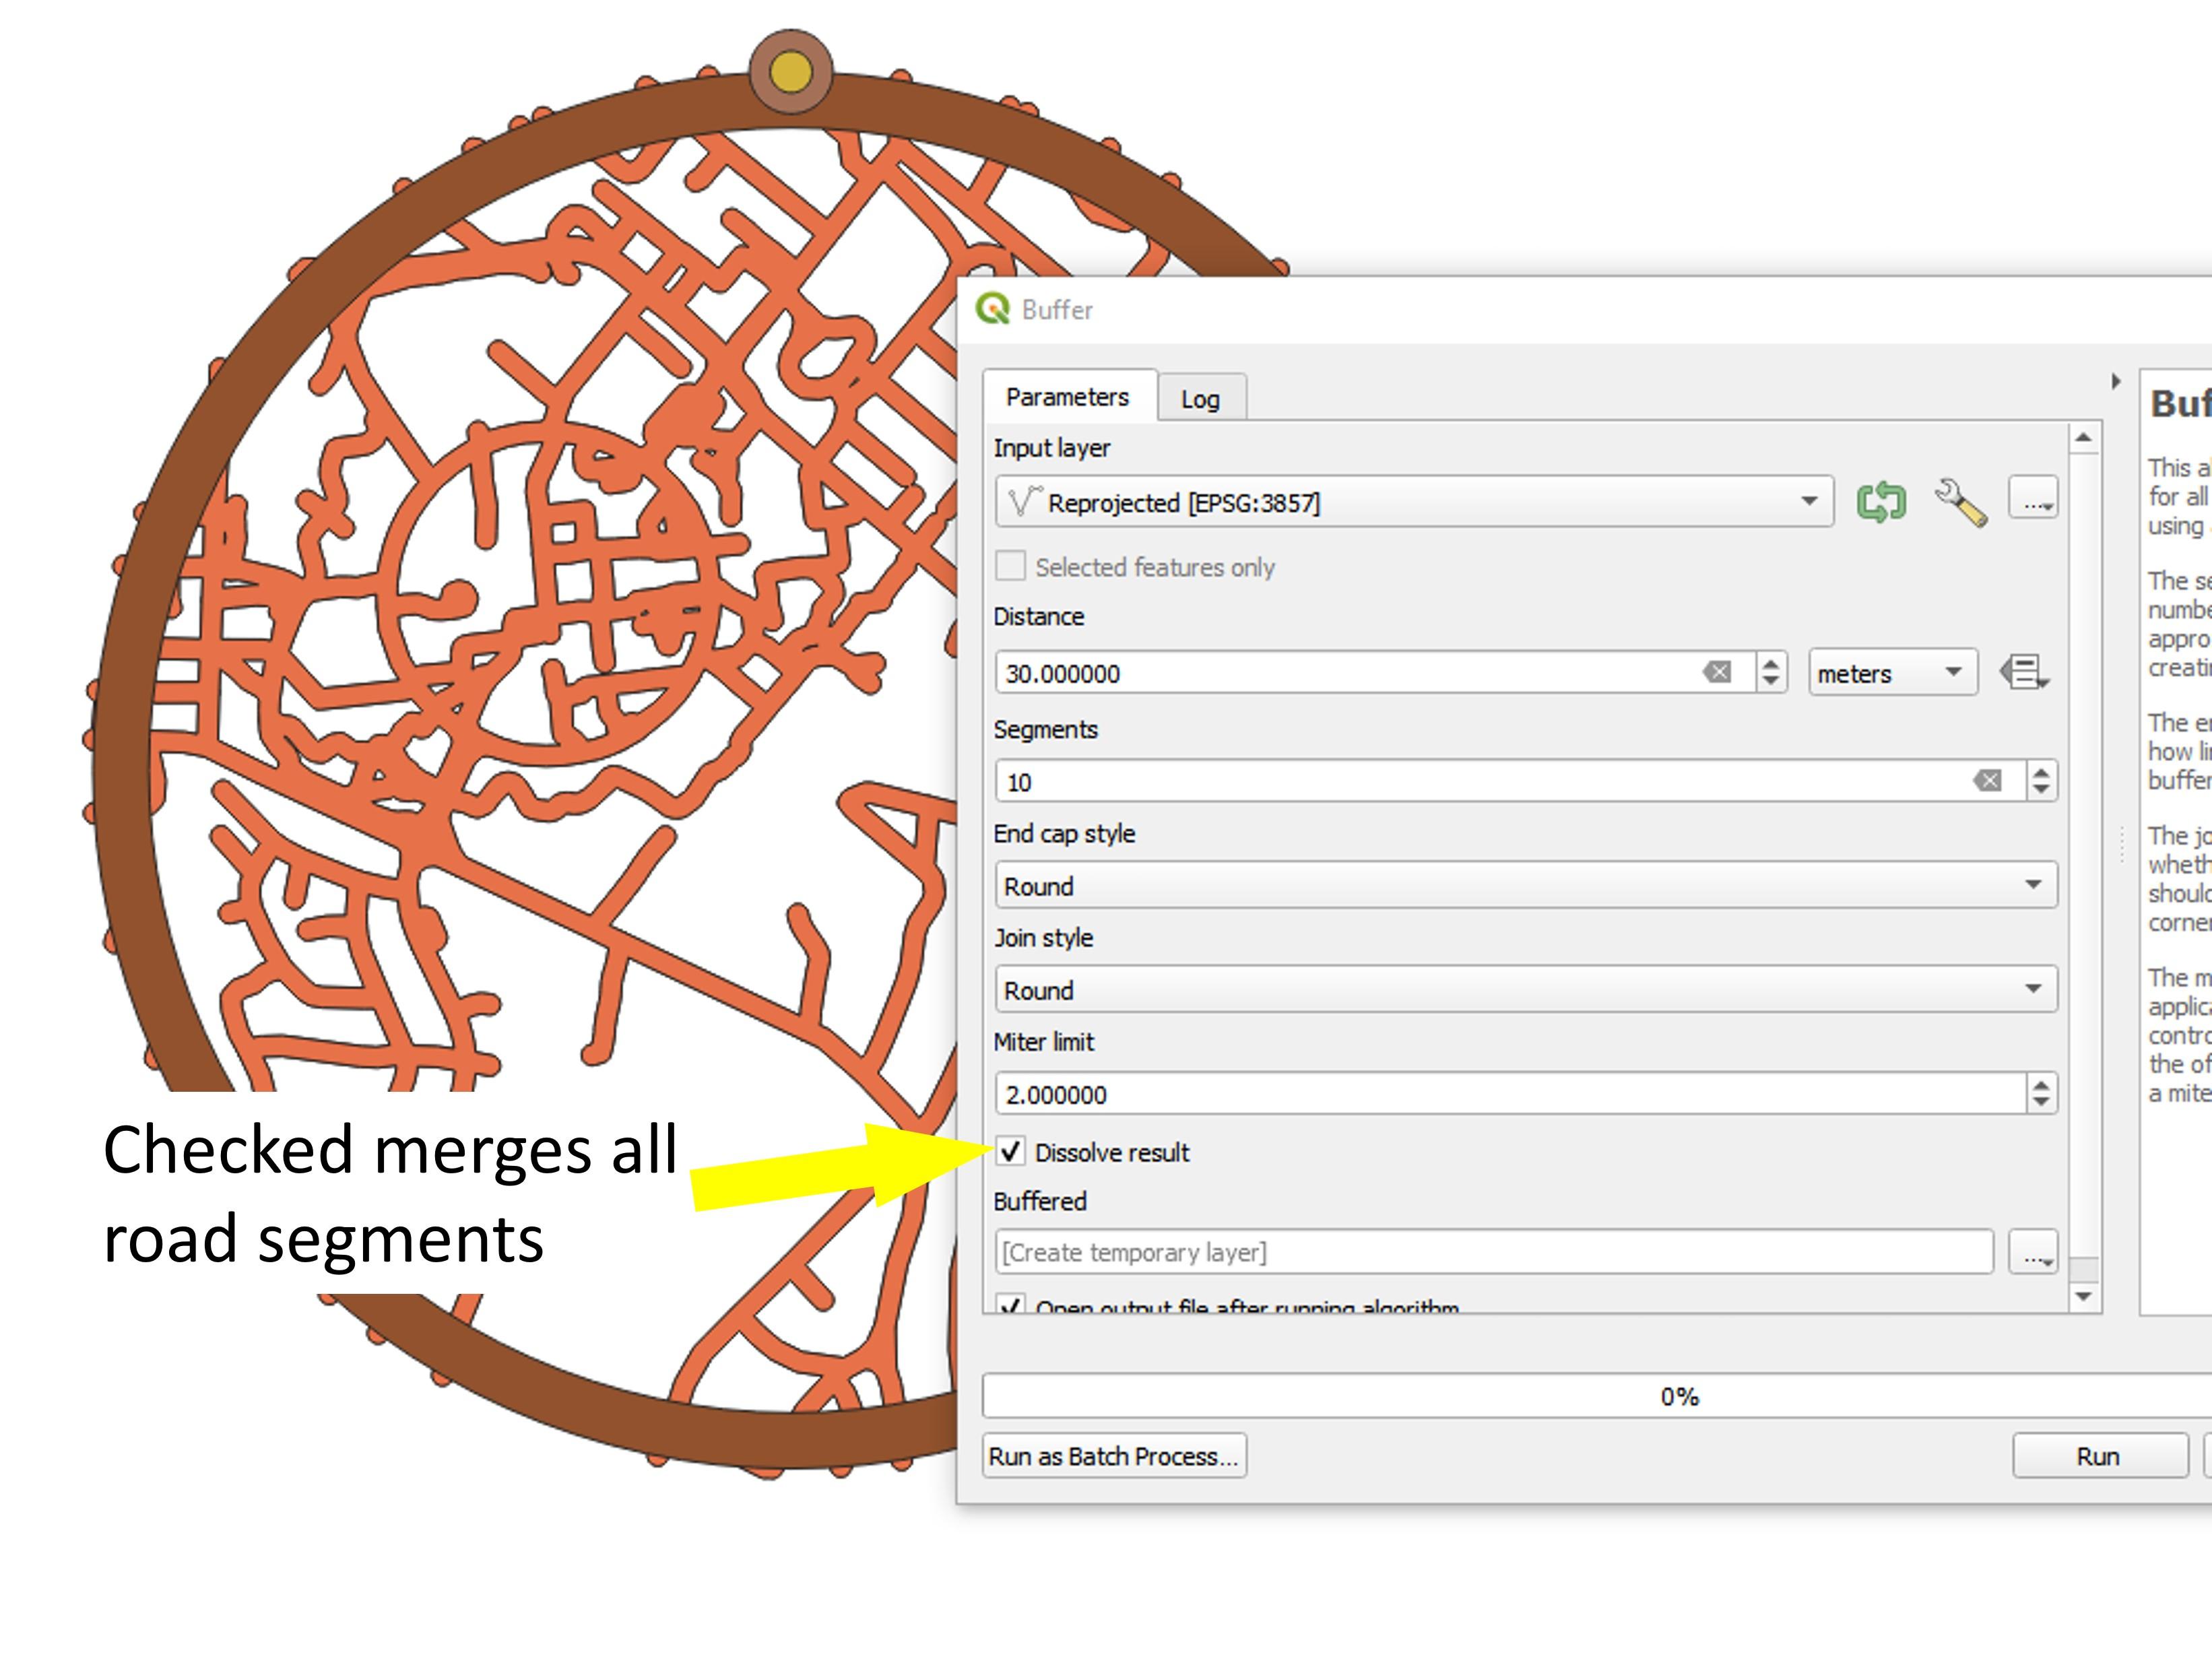
Choosing a constant or variable buffer
This step is the one that I find takes the most time when creating these ornaments as it involves some level of trial and error. Creating roads can be done one of two ways, where the buffer distance determines the width of the roads in the final ornament:
- Constant buffer distance, or
- Variable buffer distance based on the number of lanes in the road.
The first way is definitely faster, but I think the second way looks nicer. Choosing a buffer distance that works depends on the material you're cutting, the capabilities of your laser cutter, and the density of roads in the area that you're working in. In some cases, it may not be possible to fit all of the roads in well, so you may need to go through and filter out smaller types of roads or delete specific sections to make it work.
The material and capabilities of your laser determine how narrow you can make individual roads. For the laser that I use, for example, I try to never cut a width smaller than 0.6mm to try and avoid burning too much material or creating a really fragile model.
Constant Buffer Distance [First and Second Images]
For a constant buffer distance, each road in the ornament will be the same width regardless of how many lanes it has. To do things this way, I'd try by starting with a road width of 1.5mm.
- For my map, a road width of 1.5mm means a buffer of 0.75mm (since the buffer extends in both directions from the line), which is 0.75mm*40m/mm = 30 meters.
- Select the reprojected roads layer then open the 'Buffer' tool.
- Change the Distance to whatever you've chosen.
- You can increase the Segments value, but it doesn't make too much of a difference.
- Leave the 'Dissolve result' box unchecked for now as it helps the map load faster.
- After running this buffer, I think the roads look pretty good, but if you think they look too thick or thin, you can leave the Buffer dialog open and keep changing parameters and delete the test layers as you go.
- Once you've found a buffer distance that you like, check the 'Dissolve result' box to create the buffered roads layer.
Once you're satisfied with your constant road width, jump to Step 13.
Road Buffering (Variable Buffer Part 1)
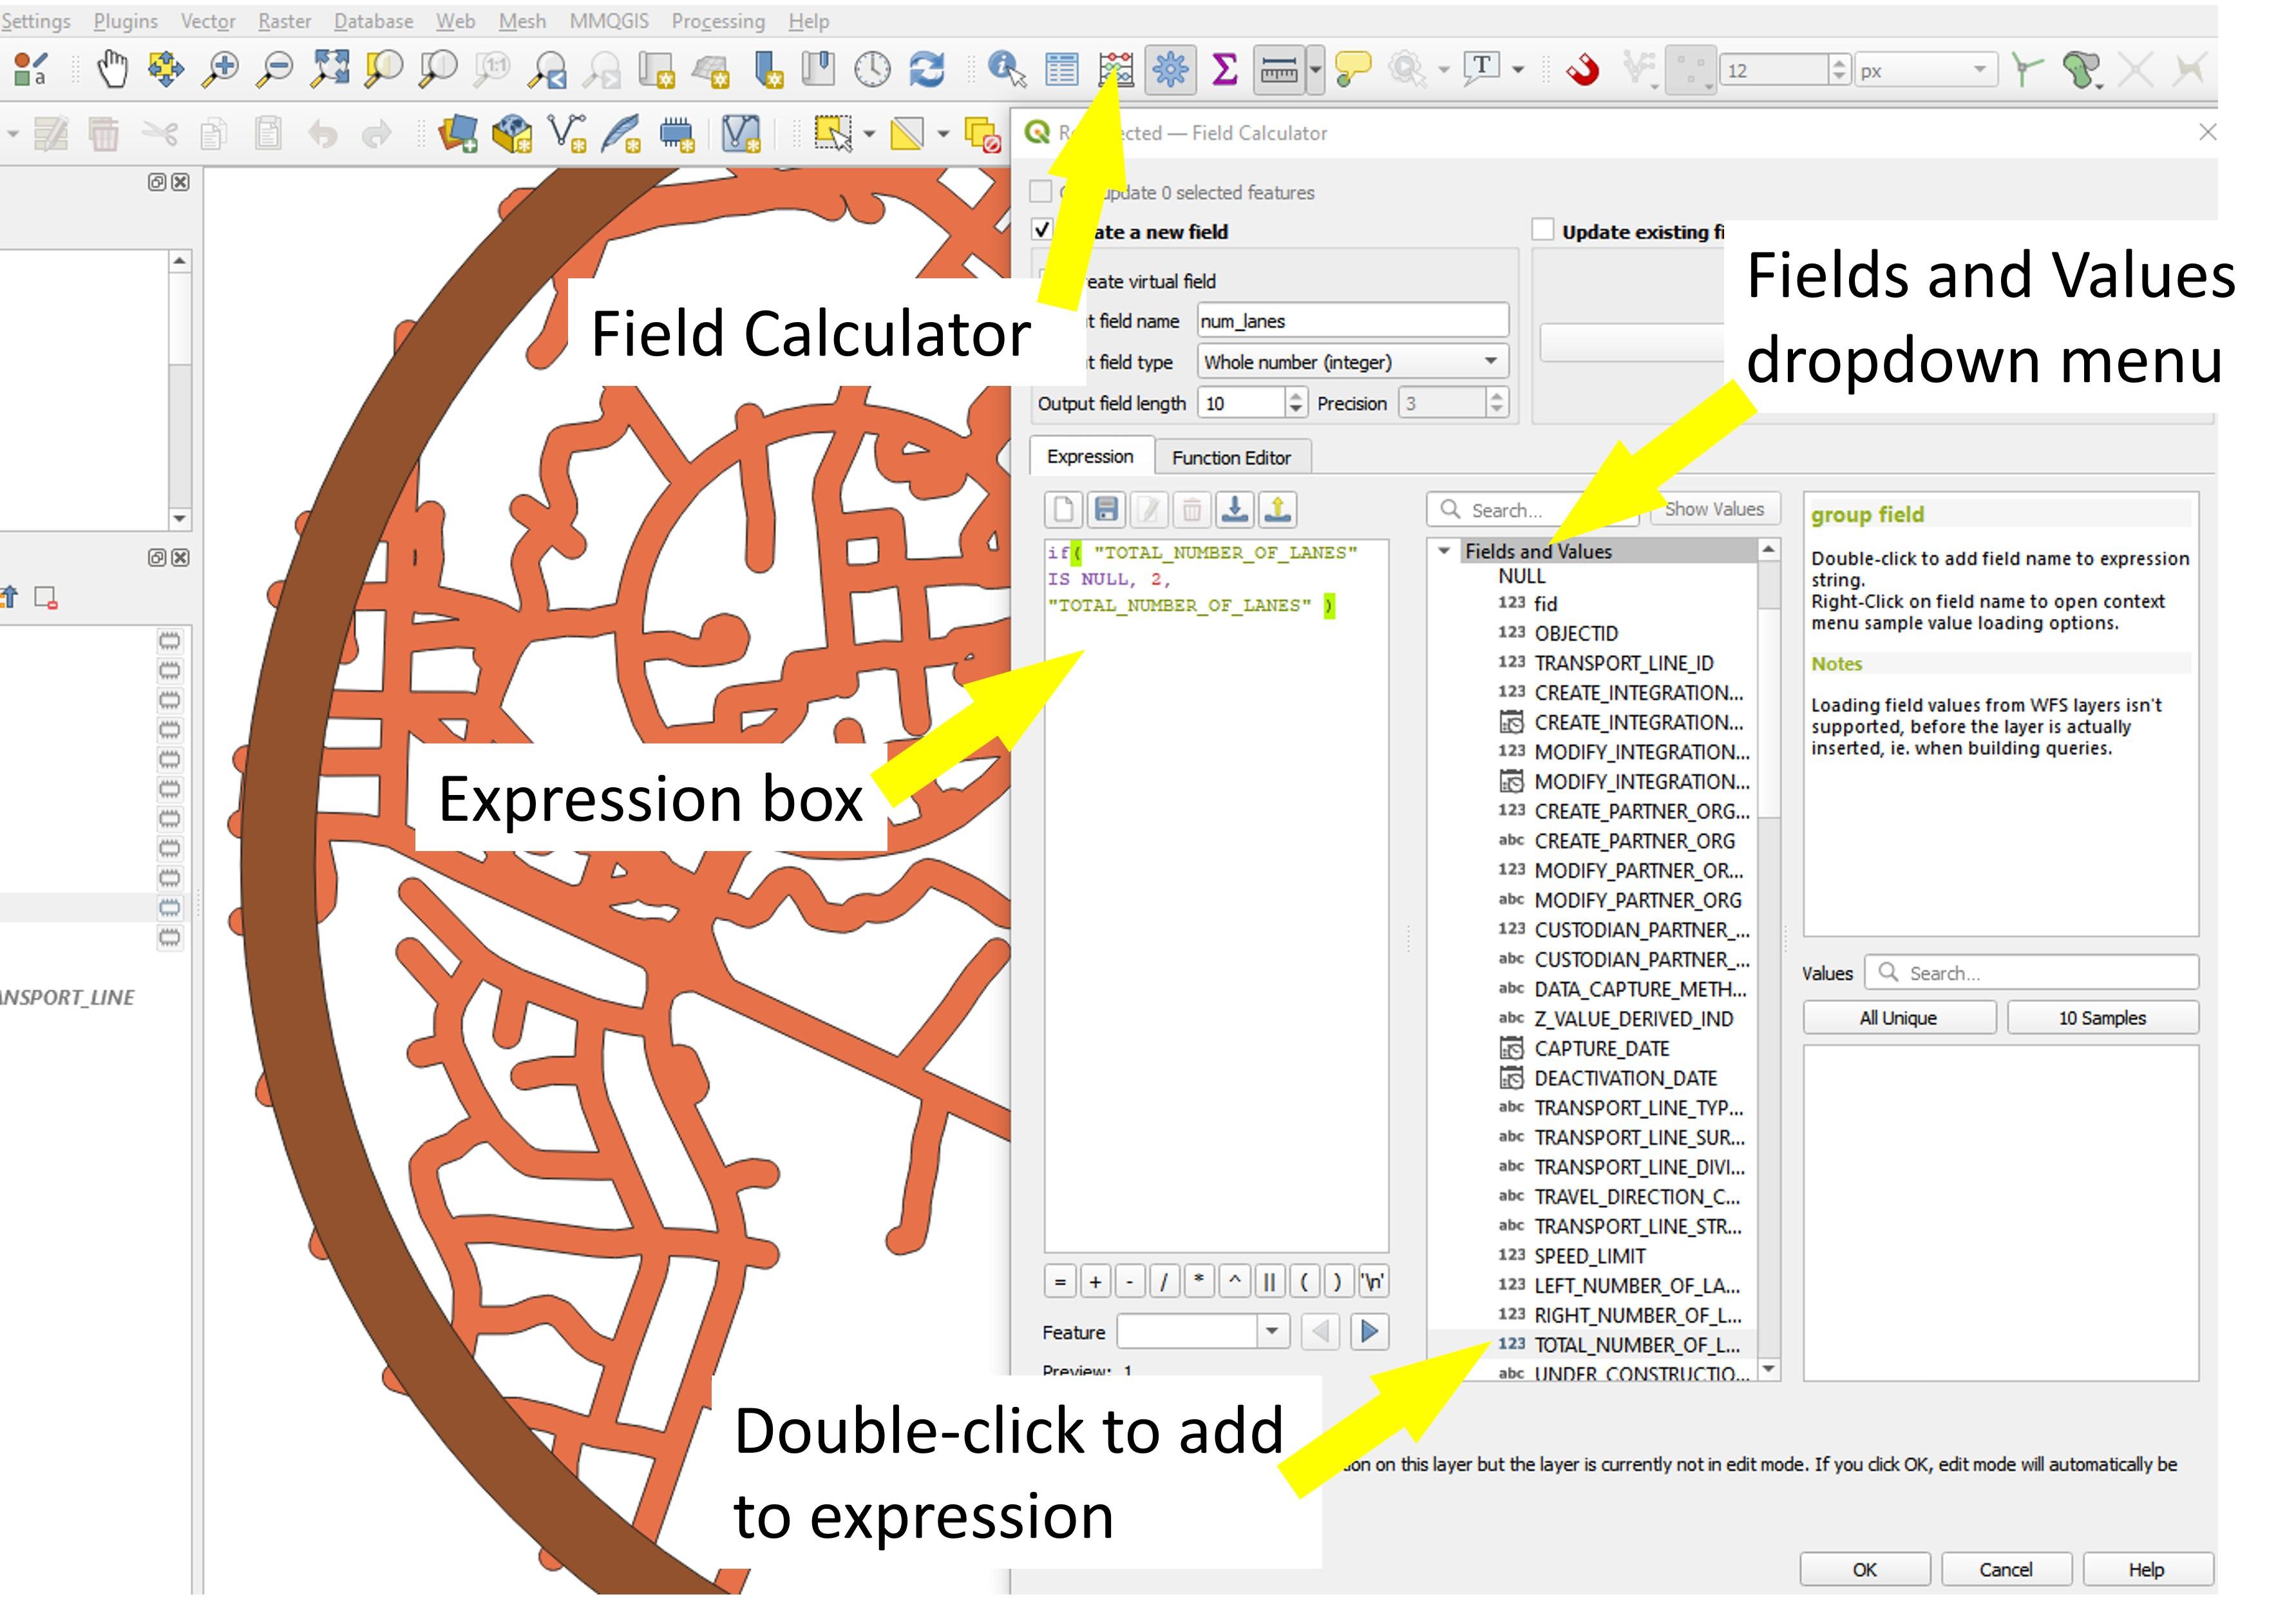
A variable buffer allows you to alter the width of the roads in your ornament based on the number of lanes in the road.
The first thing you need to do if you're choosing this option is to ensure that all of the roads that you're going to be using have a number of lanes associated with them. In some cases, lane numbers may be missing (assigned a NULL value), which will prevent them from being buffered and therefore they'll be missing from the ornament.
Reassigning NULL Lane Number Values (if applicable) [First Image]
To fix NULL values, we can use the Field Calculator in QGIS to assign any NULL lane number values to a set value. I usually like to use 2 as it's the most common number of lanes for roads to have, but you can choose whatever you think is best. To quickly check if there are any null values, you can right click on the reprojected roads layer and click Open Attribute Table. Sort the road layer number field by clicking on the field name twice (sort smallest->largest then largest->smallest or vice versa). If no NULL values appear, you're good to go! Otherwise, do the following:
- Make sure you have the reprojected roads layer selected and open the Field Calculator.
- Check the box to Create a new field. I like to do this to avoid accidentally overwriting data.
- Put in a name like num_lanes. Depending on your road layer type, you may not be able to create a layer with a name longer than 10 characters.
- Make sure that 'Whole number (integer)' is the Output field type
- Find the field that indicates the current number of lanes. In my case, it's TOTAL_NUMBER_OF_LANES. You can find fields by clicking the 'Fields and Values' dropdown in the search box.
- In the Expression box, type if("TOTAL_NUMBER_OF_LANES" IS NULL, 2, "TOTAL_NUMBER_OF_LANES)
- Obviously you should change the field name to the field that currently has the number of lanes in it.
- You can add the field name by double-clicking it from the search box, so you don't need to type it out.
- What this expression is doing is saying that if the number of lanes is currently NULL, change it to a value of 2, otherwise leave it as is.
- The Field Calculator automatically turns on editing for the layer, so you can toggle that back off once you're done with the Field Calculator.
Road Buffering (Variable Buffer Part 2)
Creating an equation for buffer distance
With a variable buffer, I find it's best to have a set physical size in mind for the widest roads and narrowest roads and then you can create an equation that sets the buffer distance based on that. I generally don't set the buffer distance to scale 1:1 with the number of lanes. That is, a 4 lane road won't be 4 times wider than a 1 lane road.
Instead, we'll create a linear relationship between the number of lanes and the buffer distance based on the desired width in the ornament. For my ornament let's say that I want:
- 1 lane road to be 1.0mm wide = 0.5mm buffer = 0.5mm*40m/mm = 20m buffer for 1 lane road
- 4 lane road to be 3.0mm wide = 1.5mm buffer = 1.5mm*40m/mm = 60m buffer for 4 lane road
- Note that 4 lanes is the maximum in my case - easy to check by sorting the attribute table of the reprojected roads layer by the number of lanes.
So, given that 1 lane has a buffer distance of 20m and 4 lanes has a buffer of 60m, what are the intermediate values? Breaking out some high school algebra skills, we can say:
buffer_distance = m*number_of_lanes+b
m is the slope and is equal to rise/run = (60-20)/(4-1) = 40/3 => m ≈ 13 (doesn't matter if it's exact)
b is the y-intercept and can be found by solving for it in one of the equations using the previously calculated m value.
20m = 13*1 lane + b => 20 = 13 + b therefore b = 7
Road Buffering (Variable Buffer Part 3)
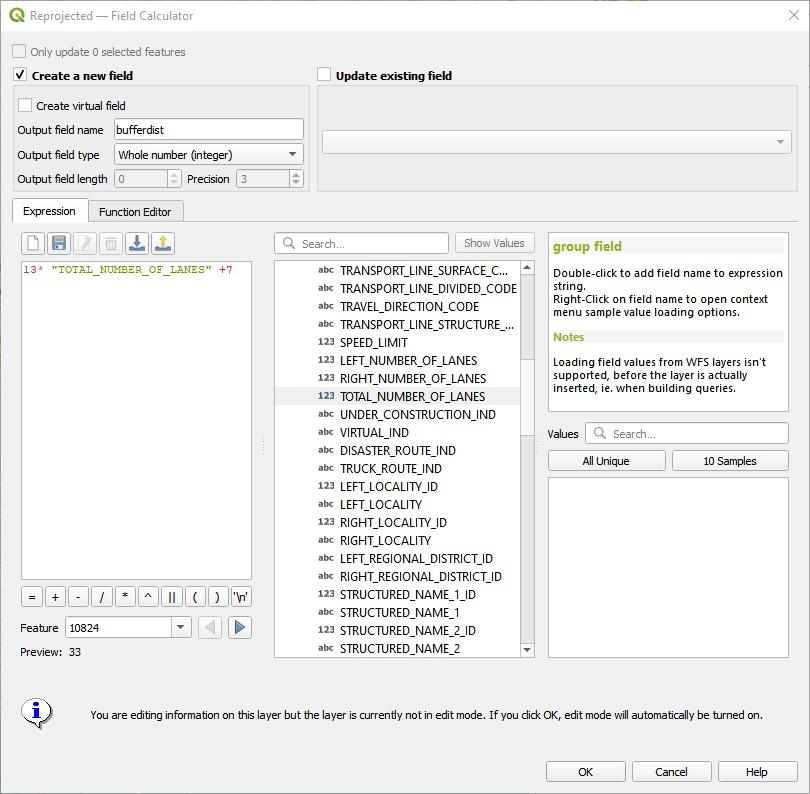
Therefore, our overall equation is:
buffer_distance = 13*number_of_lanes+7
Buffer distance field creation [First Image]
We can create a new field in our reprojected roads layer with this value in it to tell QGIS how far to buffer each road based on the number of lanes in it.
Select the reprojected roads layer and open the Field Calculator:
- Make sure the box is checked to create a new field.
- Name the new field - I used 'bufferdist'.
- Type in your equation in the expression box.
- Recall that you can click the dropdown for 'Fields and Values' in the middle box and double-click to enter the number of lanes field name.
- Click OK then turn off layer editing since it gets turned on automatically after using the field calculator.
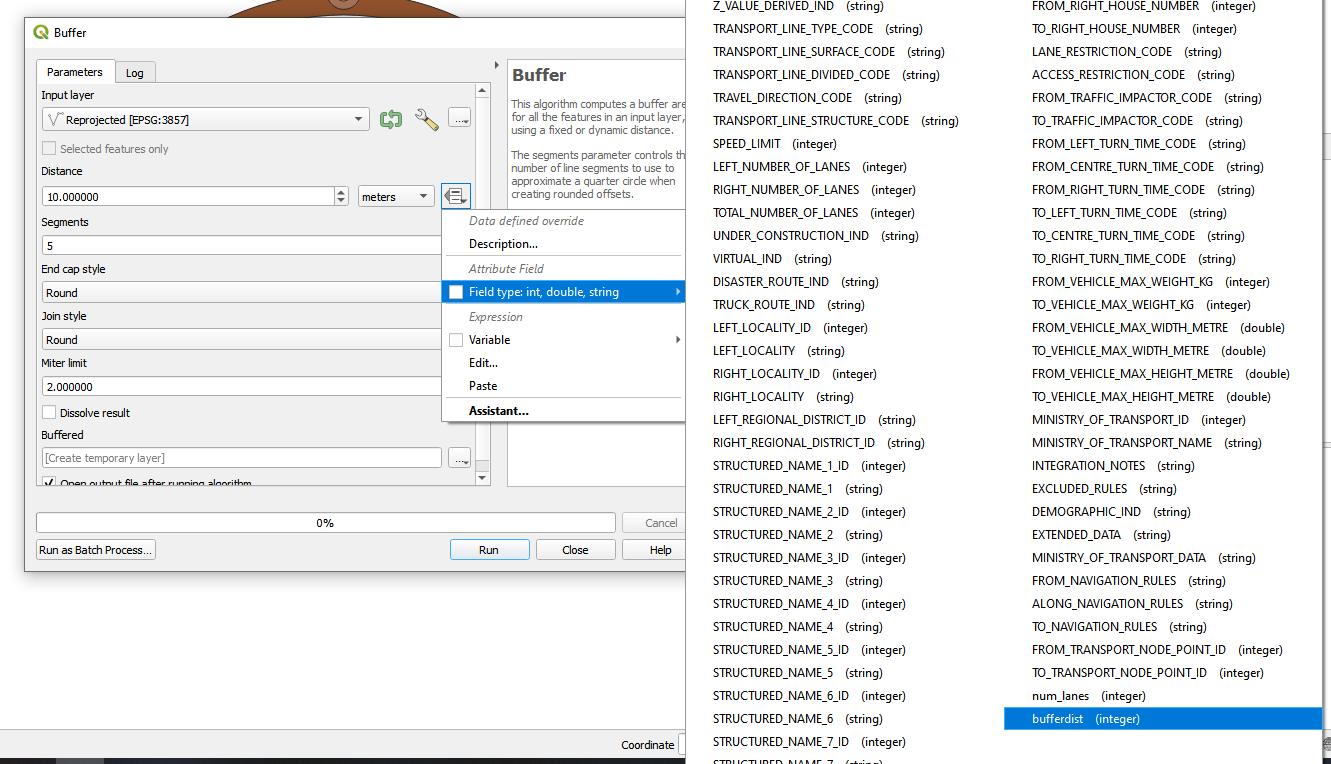
Variable buffering [Second Image]
- Open the 'Buffer' tool from the processing toolbox.
- Make sure the input layer is the reprojected roads layer.
- For the Distance, click the Data defined override icon next to the units (see picture), hover over 'Field type', then click the buffer distance layer.
- You can leave the 'Dissolve result' box unchecked to start with (it speeds up the processing a bit) to check to see if the buffering from the equation looks good. For the final run, however, you should make sure that it's checked as it combines all of the different buffered road segments into a single piece.
- If you don't like how it turned out, you can modify your buffer equation and edit the buffer distance field in the roads layer and try again.
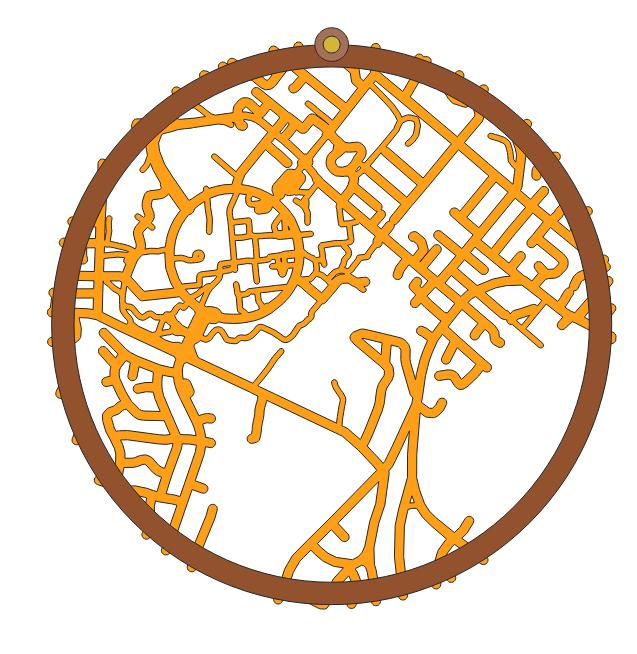
I'm pretty happy with how this one looks (third image), so I'll keep it!
Clipping the Buffered Roads
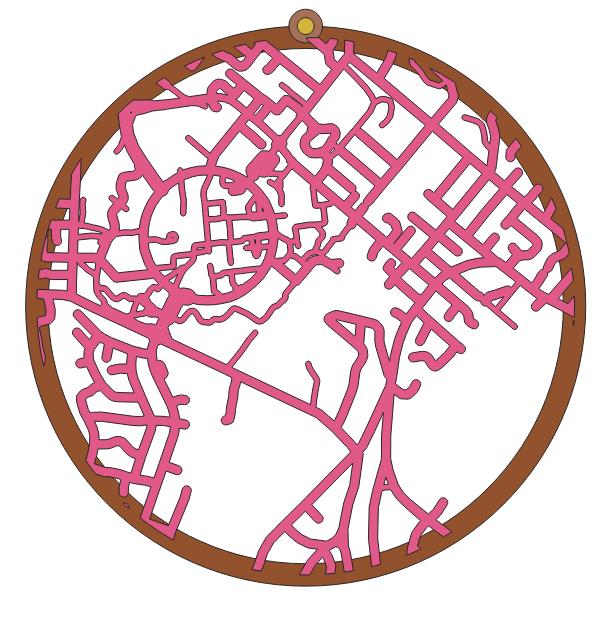
You'll notice that the buffered roads extend beyond the outside of the ornament frame, so we need to get rid of that excess.
Clipping the buffered roads layer uses the middle circle that we created in Step 7. The reason for this is that using the outer or inner circles to clip might create some funny zero-width geometry issues when we try to merge everything later. I've never actually experienced any problems doing it that way, but I still like to use the middle circle just in case.
- Open the 'Clip' tool from the processing toolbox.
- For the Input layer, select the buffered roads (constant or variable buffer).
- For the Overlay layer, select the middle circle
You'll see now that all of the clipped roads extend into the ornament frame but not all the way to the outside border. This is the final buffered roads layer that we'll use, so be sure to rename it something that you'll remember. I called mine 'clipped_buffered_roads'.
Creating the Shoreline [Optional]
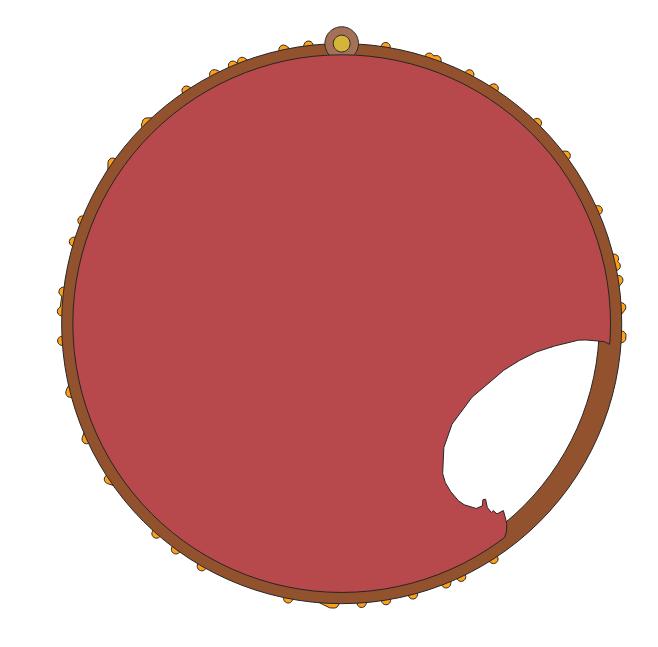
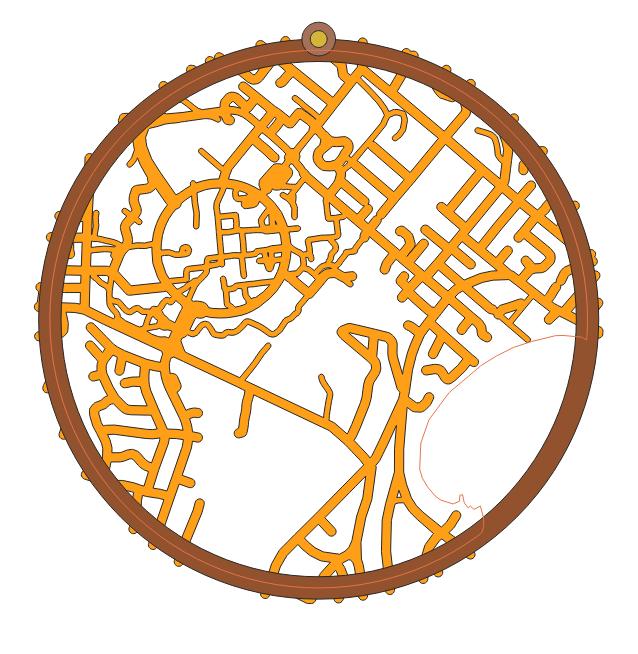
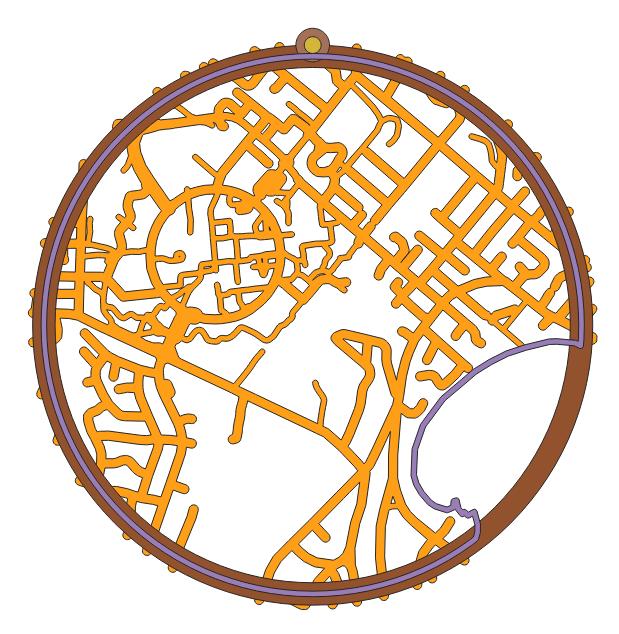
If you're not planning to add a shoreline line to your ornament, go ahead and skip this step. Otherwise, here's how I do it! I realize I did things out of order here and the unclipped road layer still shows up in these images - sorry!
Clip the land border [First Image]
I start by clipping the land border to the middle circle layer that we created in Step 7:
- Open the 'Clip' tool from the processing toolbox.
- In the Input layer, select the land border layer.
- In the Overlay layer, select the middle circle layer.
This creates a polygon of the land just within the middle circle boundaries.
Convert the polygon to a line [Second Image]
- Open the 'Polygons to lines' tool from the processing toolbox.
- Select the clipped layer that was just created as the Input layer.
This creates a line around the clipped land border.
Buffer the line [Third Image]
Buffering the line works in the same way that it did for the road layers.
- Open the 'Buffer' tool from the processing toolbox.
- Select the lines layer that was just created as the Input layer.
- For the distance, I plan to make mine 1mm wide = 20m buffer
Notice that the buffered shoreline stays completely within the boundaries of the ornament frame. The ability to do this is another advantage of creating the middle circle since it allows us to buffer the land border outline without extending outside of the ornament frame.
Creating Symbols [optional]
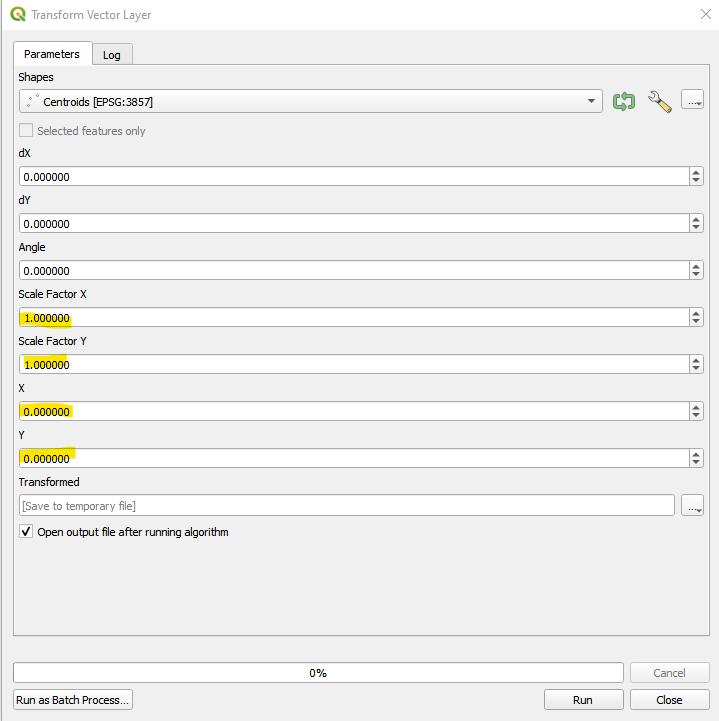
This step and the following few steps will detail the creation of the house and heart symbols that you can put on your map to personalize them even more. These can definitely be added in a different design program (such as Inkscape, though I've found it doesn't always behave as expected), but I think it's kind of fun to try and do everything in QGIS! If you're not interested in adding them here, go ahead and skip to Step 19!
If you're interested in other shapes, you could try this QGIS plugin (if you click on 'Details' then 'Code Repository', you can see which shapes are available. Oddly enough it was developed by the US National Security Agency!). I haven't used it before, but it may make things easier if you're looking to try some other symbols.
I won't go into too much detail in the following steps since there are numerous ways to interact with and modify polygons in QGIS, but I'll show a basic overview of how I made my house and heart symbols. These instructions use QGIS tools from the processing toolbox to do the operations. If you're comfortable with the Advanced Digitizing Toolbar, you can use some of those tools instead to accomplish the same thing.
The following steps assume that you have a point created already to use as the center point for the shapes that are created. If you haven't use the same method as you used in Step 6 to create a temporary scratch layer for a point.
Try to create the shapes in the size that you want them right away, as scaling without moving can be tricky. If you do need to change the size of the shape, I find the best way is to:
- Run the 'Add geometry attributes' tool on the shape center point layer.
- Open the attribute table of this layer to find the X and Y coordinates of the point.
- Run the 'Transform vector layer' tool (shown in image - it's listed under SAGA>Vector general in the processing toolbox).
- Put in however much you want to scale it in the Scale Factor X and Y boxes.
- In the 'X' and 'Y' boxes, put in the X and Y coordinates from the point layer.
House Symbol [Optional]
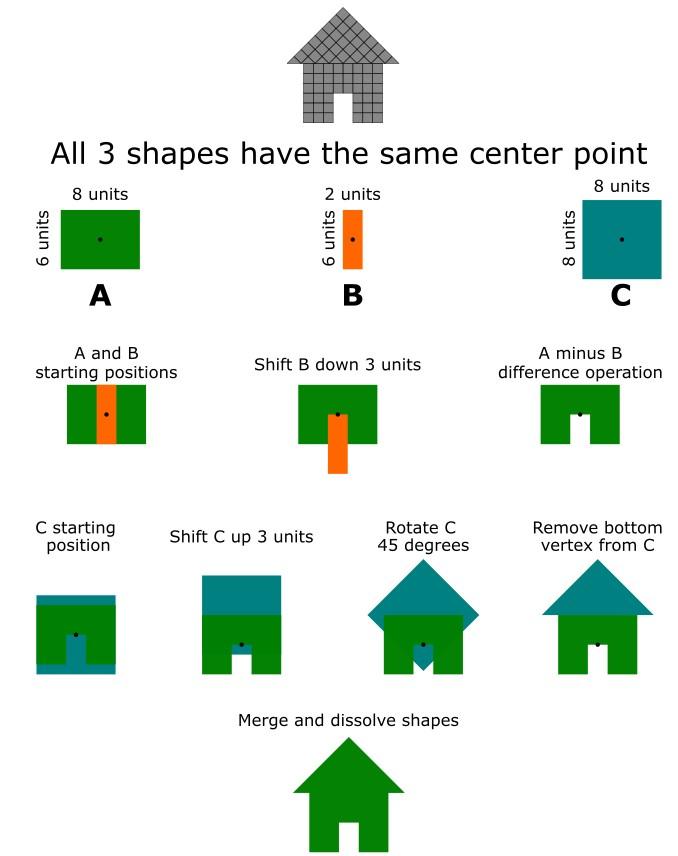
The basic structure of the house is shown at the top of the image, where I've used squares to represent one "unit", so it can be created in whatever size you want using map units in QGIS.
The rest of the image shows the initial shapes and their size in units. In QGIS, shapes are created around a point, so the common center point is shown as well, followed by the operations that are performed to create the house shape.
Create the basic shapes
- Shape A: Use the 'Rectangles, ovals, diamonds' tool to create an 8 unit wide by 6 unit tall rectangle.
- In my case, I wanted the width of the base of the house to be about 400 meters (decided by using the measure tool to see what I thought looked good). So for my map, one unit is equal to 50 meters, and the first rectangle that I create is 400 meters wide by 300 meters tall.
- Shape B: Use the 'Rectangles, ovals, diamonds' tool to create a 2 unit wide by 6 unit tall rectangle.
- For my map, that's 100 meters wide by 300 meters tall.
- Shape C: Use the 'Rectangles, ovals, diamonds' tool to create a 8 unit wide by 8 unit tall rectangle.
- For my map, that's 400 meters wide by 400 meters tall.
Modify the shapes
- Use the 'Translate' tool to move Shape B down by 3 units.
- Use the 'Difference' tool with Shape A as the input and Shape B as the overlay.
- I'll call this Shape A-B.
- Use the 'Translate' tool to move Shape C up by 3 units.
- Use the 'Rotate' tool to rotate Shape C 45 degrees.
- Turn on editing for Shape C.
- Select the 'Vertex Tool' (near the editing pencil icon in the 'Digitizing' toolbar).
- Select the bottom point of Shape C and delete it. Turn off layer editing and save the changes.
- This will turn Shape C into a triangle.
- Use the 'Merge Vector Layers' tool to merge Shape A-B and Shape C.
- Use the 'Dissolve' tool to turn it into a solid shape.
- To move it, turn on layer editing then select the 'Move Feature' tool in the 'Advanced Digitizing Toolbar'
Heart Symbol [Optional]
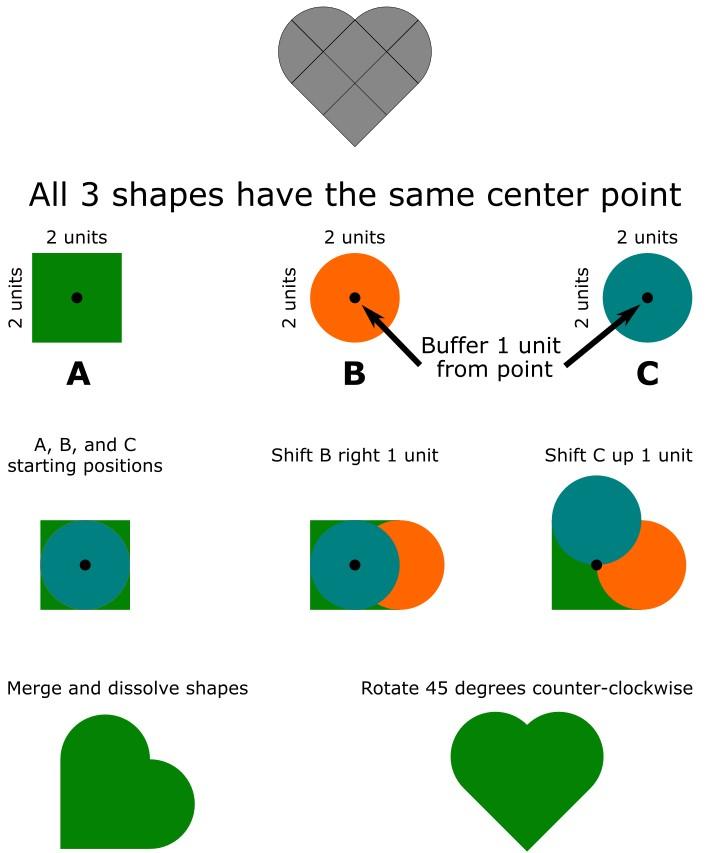
A simple heart can be created from just two circles and a square and is less complicated than the house.
Create the basic shapes
- Shape A: Use the 'Rectangles, ovals, diamonds' tool to create a 2 unit wide by 2 unit tall square.
- I want my heart to be similar in size to the house so I decided that 1 unit would be equal to 175 meters. So the square should be 350 meters wide and 350 meters tall.
- Shape B: Use the 'Buffer' tool to create a circle with a buffer distance of 1 unit. Be sure to increase the number of segments to make your circle more round!
- For my map, that's 175 meter buffer.
- Shape C: Same as Shape B.
Modify the shapes
- Use the 'Translate' tool to move Shape B right by 1 unit.
- Use the 'Translate' tool to move Shape C up by 1 unit.
- Use the 'Merge vector layers' tool to merge Shape A, Shape B, and Shape C.
- Use the 'Dissolve' tool to turn the heart into a solid shape.
- Use the 'Rotate' tool to rotate it 45 degrees counter-clockwise.
- To move it, turn on layer editing then select the 'Move Feature' tool in the 'Advanced Digitizing Toolbar'
The Final QGIS Steps
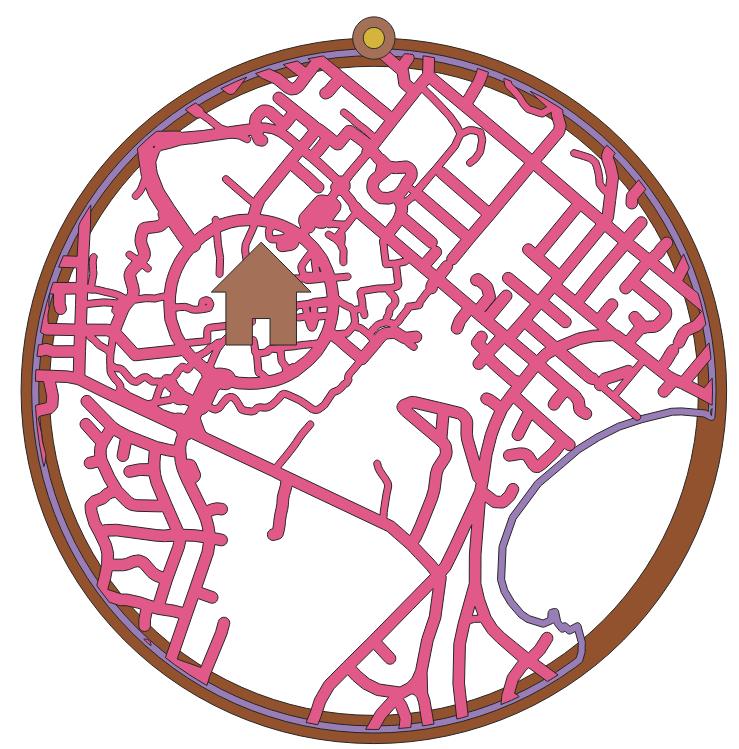
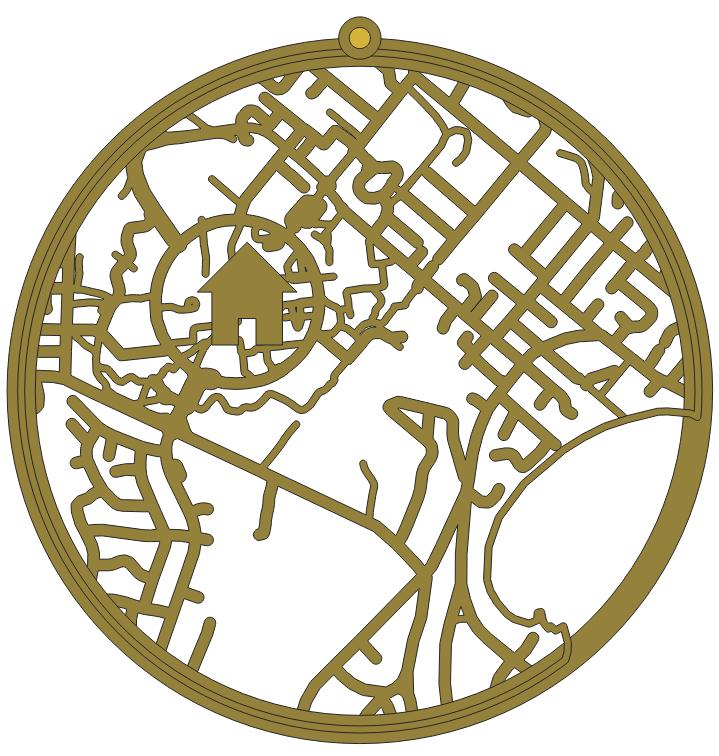
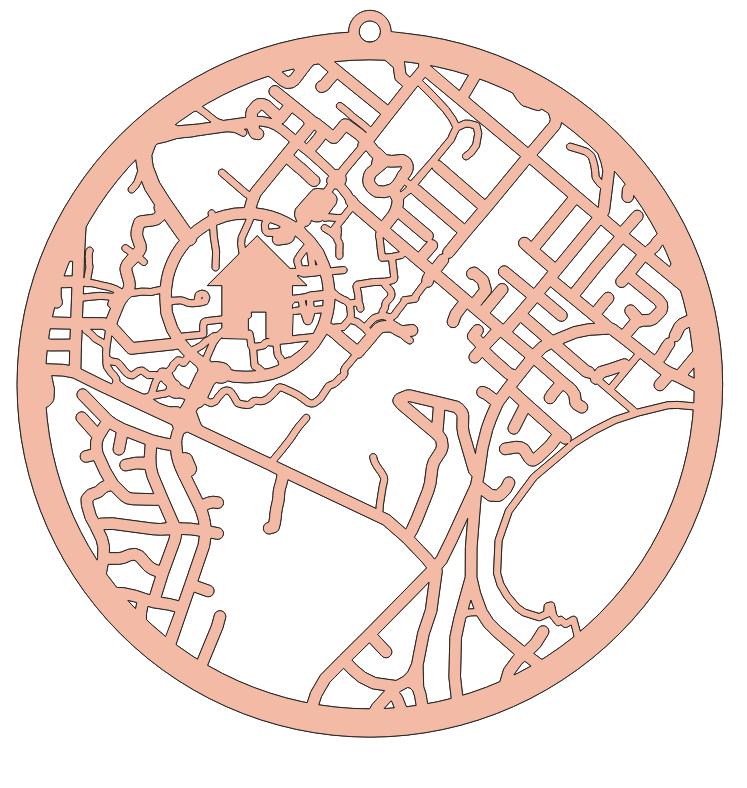
The final few steps merge all of the layers together and clean it up a bit. At this point, you should have [First Image]:
- Frame
- Top string circle
- Top string hole
- Clipped buffered roads
- Shoreline [optional]
- House/heart/other symbol [optional]
Merge [Second Image]
The first merge that we need to do is the frame, top string circle, clipped buffered roads, shoreline, and symbol.
- Open the 'Merge Vector Layers' tool from the processing toolbox.
- Select the three little dots next to the Input layers box.
- Select the frame, top string circle, clipped buffered roads, shoreline, and symbol layers.
- Confirm that the Destination CRS matches your project CRS
- You can tell what's merged in the image because all shapes are the same color. If something's missing, run another merge with the missing layer, or just delete the merged layer and try again!
Adding the string hole [Forgot to take a screenshot - sorry!]
All of the previous layers are now in one layer and we need to add the string hole in the top.
- Open the 'Difference' tool from the processing toolbox.
- Select the previously created merged layer as the Input layer.
- The Overlay layer should be the top string hole layer.
Dissolving boundaries [Third Image]
Everything is all in one layer and the hole is there now, but all of the lines for the borders of each layer are still there, and we need to get rid of those or the laser will later cut along every line. To combine everything into a single shape:
- Open the 'Dissolve' tool from the processing toolbox.
- Select the previously created merged layer with hole as the Input layer.
- Don't add anything to the Dissolve field.
Deleting Small Holes [optional]
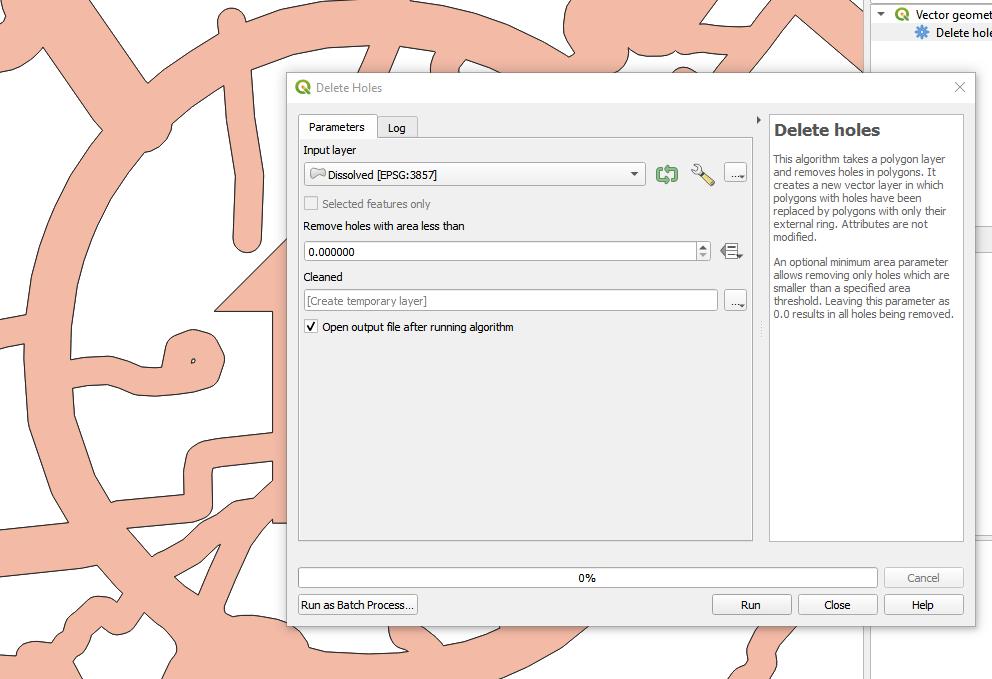
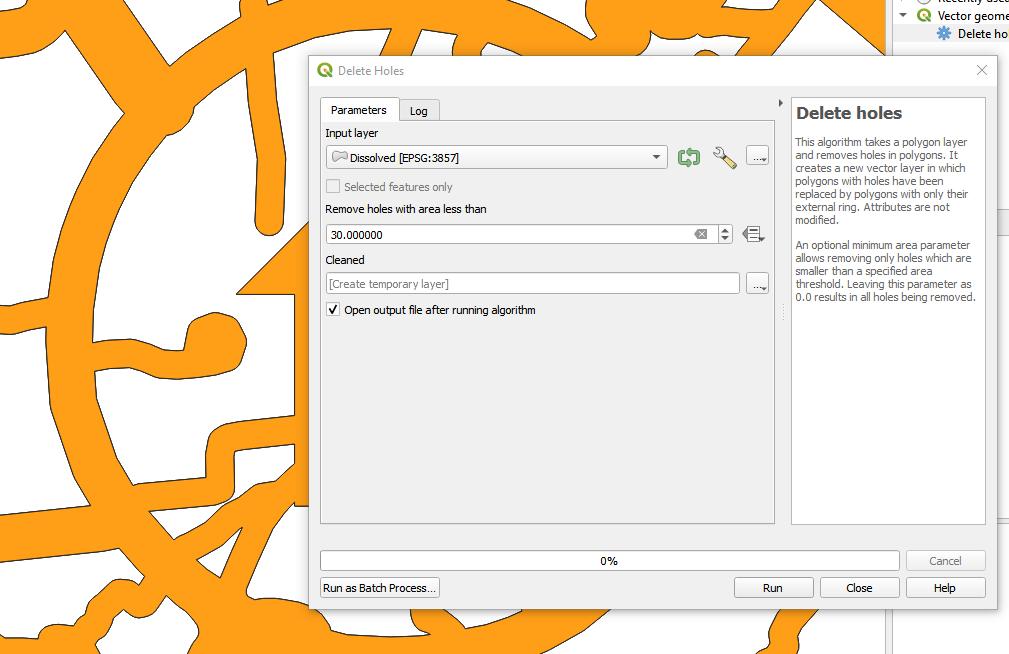
Sometimes, if there are very small cutout areas in the map (like what's shown in the first image), the laser will end up just burning a tiny area and it won't look very good, so I like to run an additional step to get rid of any of these small holes. Thankfully, QGIS has a tool that can do just that!
- Open the 'Delete Holes' tool from the processing toolbox.
- The previously created dissolved layer should be used as the Input layer.
- For the 'Remove holes with area less than' parameter, I sometimes need to try a few values to see what works.
- For my map, I'm trying to get rid of any holes the size of the one shown in the first image or smaller.
- I'll start with a value of 20 to see if that works.
- 20 didn't work, so I'll remove that layer and increase the value to 30.
- In my case, 30 worked fine, but you may need to continue to incrementally increase the value to get it to work.
That's it for the main part of the road map!
Exporting
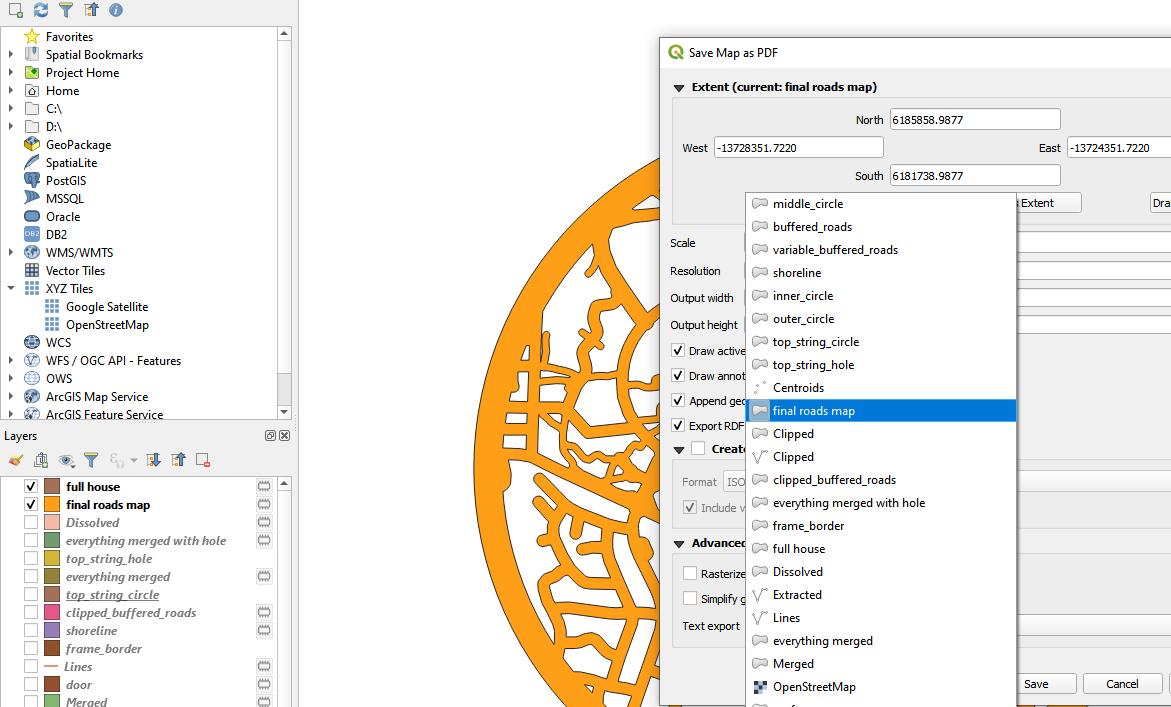
If you've added a symbol to your map, make sure that you turn that layer on so that it will be exported. This needs to be done so that you can first engrave the symbol with the laser, then cut out the area around it.
It's important to make sure that only the main roads layer and the symbol layer are turned on in the Layers panel before you export. If you accidentally export additional layers and load those files into the laser cutter, you may end up going over some lines multiple times if they were hidden behind the final cut layers.
I know I said I was going to do everything in QGIS, but for exporting, my preference is to export to a PDF, open the PDF in Inkscape to adjust the sizing and change the layer styling. Other ways work as well though that can be opened directly by some laser cutter software! You can export to DXF or use the QGIS Layout Manager to export to SVG.
Exporting to PDF
- Turn on the roads and symbols layers.
- Click Project>Import/Export>Export Map to PDF...
- As shown in the image, for the Extent, click Calculate from Layer, then select your final roads layer
- Uncheck the box next to 'Simplify geometries to reduce output size' (unless your map is super huge, but even then I don't think it would be too much of an issue).
- Click Save!
Inkscape Processing
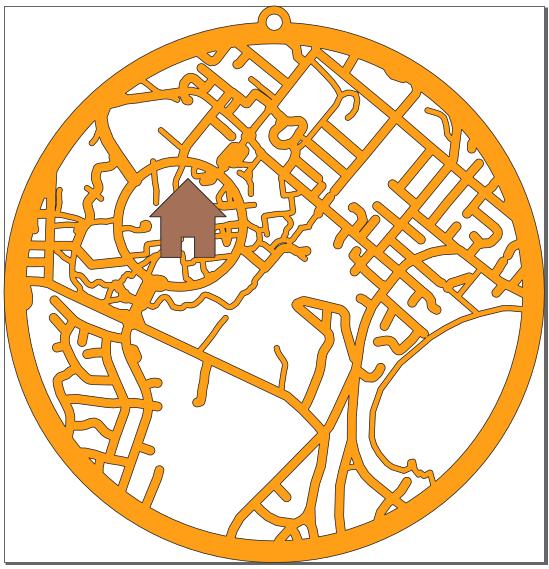
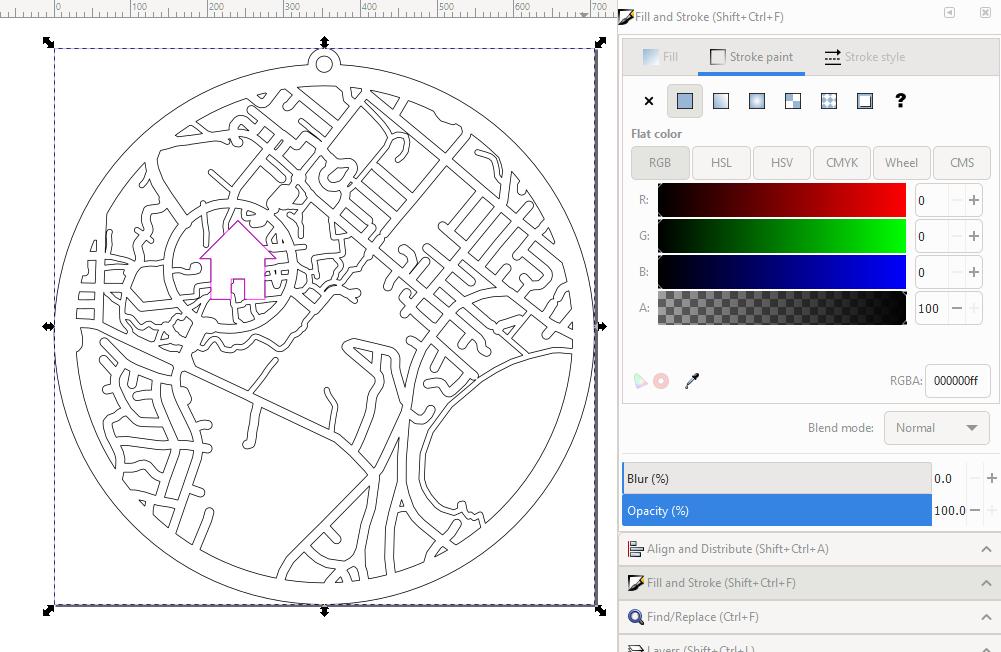
To do the final processing in Inkscape, open the PDF in Inkscape (the default opening settings are fine).
As far as I understand things, the PDF that QGIS exports contains the map layers as SVG path data but groups them all together into one group along with a plain white background layer as shown in the first image. We need to separate the layers into individual objects in Inkscape to process them. To do this:
- Click anywhere on the map.
- Hit Ctrl+Shift+G at least 3 times to ungroup the objects.
- Click somewhere in the white empty space to select the plain white background layer and hit Delete.
Changing stroke/fill [Second Image]
Click Object>Fill and Stroke... to open a menu in Inkscape that will allow you to change the fill and stroke colors of the objects (the roads and house layers) that you're working with.
The laser cutter software that I use (Lightburn) doesn't really care what colors you use for your lines (and ignores fill completely) as long as you separate the color for engraving from the color for cutting. I like to use blue for engraving and black for cutting, so that's what I'm going to do.
- Select the house.
- If you don't see the house, select the roads layer and hit the End key to send the roads layer to the bottom so the house will be on top of it. This doesn't matter as far as the SVG or laser cutter file is concerned, but helps for our own visualization.
- If you select the house and the roads layer gets selected as well, hit Ctrl+Shift+G a few more times to ensure that they're ungrouped.
- On the 'Fill' tab of the fill and stroke panel, click the X to remove the fill.
- On the 'Stroke Paint' tab, change the R and G values to 0 and the B value to 255.
- Select the roads.
- On the 'Fill' tab of the fill and stroke panel, click the X to remove the fill.
- On the 'Stroke Paint' tab, change the R, G, and B values all to 0.
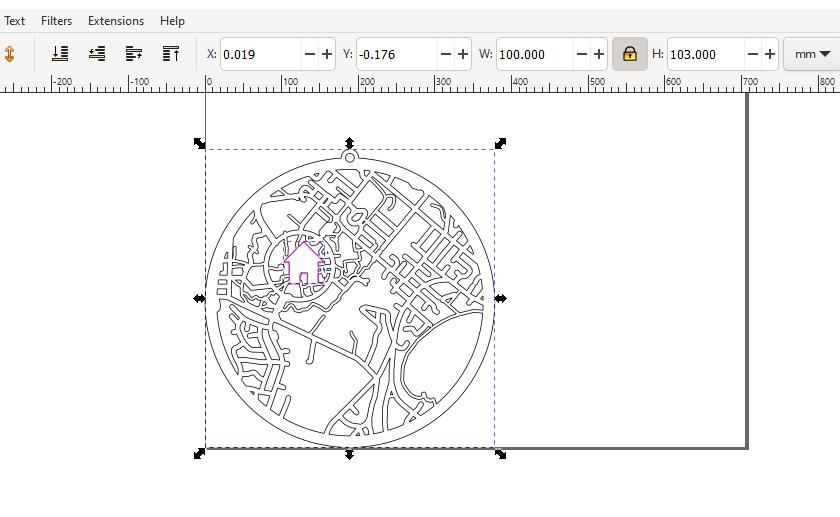
Resizing [Third Image]
It's unlikely that the exported map will be exactly the right size. To change it:
- Hit Ctrl+A to select everything in the Inkscape window
- In the measurements area at the top, make sure that the lock icon is in the "locked" position as shown in the third image.
- Change the units to mm.
- Change the W value to your map width. In my case, I had chosen 100mm initially.
Saving
Click File>Save As to save the file as an SVG that can be opened with almost any laser cutter software.
Cutting
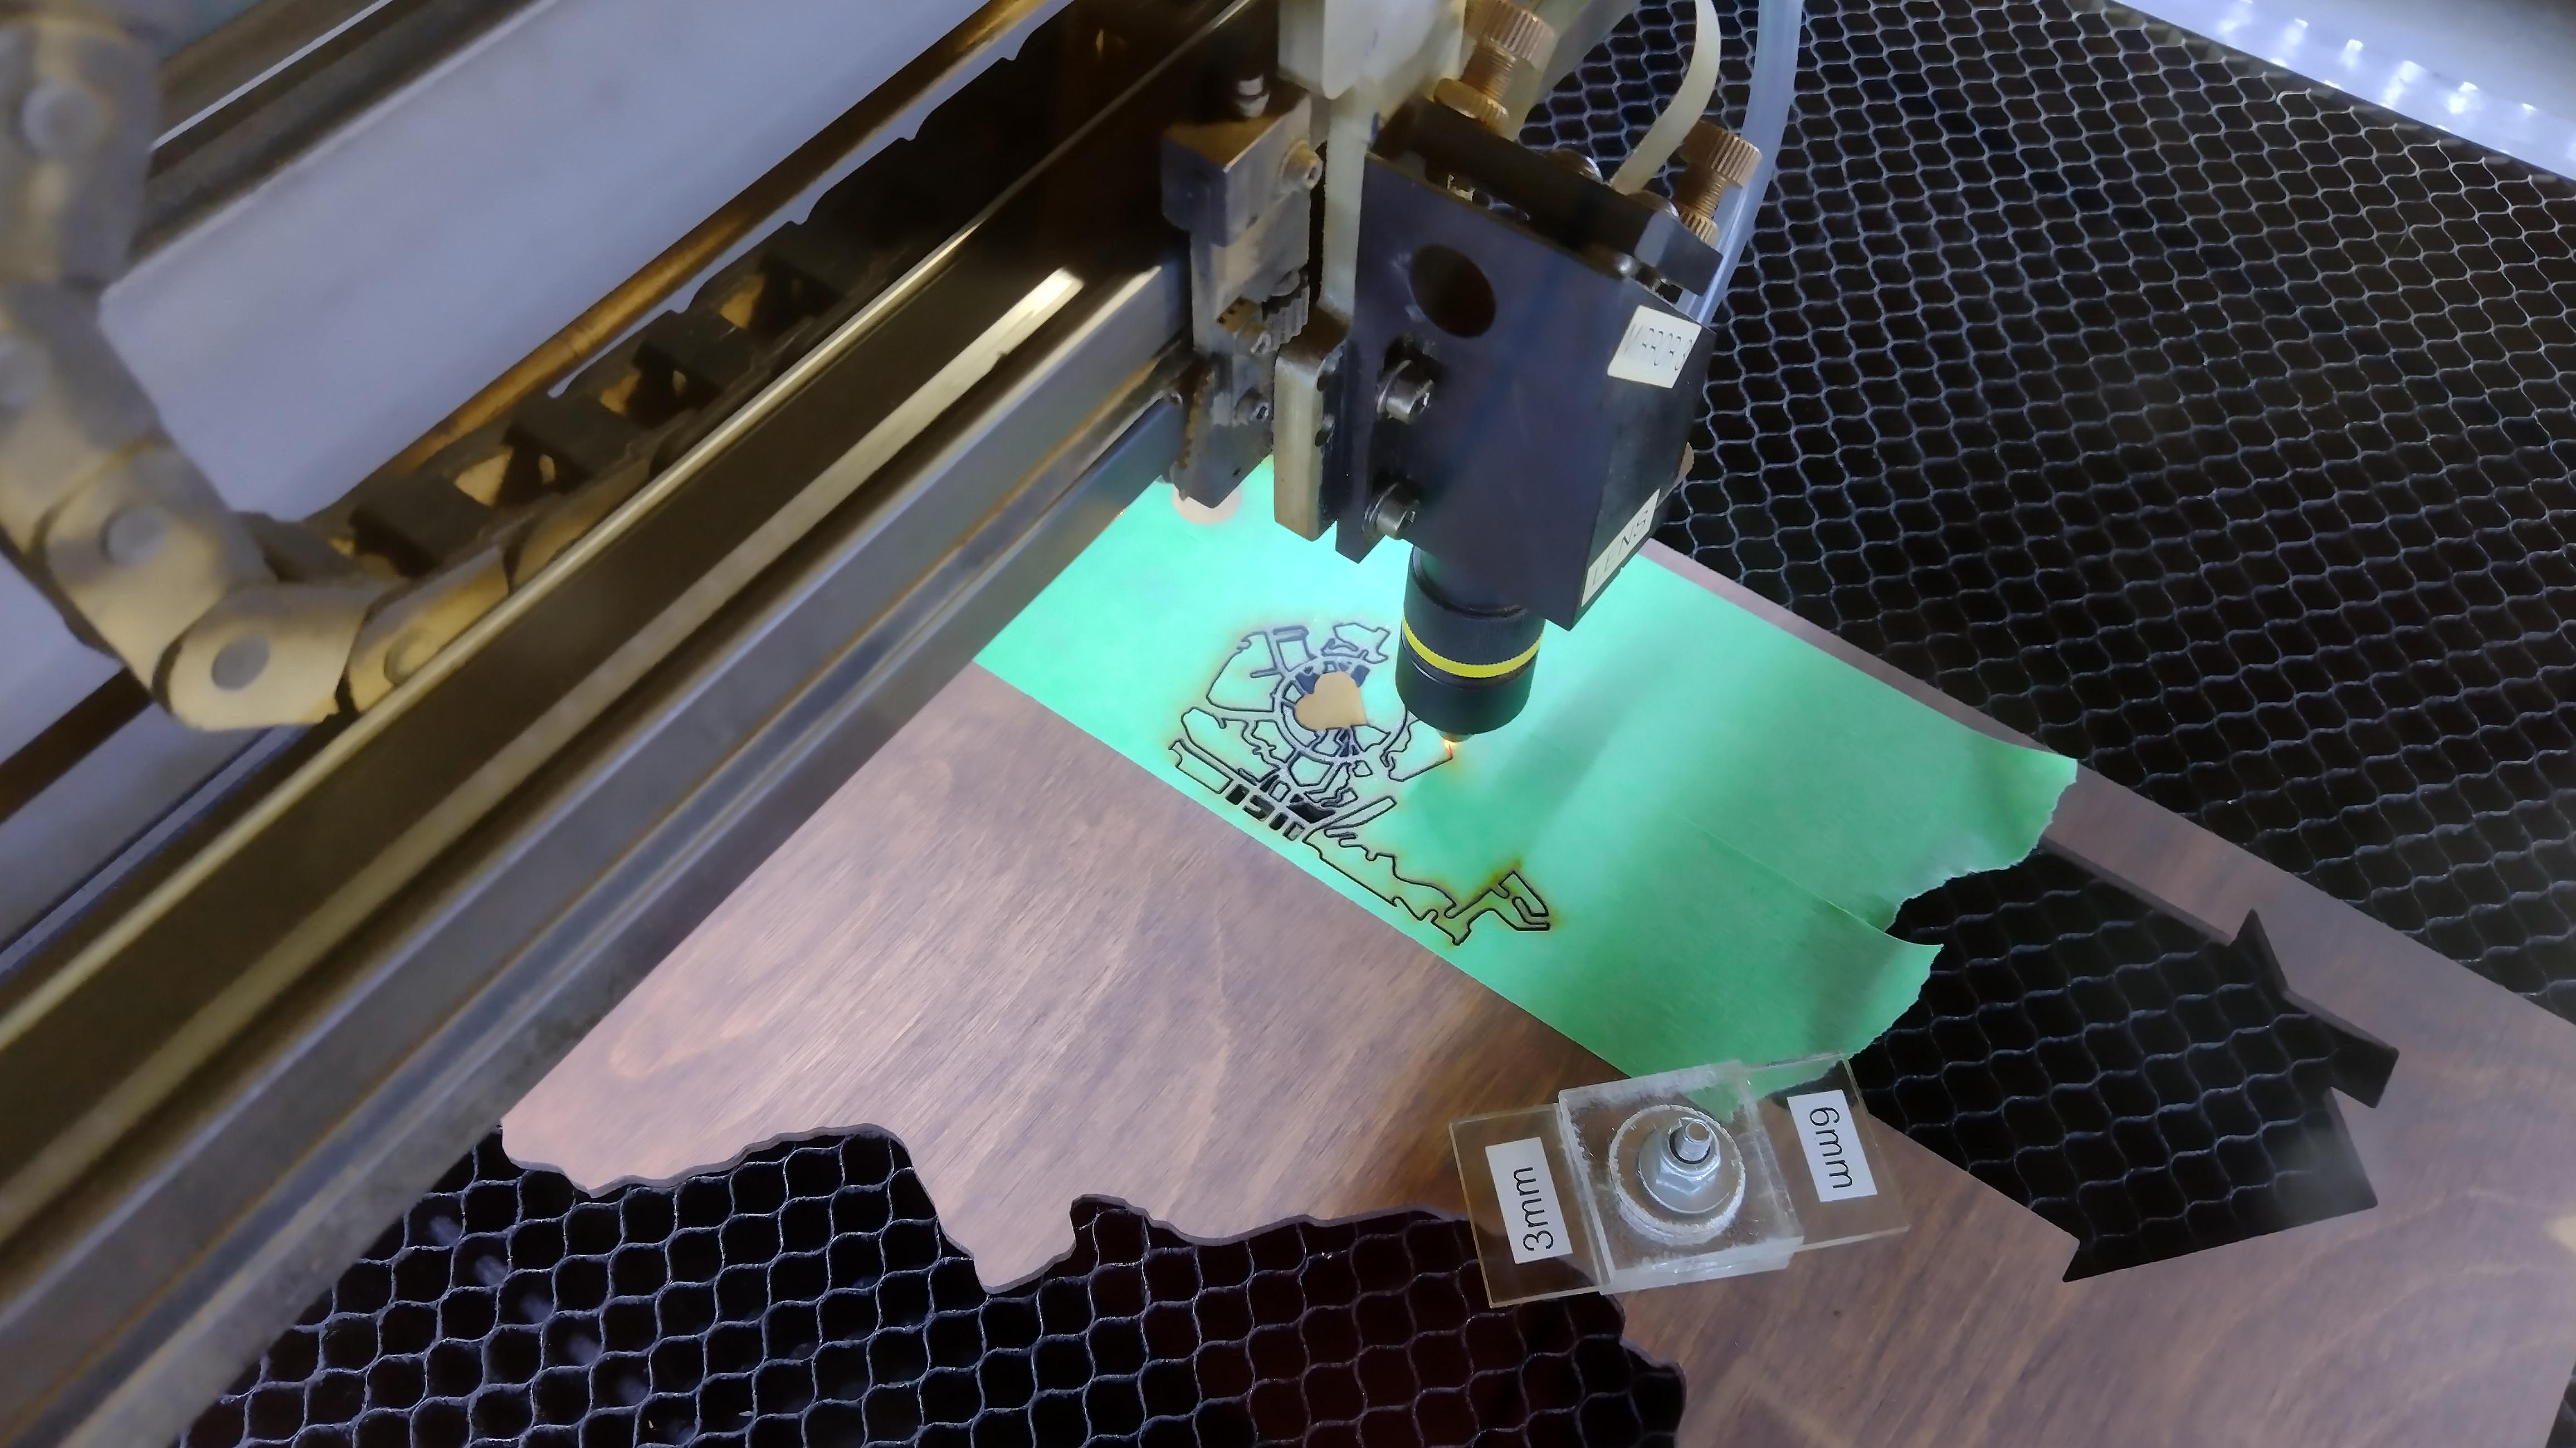
Open the SVG file in your laser cutter software, adjust the values for the engraving and cutting layers, and cut away!
I like to put masking tape on my wood so that the top doesn't burn quite so much. The wood in this photo is stained with a dark stain. I then use a low power engraving for the symbol on the map, which burns through the stain layer, but doesn't make the wood underneath too dark. It ends up being a cool effect where the engraved area is lighter than the surrounding wood!
Finished Product
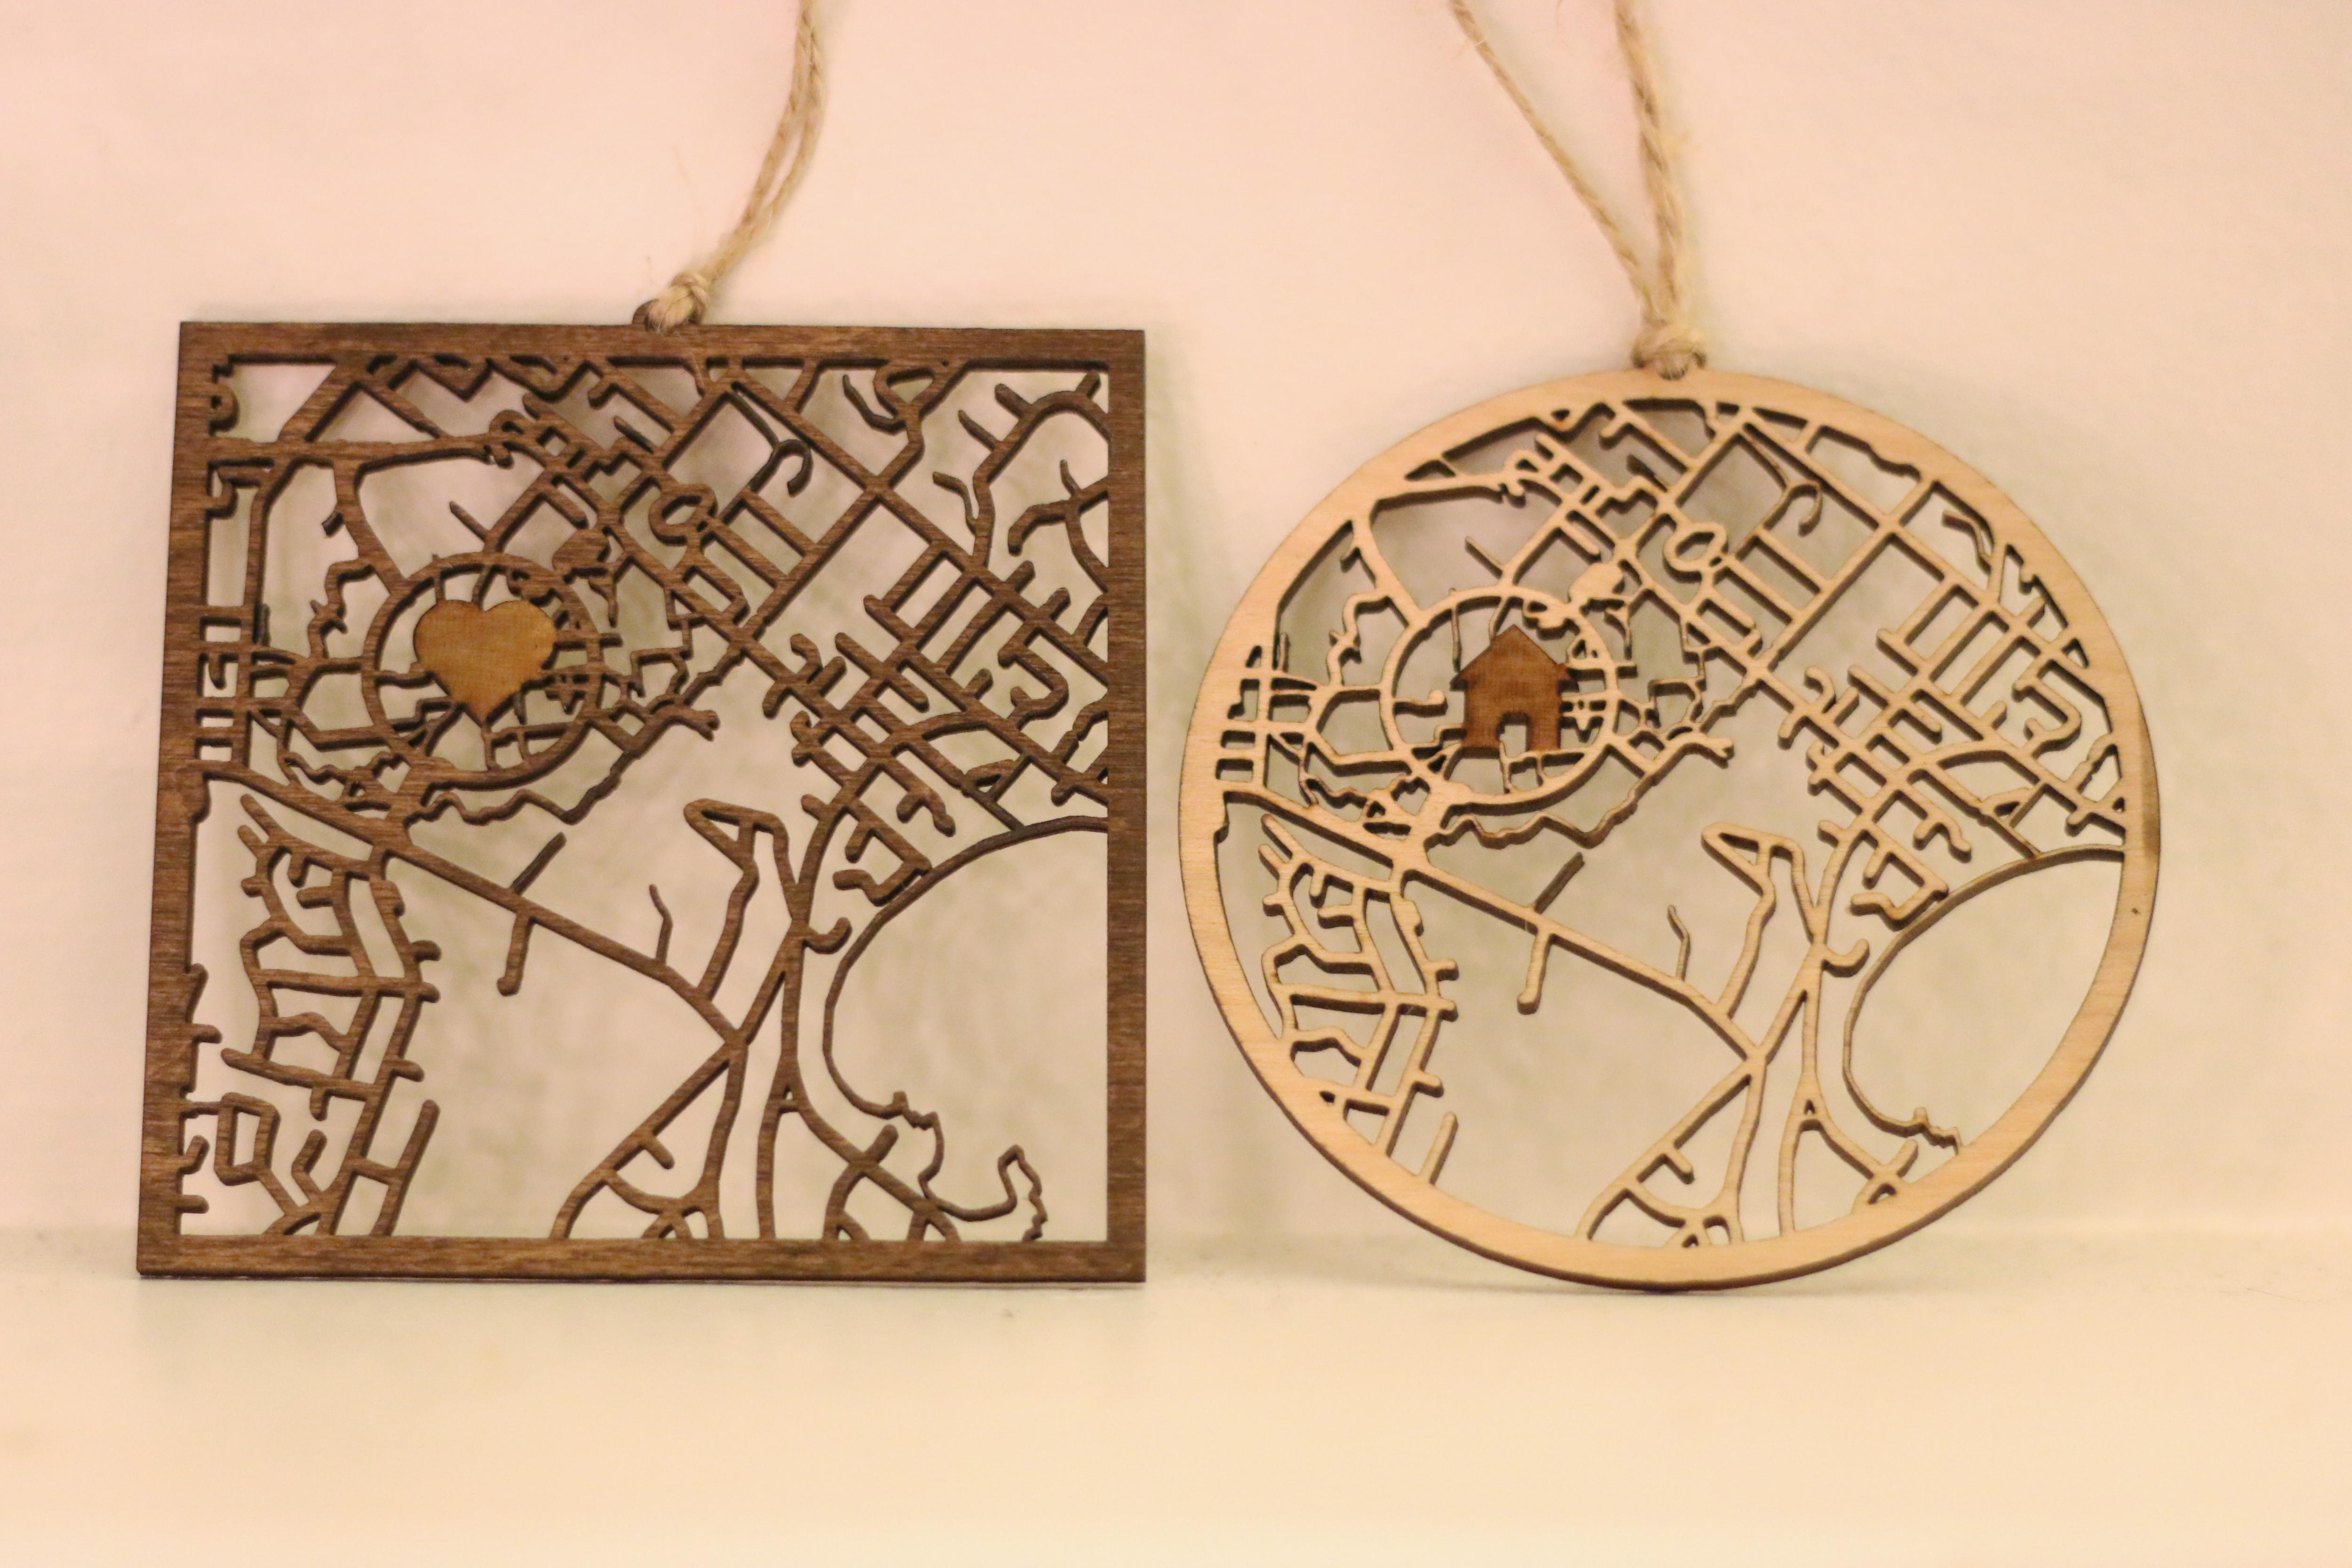
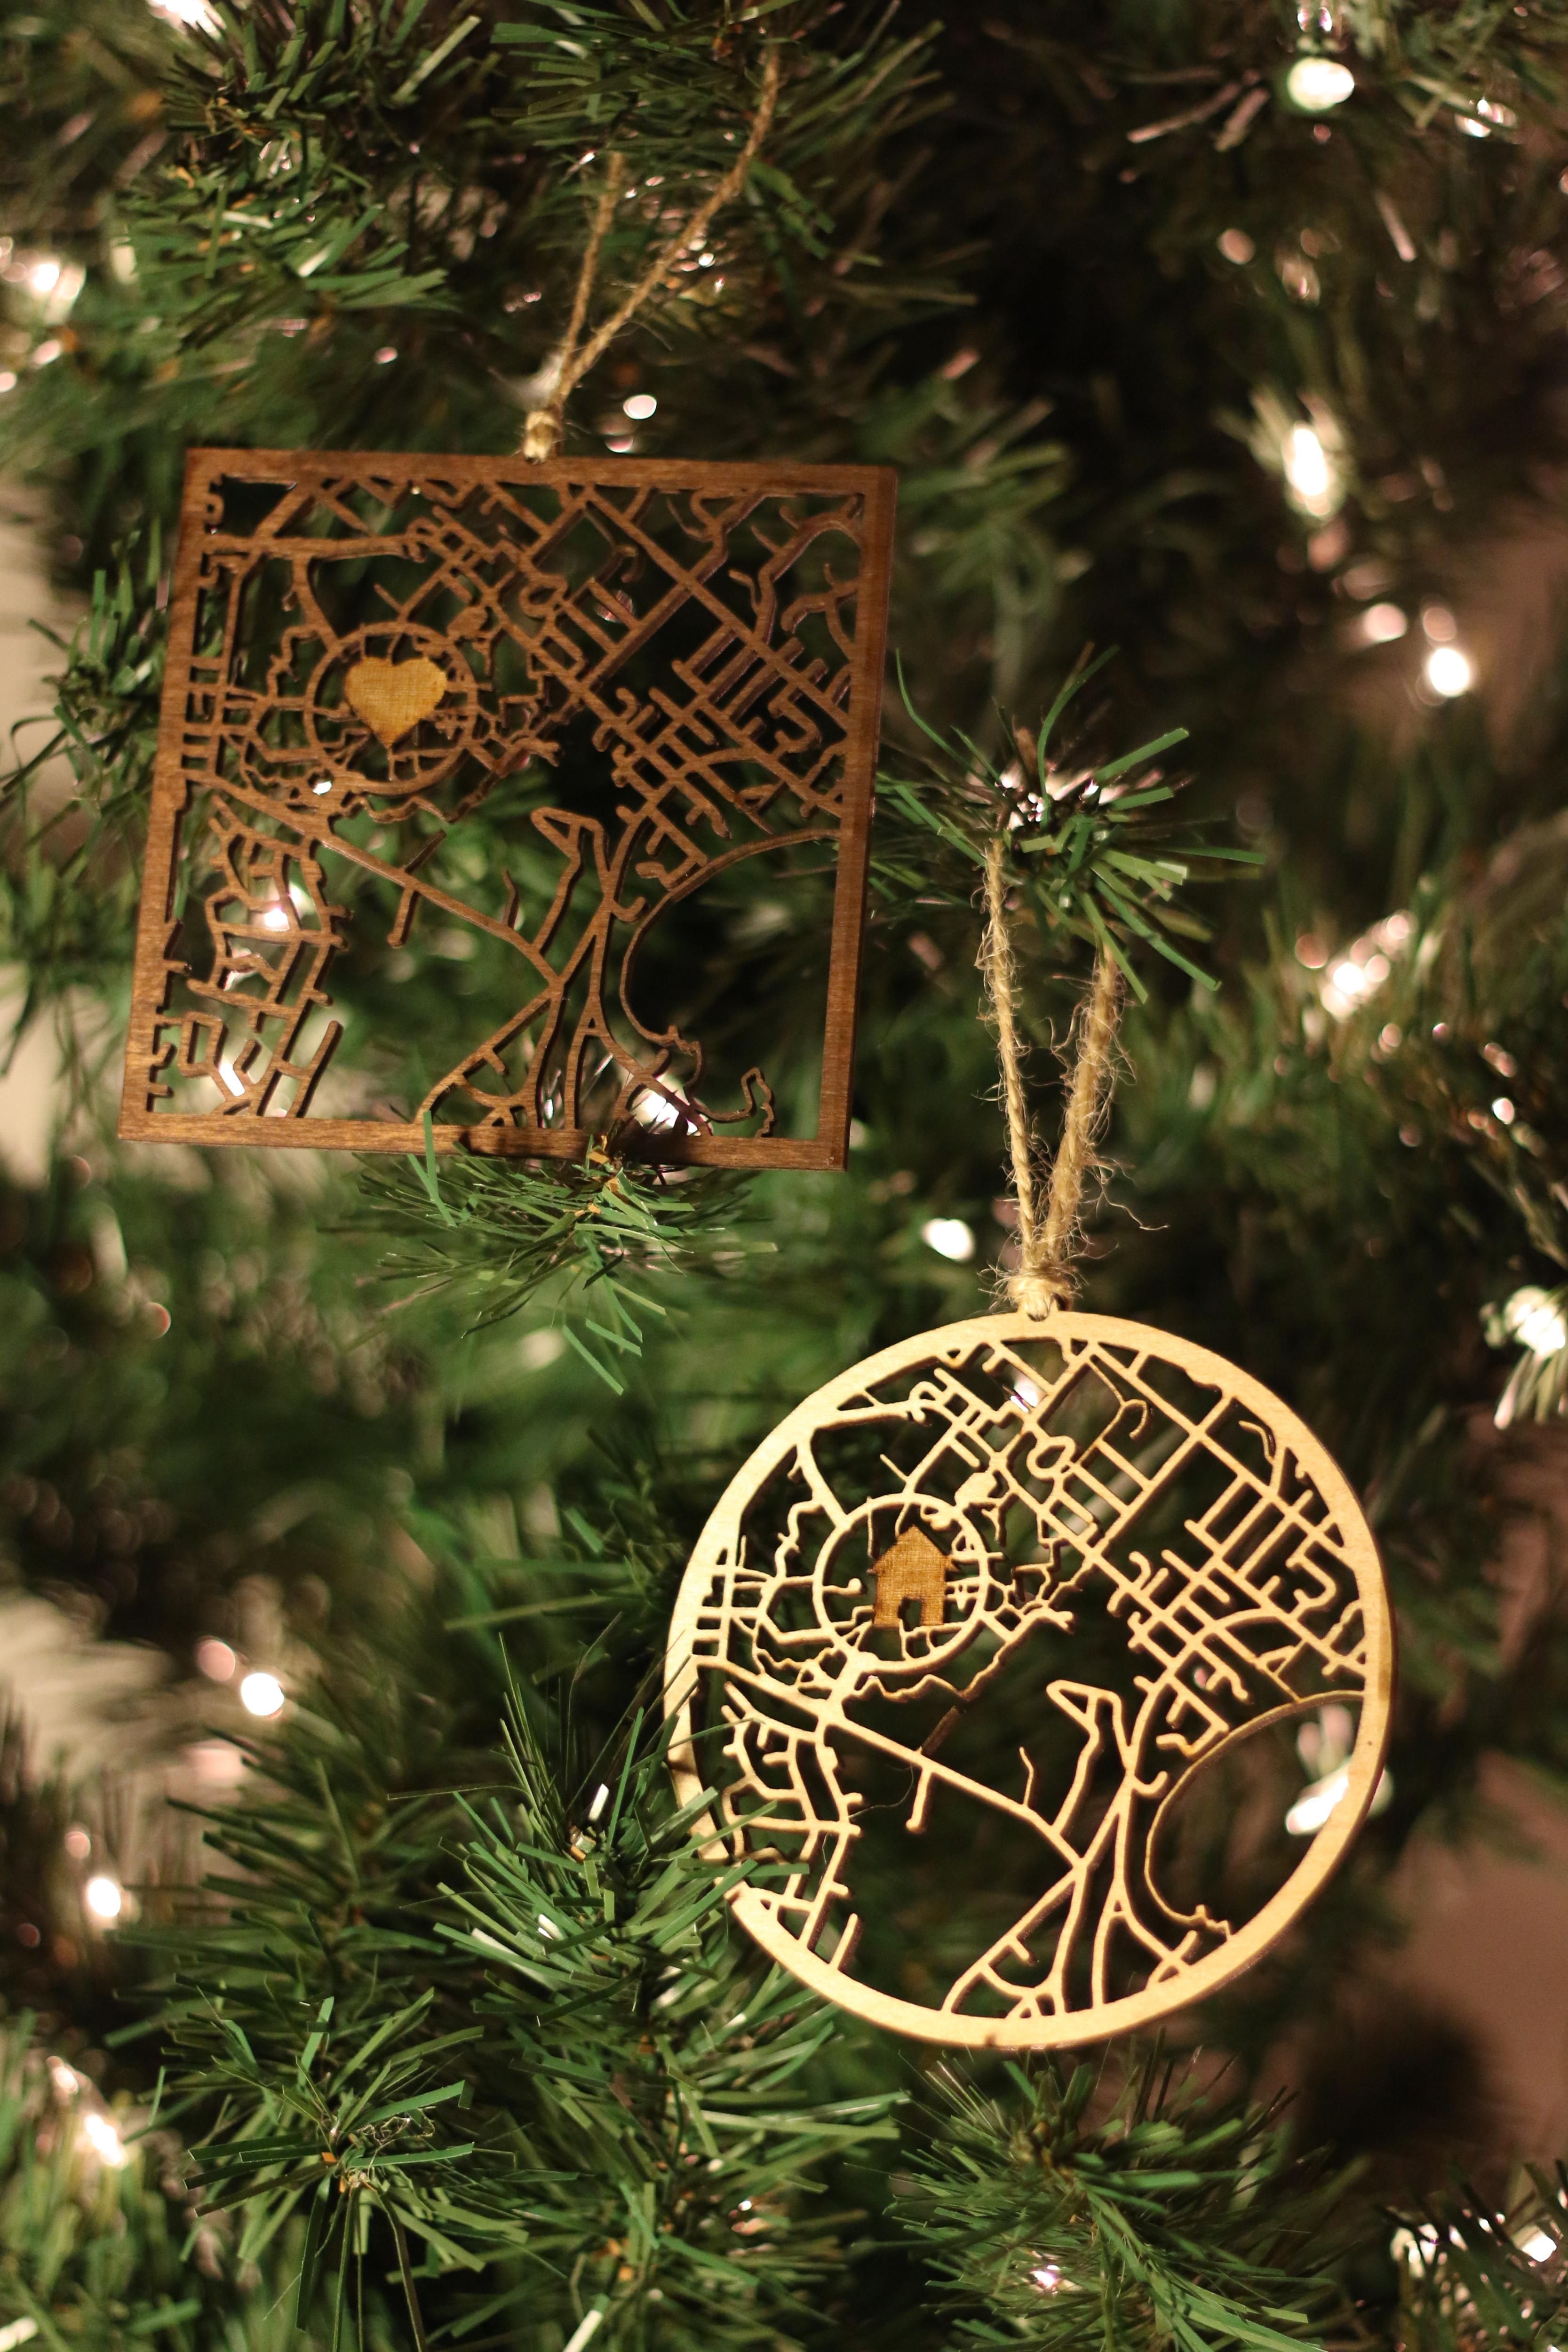
These ornaments make a fun gift for friends or family! Once you get the hang of the process, it really doesn't take too long to continue to make more. In addition, you can create a buffered road layer for an entire city/town, then just shift your frame and circles around to quickly make an ornament for a new location. You can also save your house or heart symbol as a shapefile or geopackage file and use the move tool to shift it to new locations rather than starting from scratch every time.
Please share photos if you make any of these and feel free to ask any questions if you have them!