IoT Dual Temperature Data Server
by PurpleShark in Circuits > Raspberry Pi
1698 Views, 16 Favorites, 0 Comments
IoT Dual Temperature Data Server
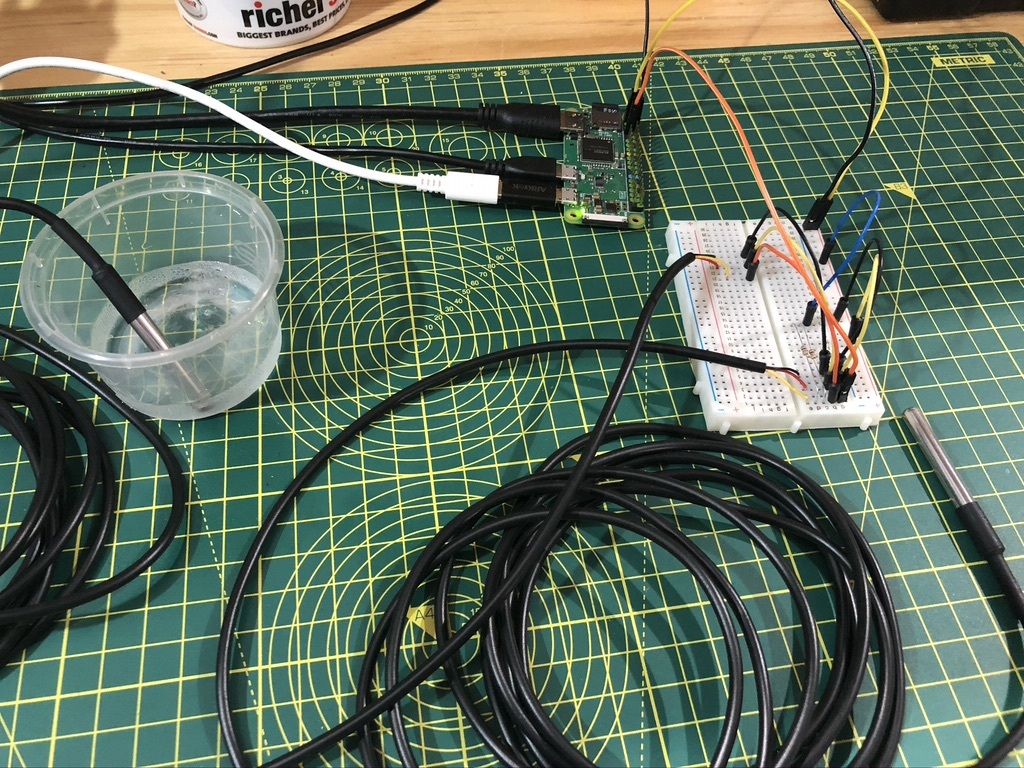
This is my first attempt at writing an Instructable and so please go easy on me! If you think this not too bad, then please vote for me in the First Time Author Contest.
This is my Lock-Down project to remotely monitor 2 temperatures in a greenhouse, one at floor level and one just under the roof. Although I had used Raspberry Pi’s (RPi) before, this project involved several elements I had not used and along the way, I found several tutorials that were out of date or just wrong. This is my collection of knowledge to make a working dual remote temperature monitor from a Pi Zero & 2 DS18B20+ One Wire Digital Temperature Sensors that was acquired along the way.
Things I learned about:
- Making data available from a device as part of the Internet of Things (IoT)
- 1-Wire interface with 2 devices
- Dataplicity
- JSON data
- Setting up the UFW firewall
- Using Freeboard.io to display the data
- Configuring the RPi to autorun the program
There are huge amounts of data that can be found with a simple search on all these topics, but what is not so clear is how to combine all these separate elements.
Supplies
- You will need a Raspberry Pi (with a monitor, mouse & keyboard for setting up but not when running the finished project)
- A working internet connection.
- A PSU with a Micro USB connector
- 2 of the DS18B20+ One Wire Digital Temperature Sensors. I found Amazon was the cheapest https://www.amazon.co.uk/gp/product/B07CZ1G29V/ref...
- 4K7 ohm resistor or I used 2 10K ohm resistors.
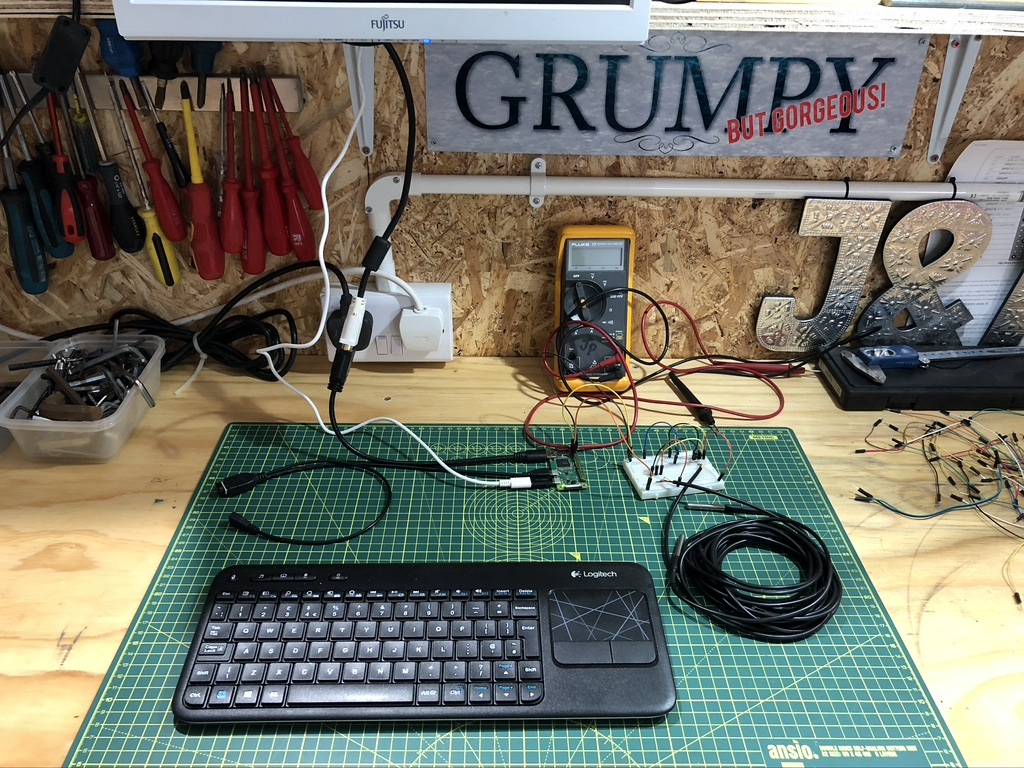
- Small breadboard and a few male/female wires for testing on the bench
- Small piece of stripboard for the final assembly
- Simple tools for soldering and wire stripping.
- Small plastic box to house the finished design
Hardware
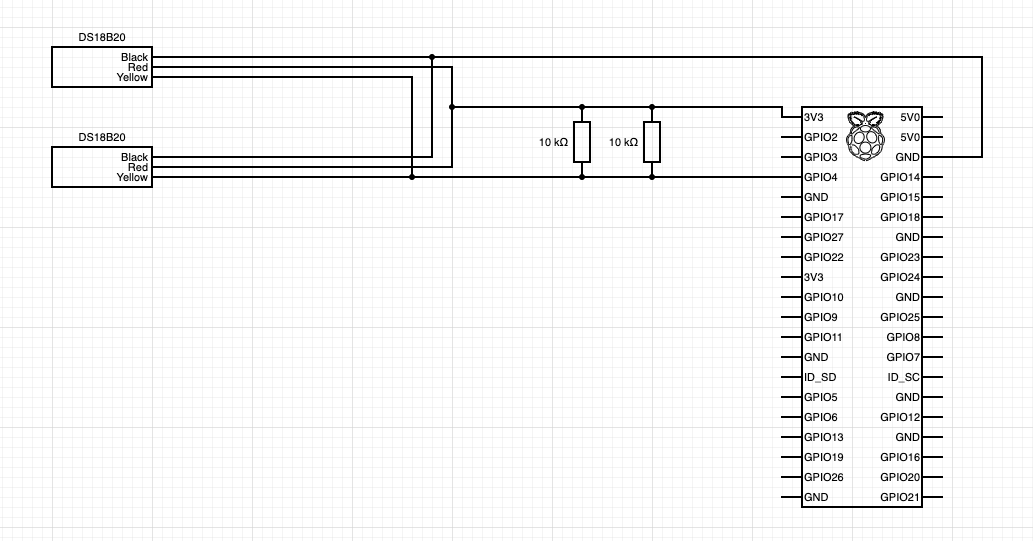

I already had a Raspberry Pi Zero W (with wireless) but I am sure this simple project will run fine on any of the RPIs. The box of odd electronic bits in my workshop had everything else (breadboard, wire, PSU etc) and so all I had to buy was two 2 x DS18B20 sensors from Amazon. These are the normal DS18B20 chips just conveniently mounted in a waterproof housing and 3m cable. There are 3 wires from the cable:
- Red – power – connect to the 3.3v pin 1
- Black – return – connect to the ground pin 6
- Yellow – data – connect to the GPIO4 pin 7
The sensors use the 1-Wire interface and were very easy to connect-up and obtain data from. There are several pages on the Web with details for connection of 1 device but very little on connecting 2 (or more).
For testing on the bench, the circuit was assembled using a breadboard. The tutorials I found stated to use a 4K7 resistor to bias the data line, but I could not find one & so used 2* 10K in parallel & it worked just fine. There are plenty of resources on the Web for using a breadboard to assemble RPi circuits and so I will not repeat them here.
Diagram created using Circuit Diagram https://www.circuit-diagram.org/editor/
Raspberry Pi OS Software Setup
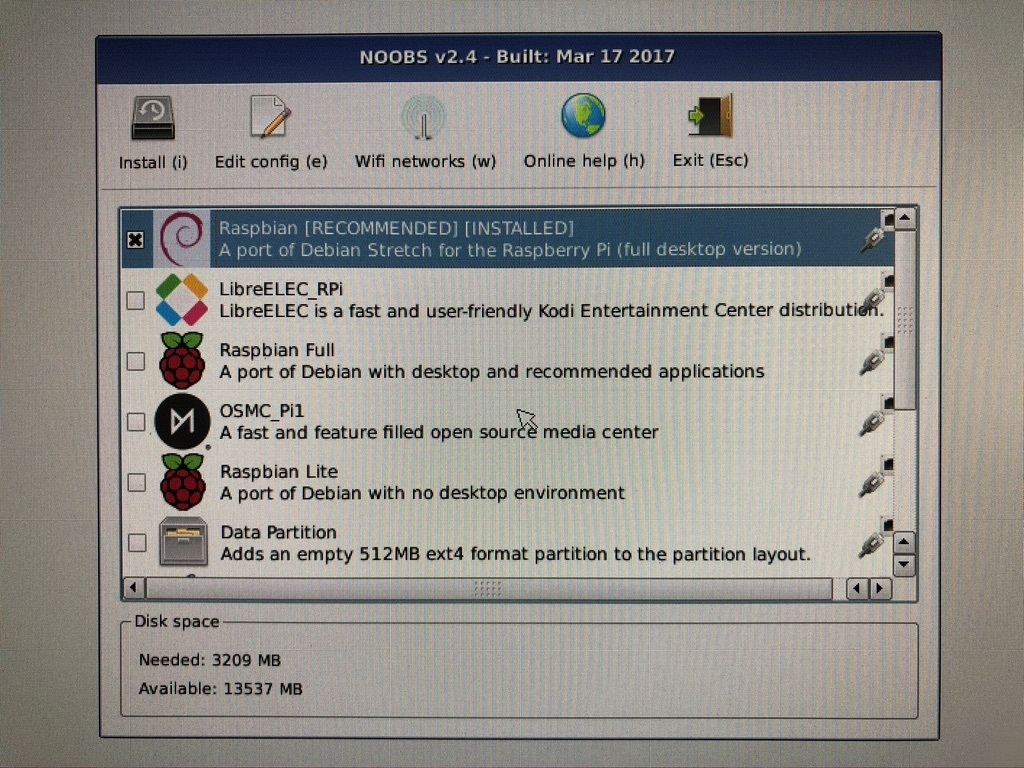
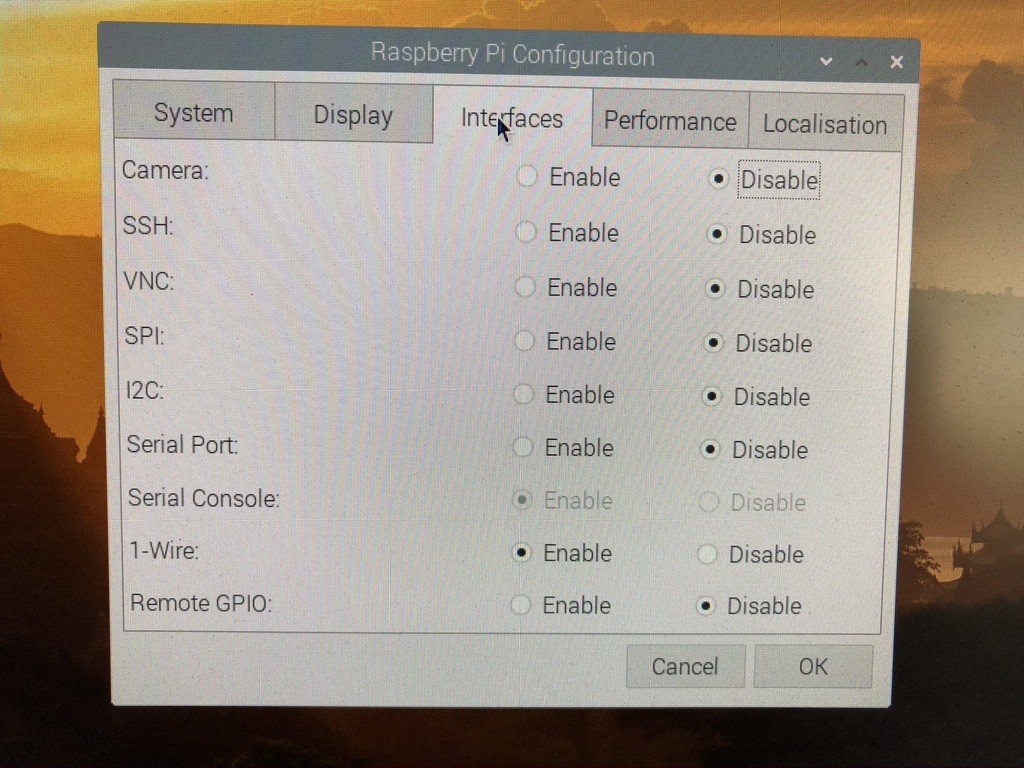
As I had used this RPi before, I decided to start with a clean installation of the OS, I reformatted the SD card and installed a clean version of NOOBS. I then installed the full desktop version of Raspian (the top option) as this would also install PIP & GIT that the lite version does not. Even though I didn’t need the Graphical User Interface (GUI) for the project, it is an easy way to setup all the options and with a 16gb SD card there was no shortage of space.
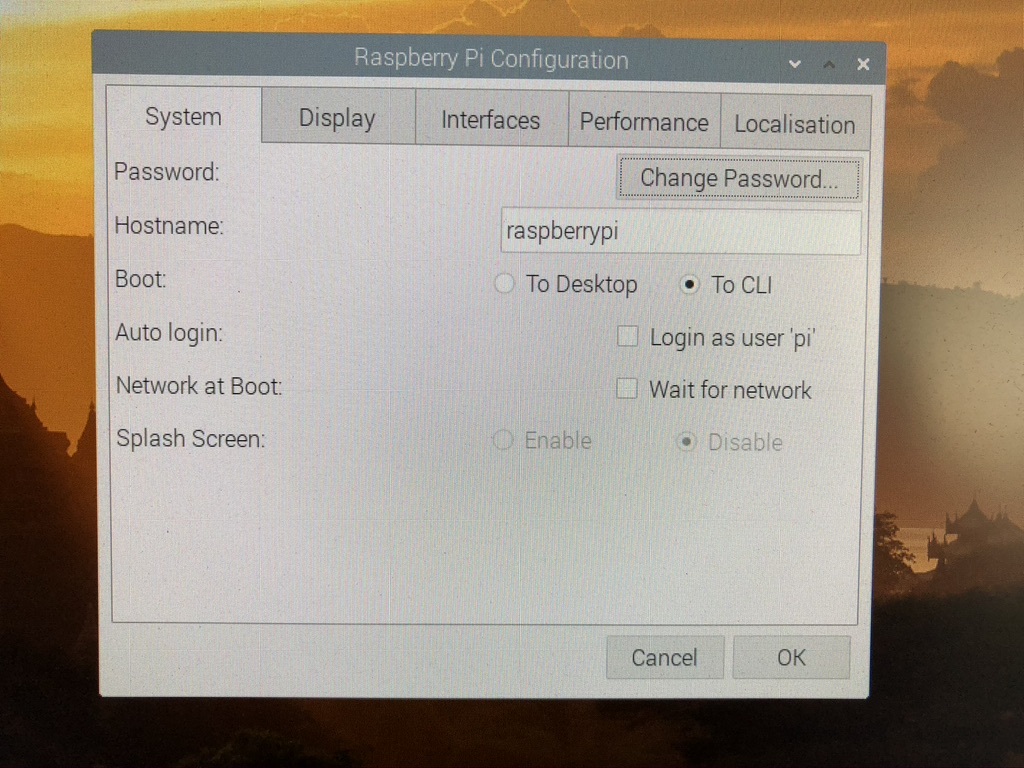
I set up WI-FI access then ran the full install & then the wizard with updates & upgrades etc. Using the GUI, I setup the RPI as needed just because using the GUI is simpler than the Command Line Interface (CLI). I went to the configuration window from the menu and then:
- On the system tab, I changed the password, set to boot to CLI and unchecked Auto Login
- On the interfaces tab, I enabled 1-wire
- Clicked ok & re-booted
If you need to get back to the GUI at any time just type startx at the CLI
startx
Setup Dataplicity to Allow Remote Access
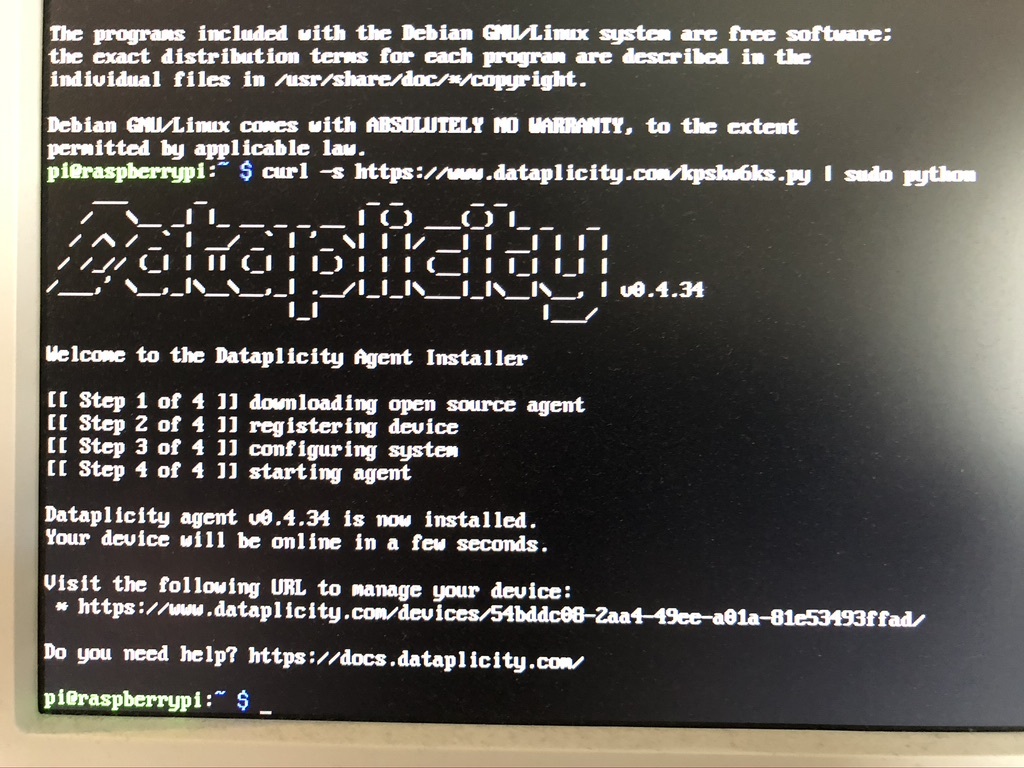

I found a really helpful blog entry on the Dataplicity site at https://blog.dataplicity.com/how-to-build-a-raspb... and used a few parts of this. Section 3 of the blog describes setting up Dataplicity for remote access to the RPi. I have never used Dataplicity before, but have to say, I thoroughly recommend it as a very simple remote access tool. Although the screenshots (in the blog above) are a little out of date, the principle is fine.
On your PC, go to Dataplicity.com and create an account (you could use the browser in the GUI, but rather slow on the RPi Zero). Then click the “add new device” button and a line of code is displayed in the pop-up window. Then go to the CLI on the RPi and type in the line of text. If all is okay, the Dataplicity logo will display and the install program will run.
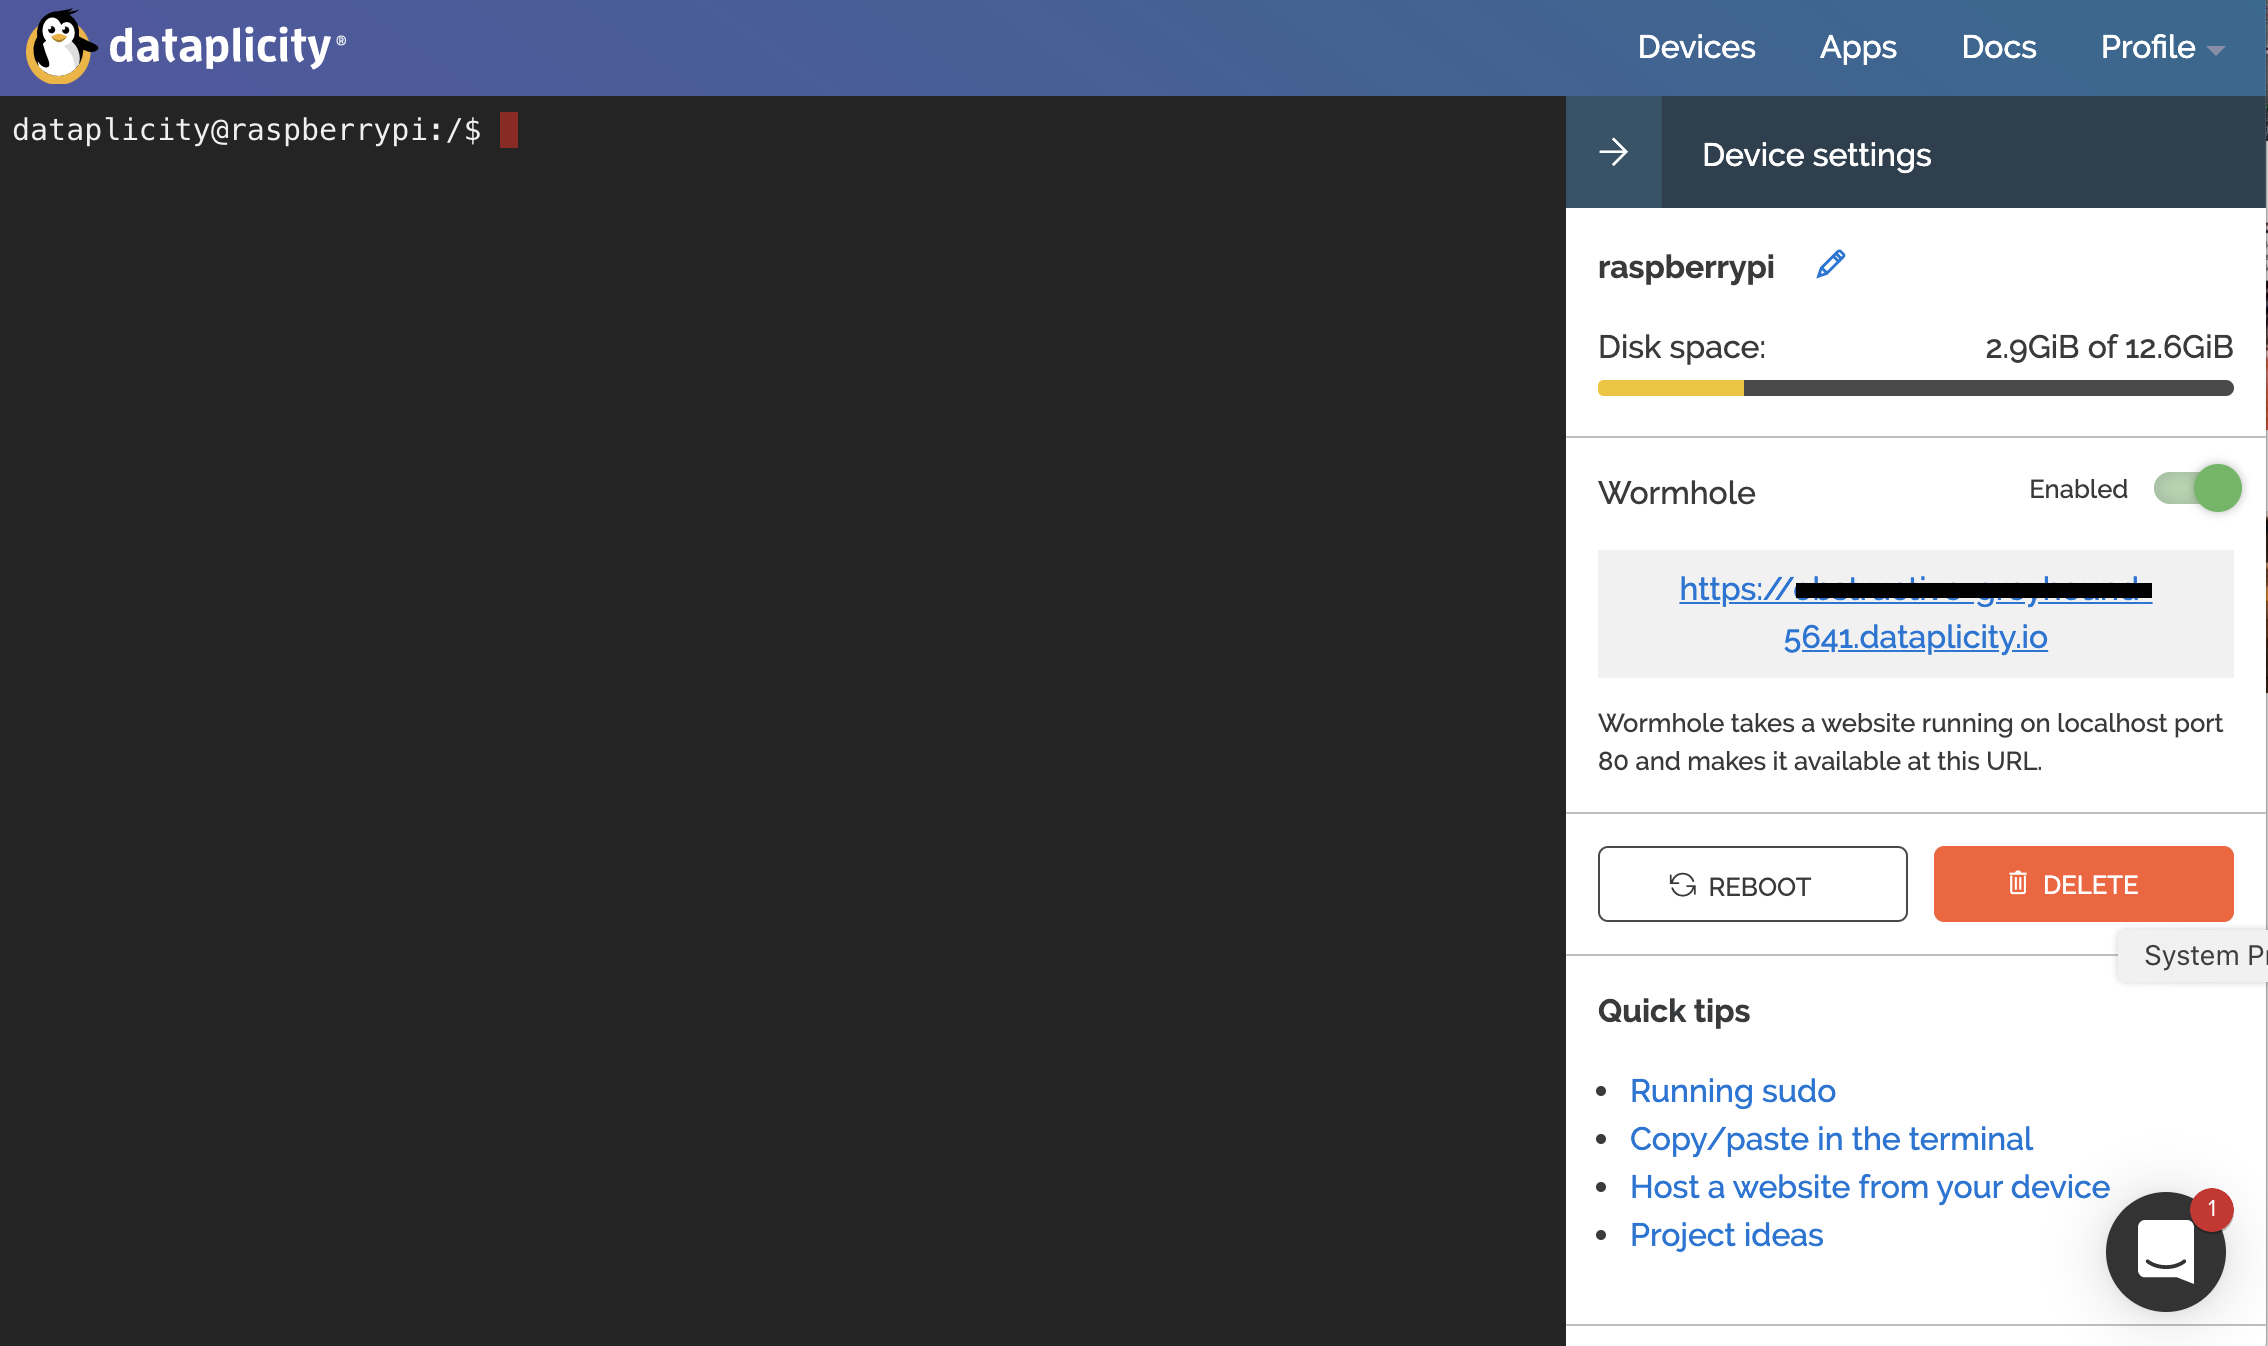
Back on your PC, the new device should now appear on the Dataplicity website. Click the device and you should see a terminal screen for your RPi.
There are a few things to note here:
- To log in, type "su pi" (for superuser access) and you will be prompted for the password (as set earlier)
- You need to enable Wormhole (to be used later)
- You will need the Wormhole address for displaying the data later (right-click to copy when needed)
You can use this remote access for all the following steps and is much easier for copying data, programs etc than directly on the RPi.
Check the Sensors
You can now use Dataplicity remotely access to RPI for all the next sections.
If all is now connected okay, you should be able to see the temperatures being returned from the DS18B20’s. I did work through the Pi Hut tutorial but most of this was not required. If you want the full details they can be found here: https://thepihut.com/blogs/raspberry-pi-tutorials...
The important bits are to go to the devices directory & make sure 2 different sensors are shown.
cd /sys/bus/w1/devices/
This should show 2 devices starting with 28- and the bus master. Mine shows:
28-011453ebfdaa 28-0114543d5daa w1_bus_master1
These 2 ID numbers are important and will be needed later! Then change to one of the sensor directories:
cd 28-011453ebfdaa
(for example) and then to read the value from the sensor
cat w1_slave
There should be 2 lines of text shown:
53 01 4b 46 7f ff 0c 10 2d : crc=2d YES
53 01 4b 46 7f ff 0c 10 2d t=21187
The YES shows the sensor is reading correctly and the 21187 shows temperature in Celsius of 21.187 (divide by 1000) Repeat this to check the second sensor. If both read ok then we can move on to reading the data with Python3.
I copied and adapted the following code that I found on the Web but I can not remember where from. If this looks like your code, then I apologise as no plagiarism was intended; please let me know & I will acknowledge your work.
Create a directory called projects and change to that directory.
mkdir ~/projects
cd ~/projects
In this directory, use the text editor (nano) to create and edit a file called thermo-test.py
sudo nano thermo-test.py
This should have opened the editor and as you are using Dataplicity, you can simply copy the following code below (thermo-test.py) and paste into the editor. You will need to alter the 2 device names (starting 28-…) to the ones noted above. When all looks correct, press ctrl+X to finish, Y to save & return to use the existing name. If you prefer to use the GUI then Thonny will do the same.
To run the test program:
sudo python3 thermo-test.py
All being well, this should execute the file using python 3 and print to the screen the 2 temperatures every 10 secs. You can test all is ok by placing 1 sensor into iced water or gently warming with a hairdryer. If all seems okay, then we can move on!
Downloads
UFW Firewall
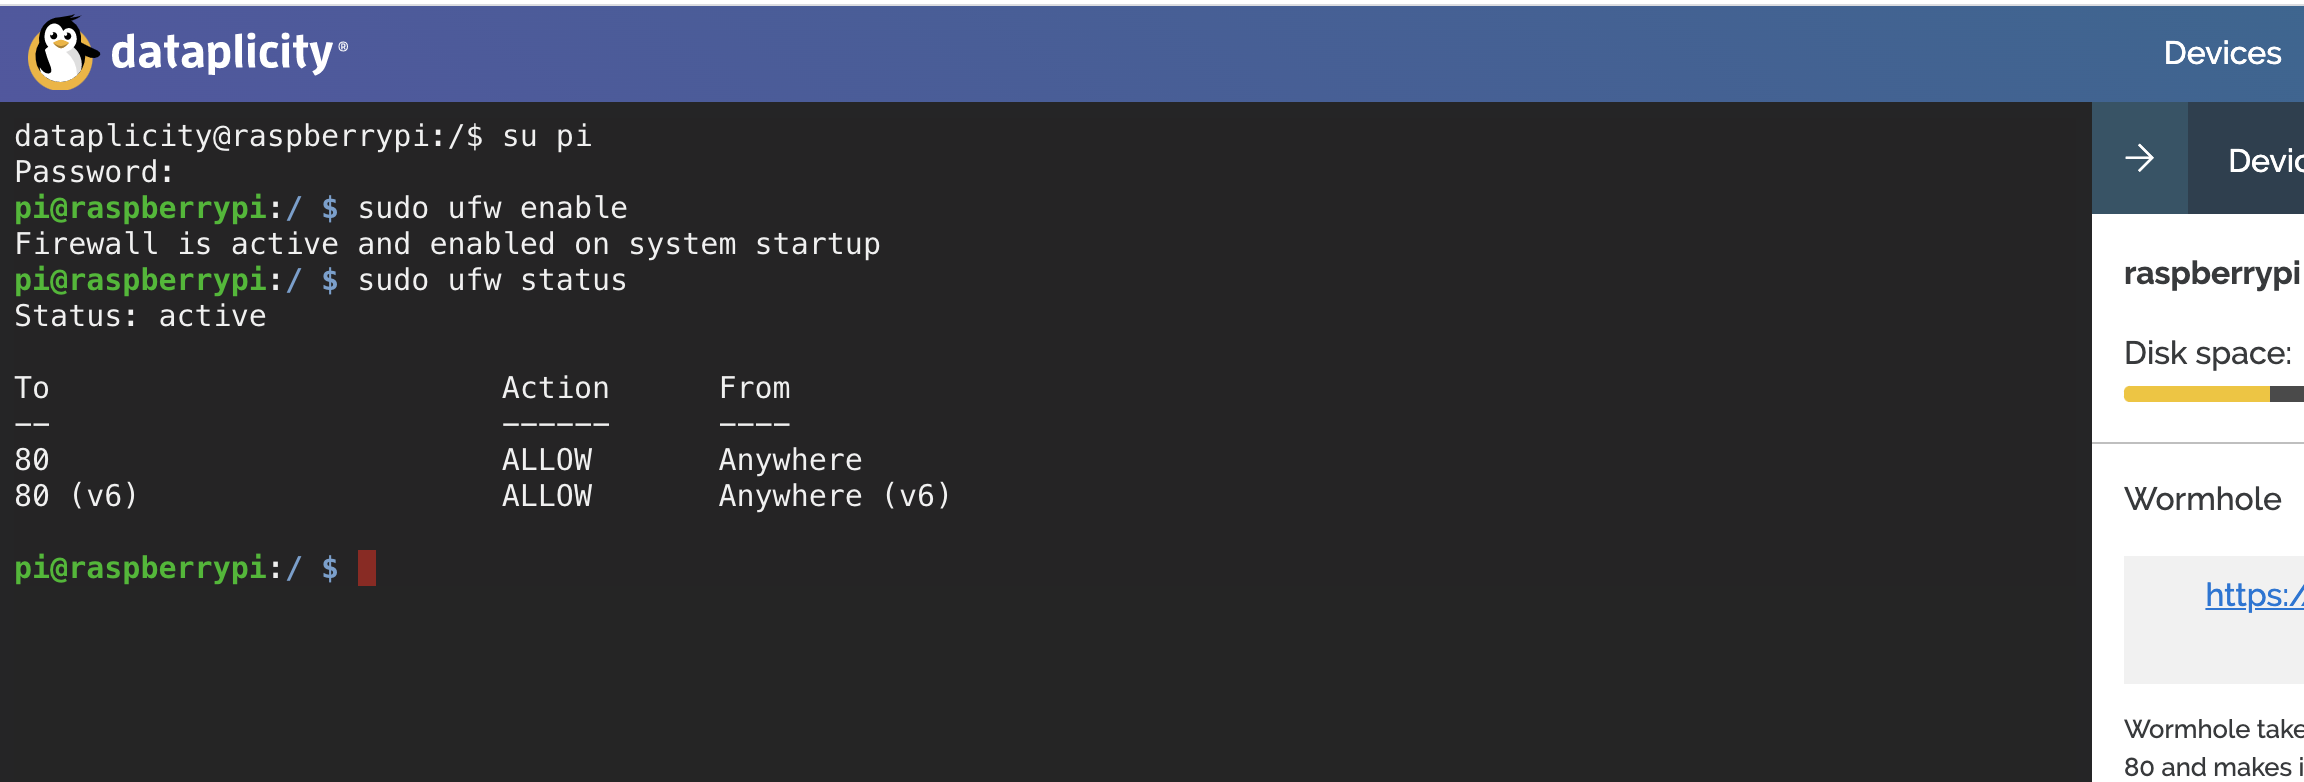
As this RPi was going to be permanently connected to the internet I decided a Firewall would be a good idea and a simple one to use is Uncomplicated Firewall (ufw). There is a very simple tutorial here https://www.linode.com/docs/security/firewalls/co...
I’m not going into great depth as this is not the purpose of this Instructable, but in short:
Install the firewall with:
sudo apt-get install ufw
Set the default rules:
sudo ufw default allow outgoing
sudo ufw default deny incoming
Open port 80 for Dataplicity
sudo ufw allow 80
Enable the firewall
sudo ufw enable
Check the status and make sure all is running
sudo ufw status
Sending the Temperature Data As JSON
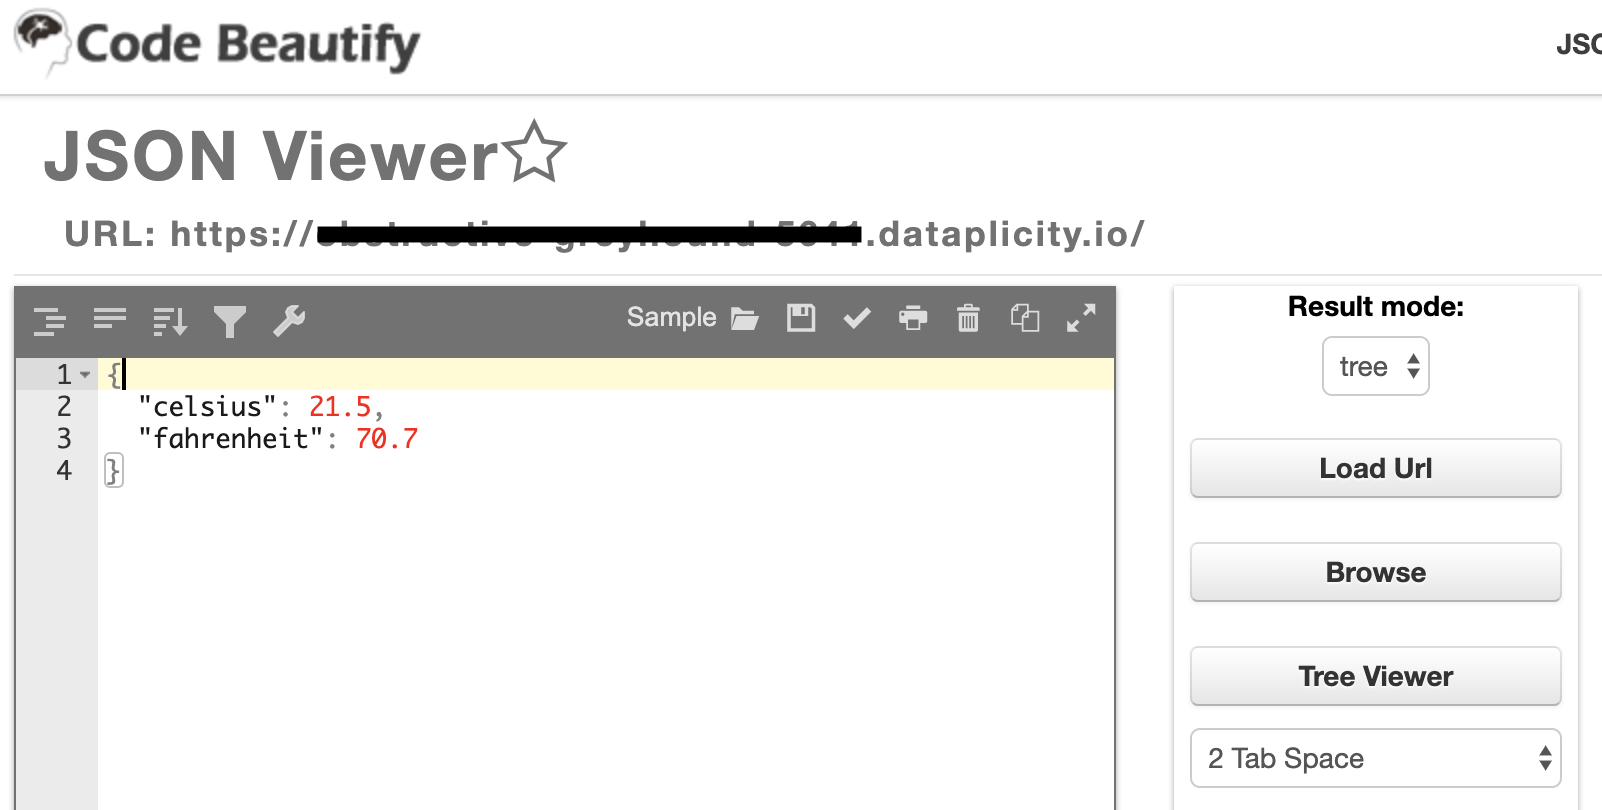
Back to Tim Fernando’s blog and section 5.
Follow the steps as stated (except we have already created the projects directory) and all should work fine. Using GIT you will download Tim’s application files & the PIP will make sure all the required programs are installed onto your RPi. I then found I needed to re-boot to make sure the packages were all setup correctly.
Then run Tim’s program and your RPi should then be providing JSON data for the first sensor.
cd home/pi/projects/ temperature-serve-pi
sudo gunicorn temperature:app -b 0.0.0.0:80
You can carry on through the blog to section 6 where you’ll find data is being provided for 1 of the sensors.
You can also use JSON Viewer to see the data https://codebeautify.org/jsonviewer Click the button “load URL” and paste in the Wormhole address noted earlier. In the left pane, you should see two entries, one for Celsius & one for Fahrenheit.
Send Data From Both Sensors
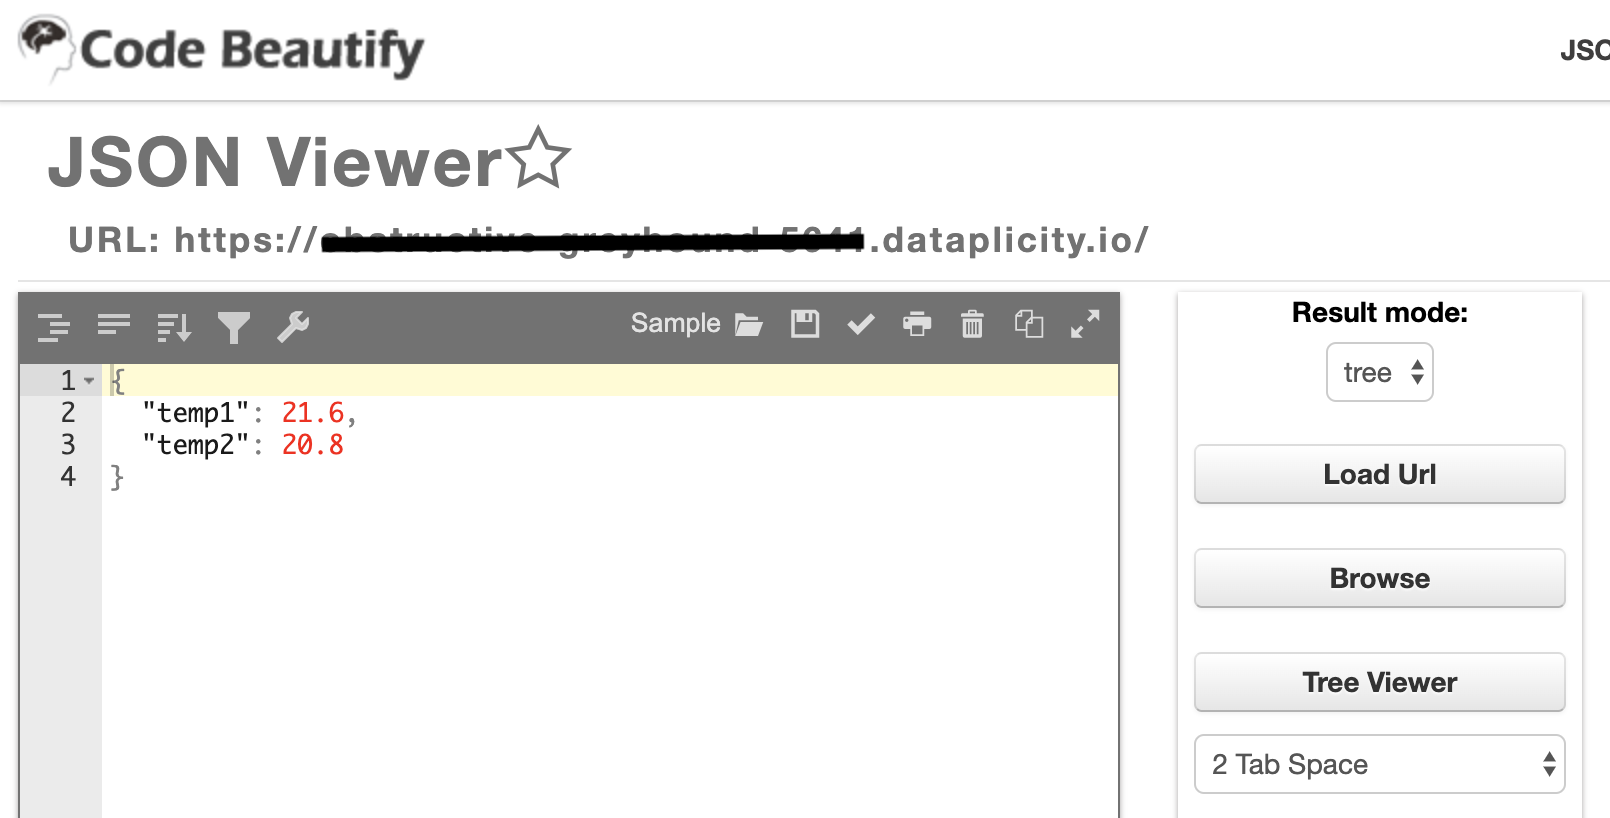
Based on the code in temperatures.py and thermo-test.py, I created 2temps.py Edited as before in the /projects/temperature-serve-pi directory, pasted in the code and saved. I then ran
sudo gunicorn 2temps:app -b 0.0.0.0:80
Now when I re-ran JSON Viewer I got values for temp1 & temp2
Success :)
Downloads
Auto Start
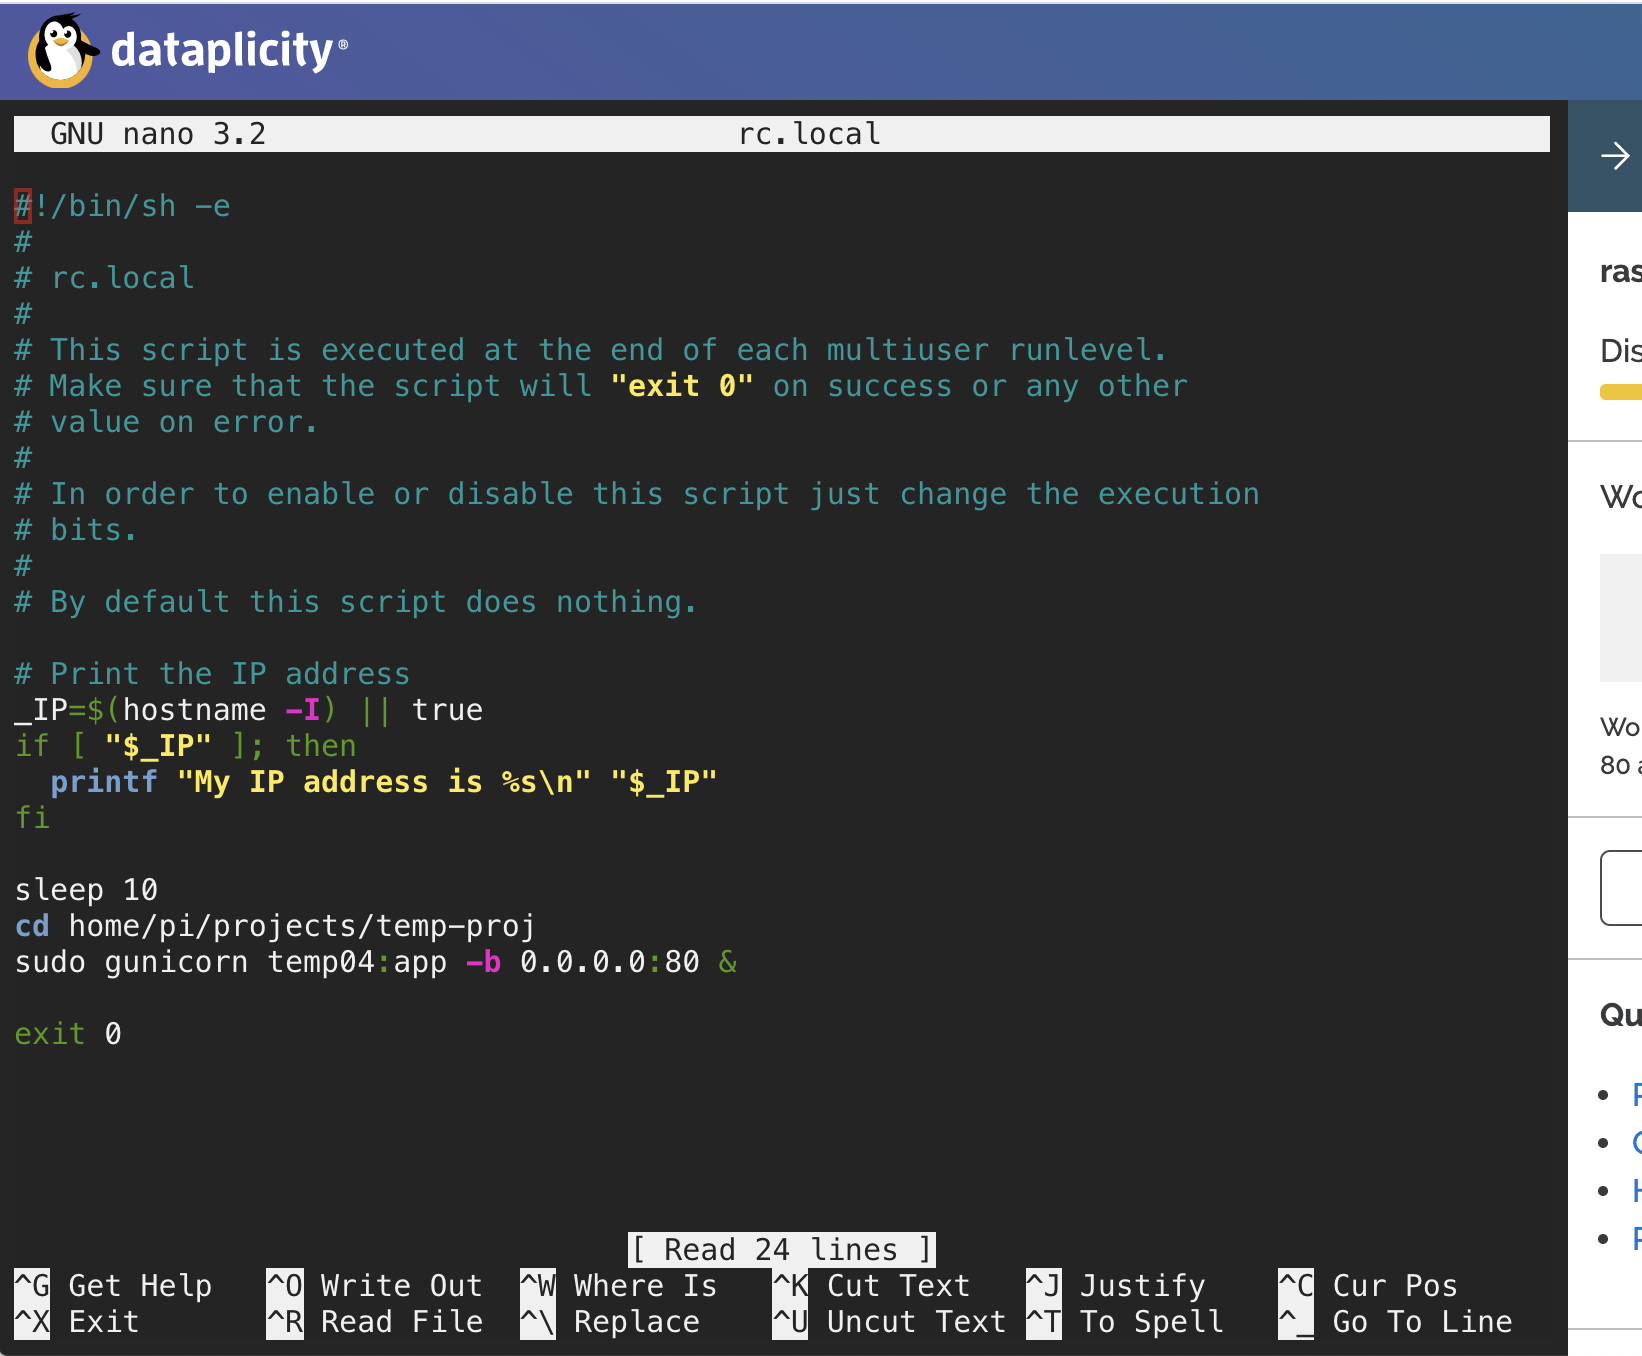
As the power to the greenhouse does get shut off occasionally, I wanted the RPi to automatically load the program and start proving the data. The simplest way seems to be to edit the rc.local file and add the required code at the bottom just above the exit 0 line.
cd etc
sudo nan rc.local
then add-in
sleep 10
cd home/pi/projects/temperature-serve-pi
sudo gunicorn temp04:app -b 0.0.0.0:80 &
- The & at the end tells the computer to run the script in a sub shell so that your computer does not wait for the function to end and will continue with boot
- Sleep 10 [seconds] makes sure all the previous operations are completed before starting the service.
Exit and save as before. Then reboot and re-run JSON Viewer to check all is fine.
If you want more information on auto-running programs there is a great tutorial here https://learn.sparkfun.com/tutorials/how-to-run-a...
Display the Data on Freeboard.io (1)
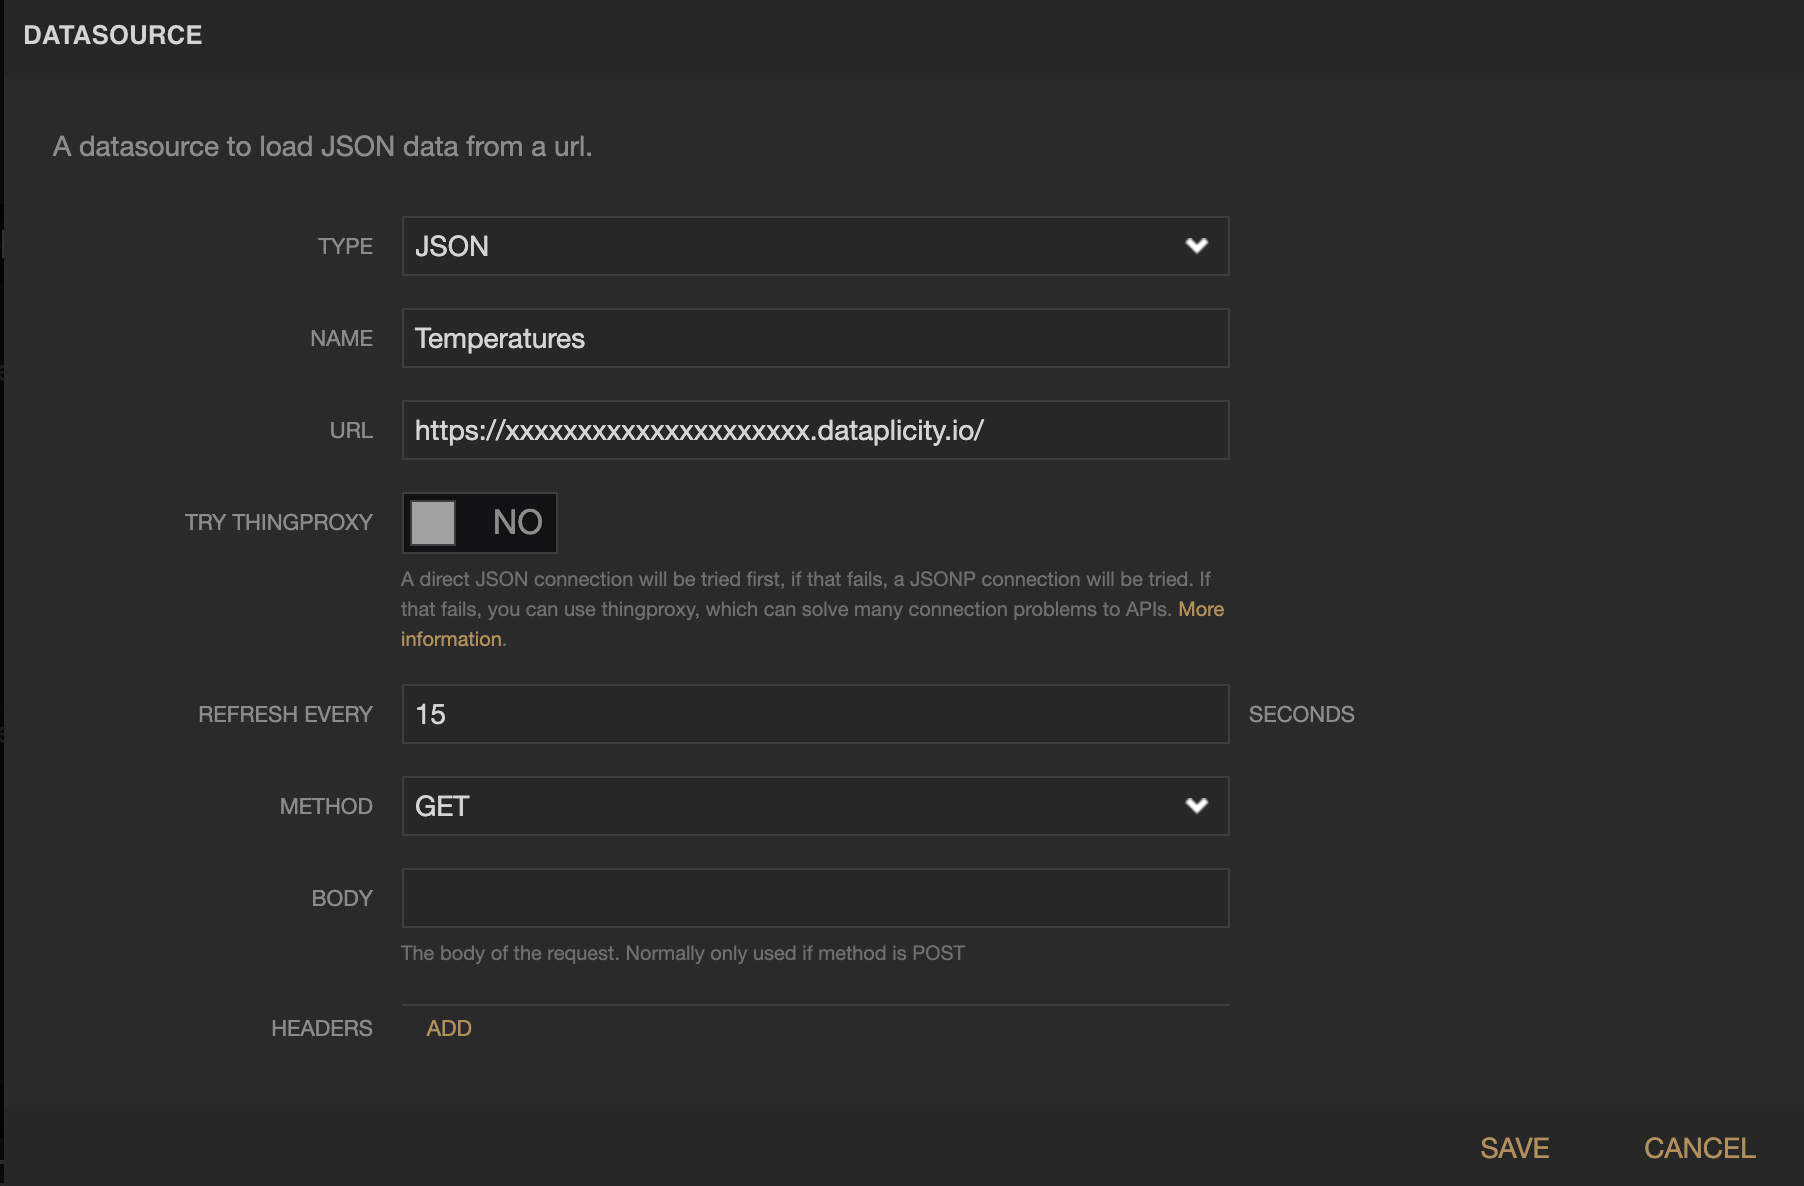
The steps in Tim’s blog work fine, in summary; create an account at www.freeboard.io and then create a new Freeboard, I called mine SHEDTEMPERATURES.
First, add a datasource, click ADD at the top right and from the pop-up select JSON as the type, give the datasource a NAME, add the wormhole address from earlier as the URL and click NO for TRY THINGPROXY. Temperatures only change very slowly and so REFRESH EVERY 15 SECONDS is fine. Click SAVE.
Display the Data on Freeboard.io (2)
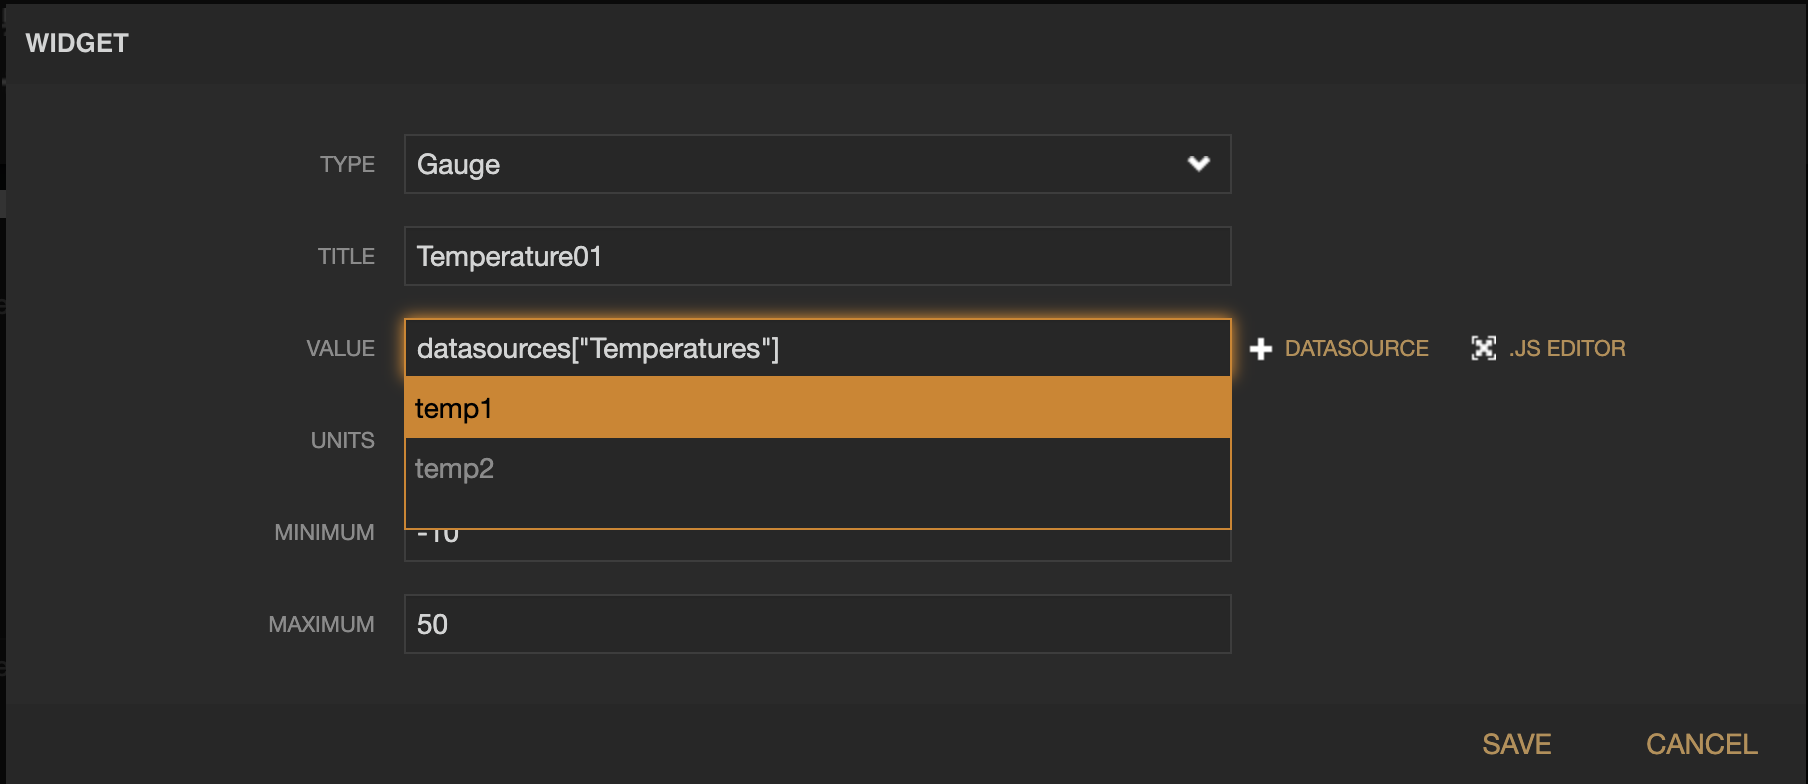
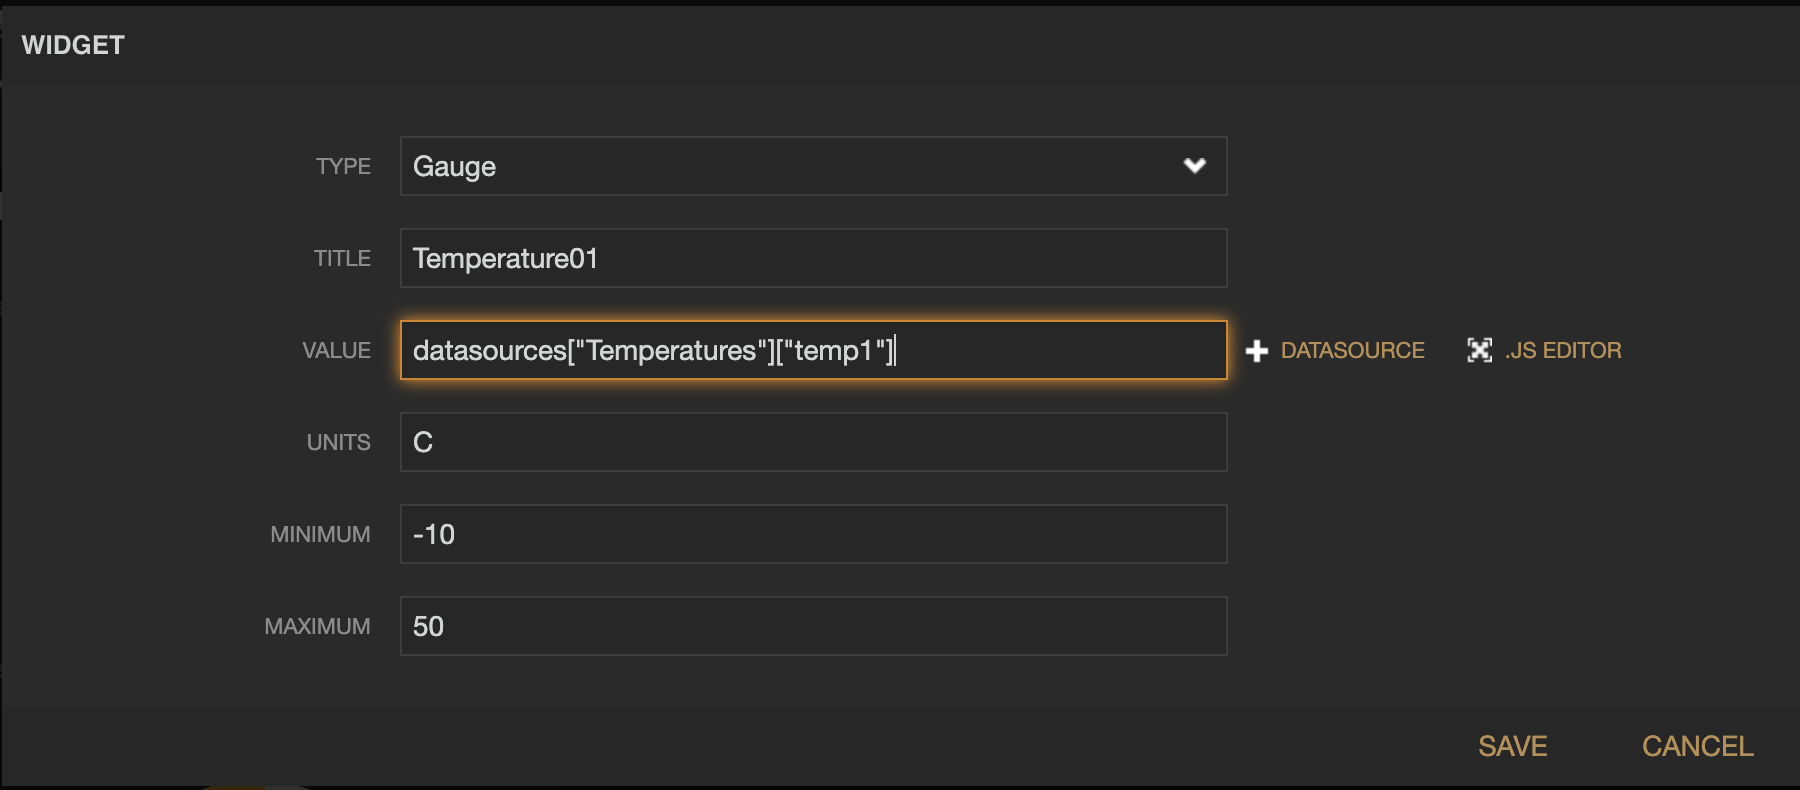
Click ADD PANE and then the + to add the first widget. You can select and play with various of the TYPEs but I found Gauge was just fine. Give a suitable TITLE, UNITS (C), MINIMUM and MAXIMUM to suit your application. For the DATASOURCE, click the + and the source created above will appear.
The dropdown should now show the 2 JSON data sources (temp2 & temp2) built earlier. Select the appropriate source and click save.
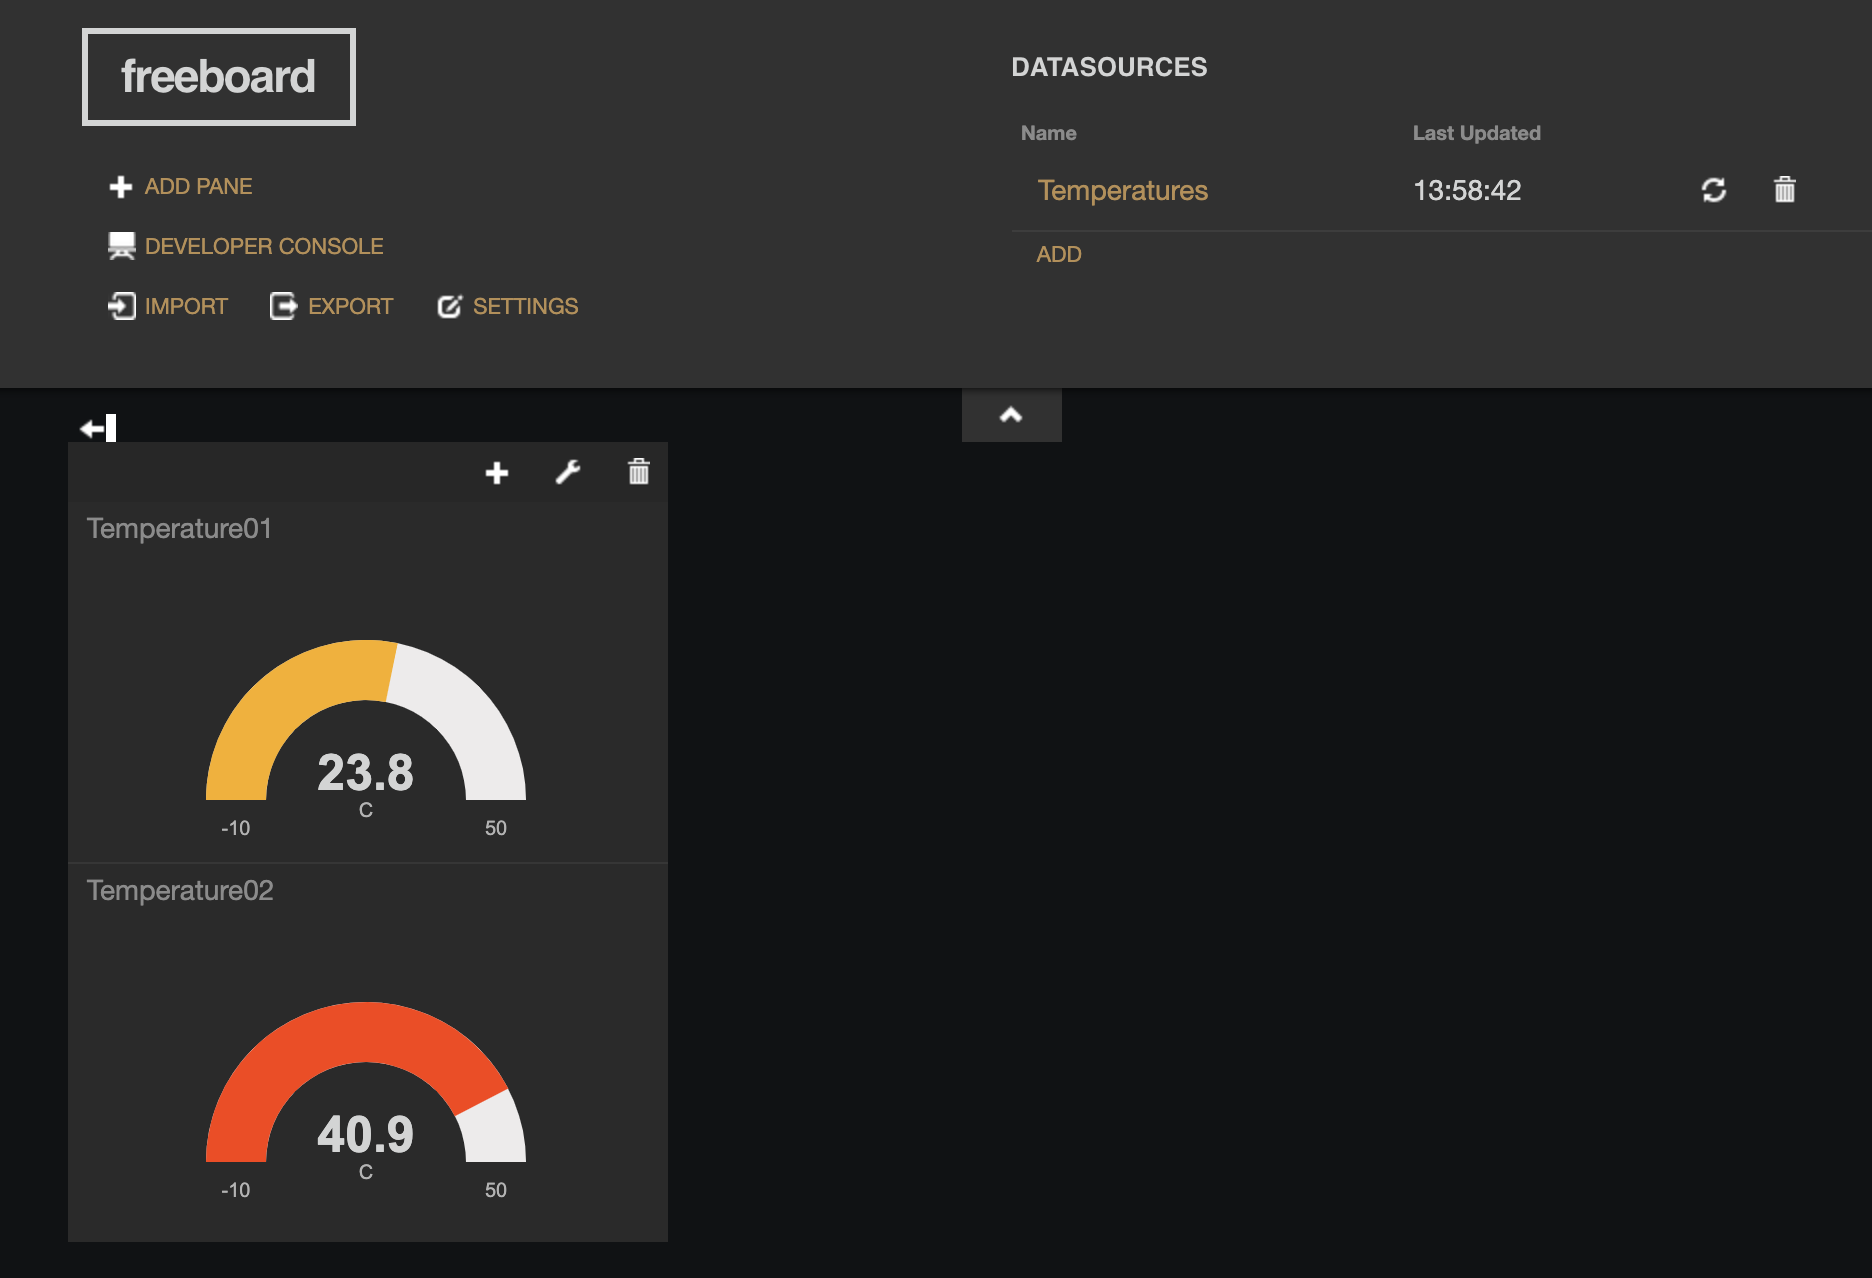
Repeat this for the second gauge and we’re all set.
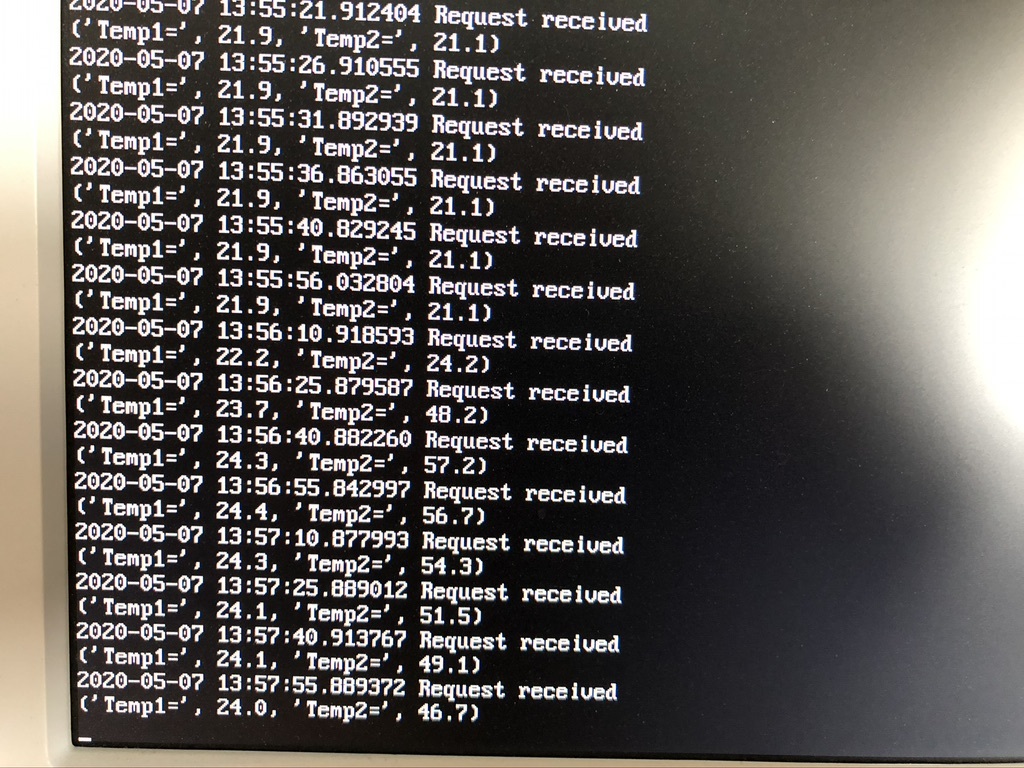
The data should now be displayed on the 2 gauges and if you still have the PRi connected to a monitor, you should see the requests from Freeboard.io as they arrive.
Build the Project Into a Box
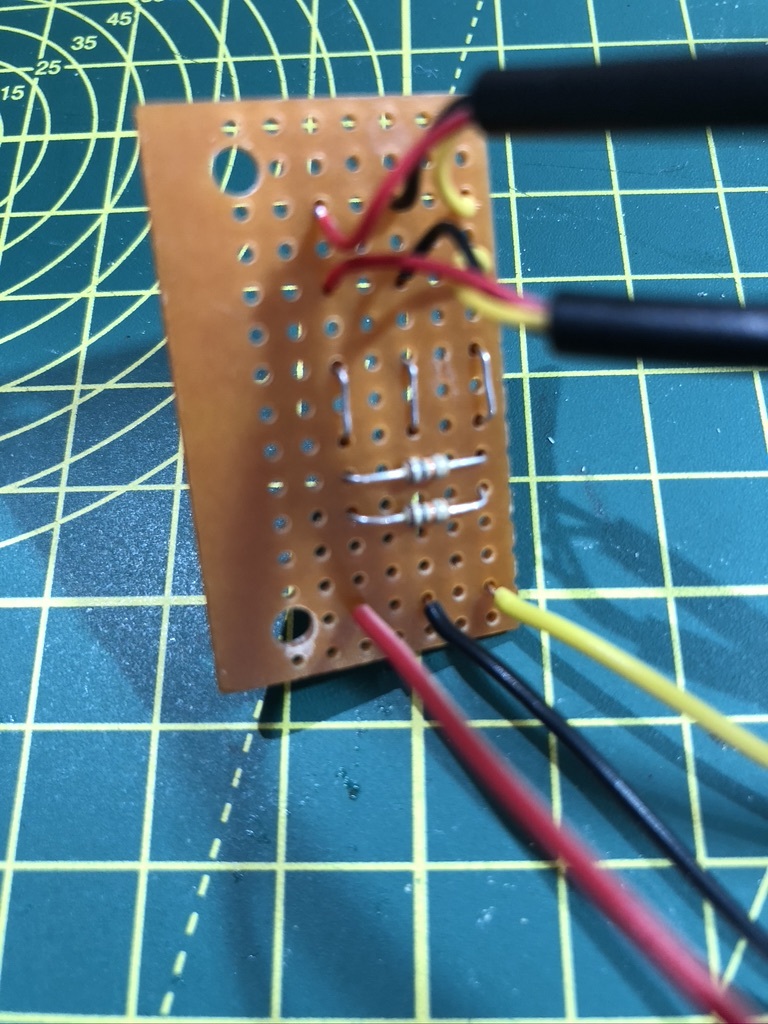
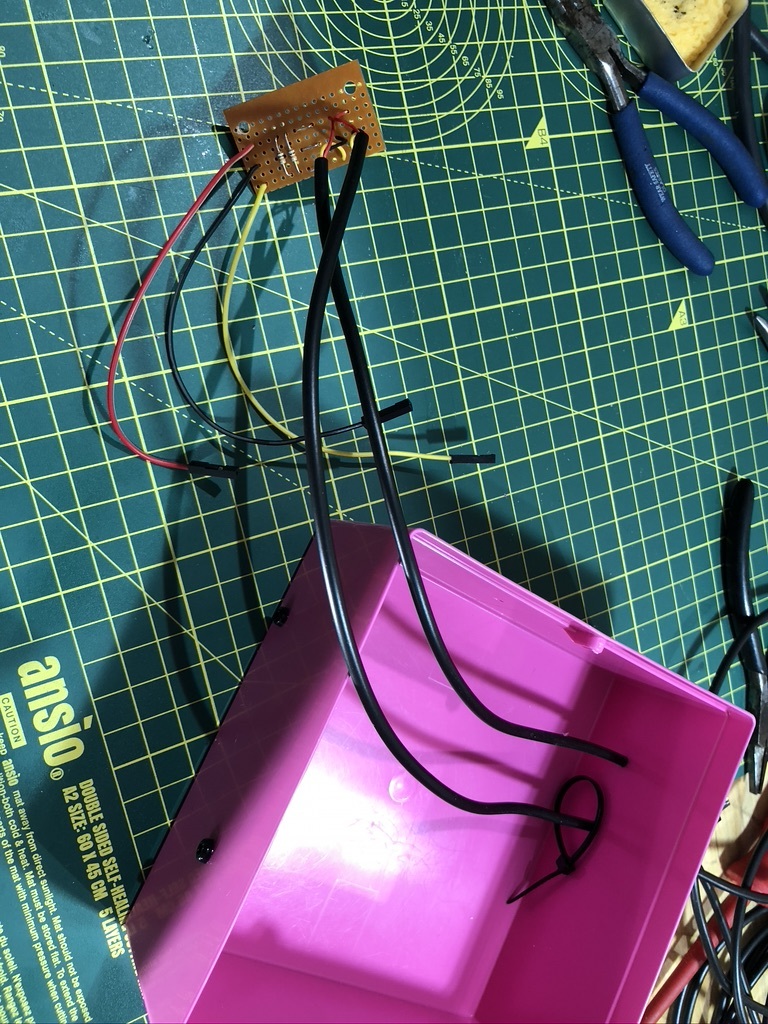
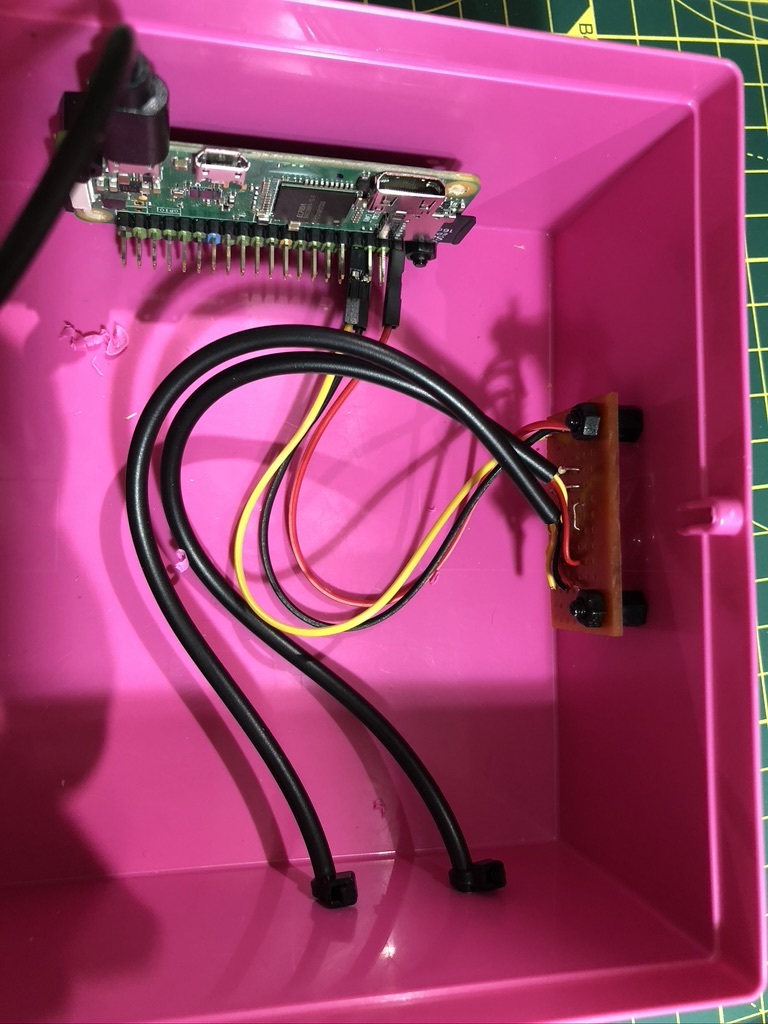
Up until this point, the RPi and the other components had all been assembled on the bench using a breadboard. A small piece of stripboard was then used to replace the breadboard and the leads all soldered into place.
A bright pink small Lego storage box was found that had plenty of space and where the RPI would not get too hot. holes were drilled into the sides of the box & 3mm nylon mounting pillars were used to hold the RPi and stripboard into place.
There are only 3 connections required from the GPIO, 3.3v, GND & data.
- 3.3vdc pin 1
- GND pin 6
- Data (GPIO4) pin 7
Holes were also added in the box for USB power and cables to the temperature sensors. Once everything was mounted into place, a small amount to silicone sealant was added to ensure spiders didn't think it was a nice warm place to spend the winter!
Finished
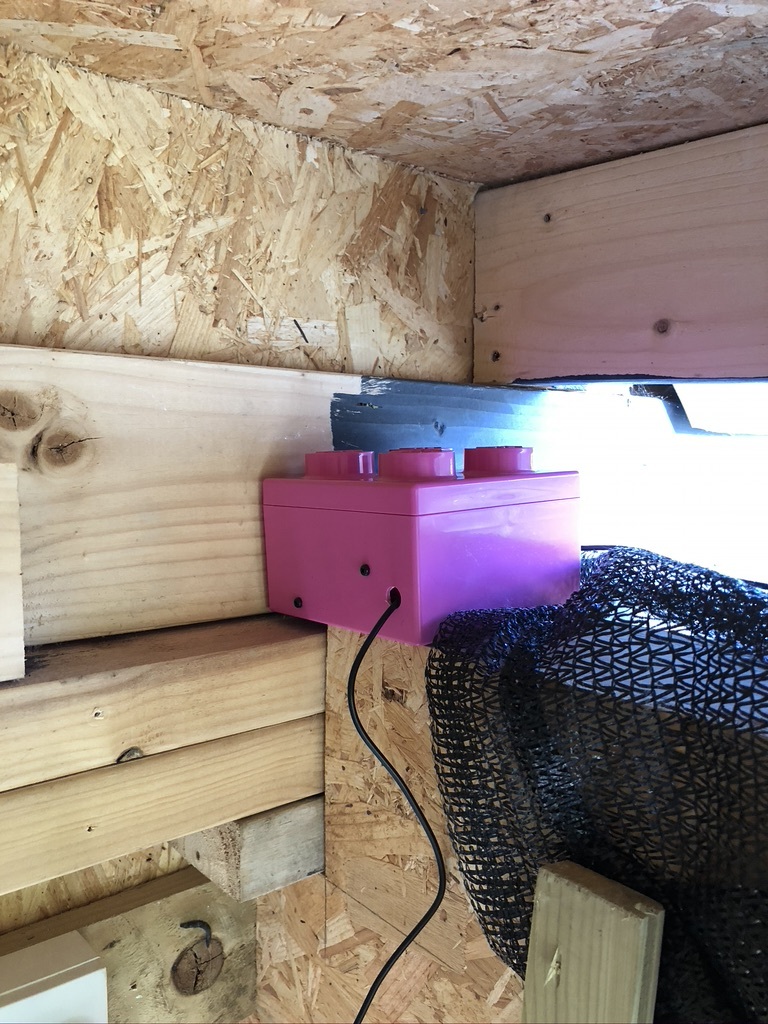
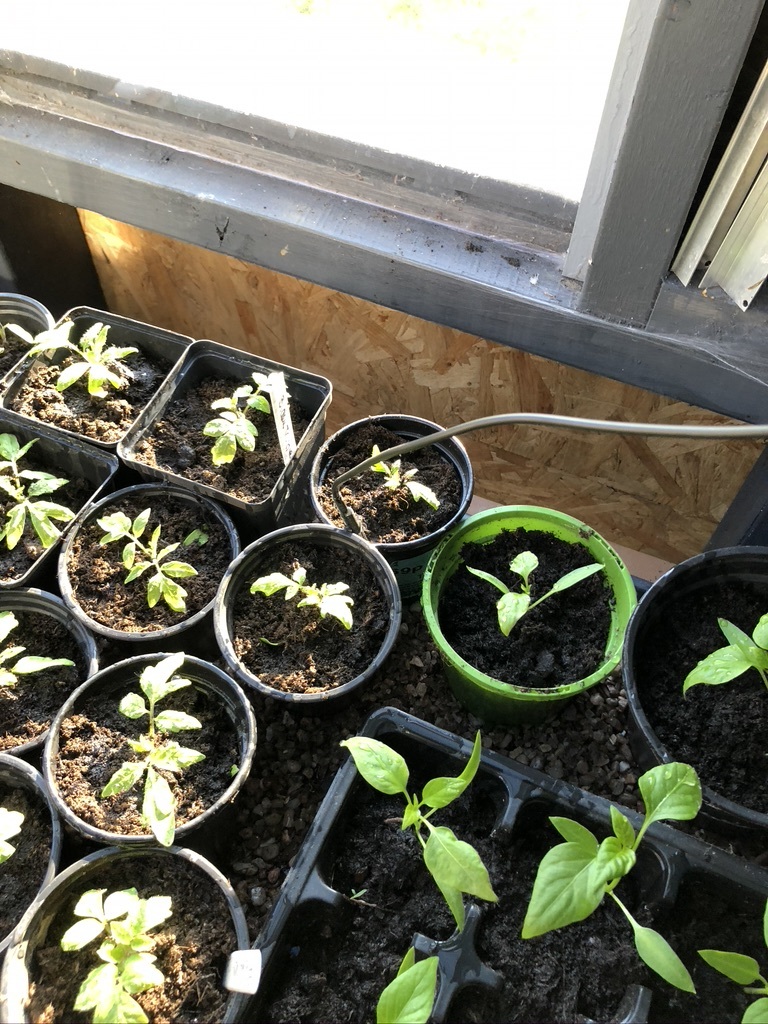
The box was placed into the greenhouse and powered from a USB charger. The two sensors were placed one near the top of the greenhouse and the other onto a plant pot to check how cold the seedlings were getting at night.
This is my first Instructable and I hope you think it is okay. If you find any errors please let me know & I will amend where required. The next step might be to log the data every (say) 60 secs, but this will come later.