Intel Edison Spectrophotometer
by CristianP3 in Workshop > Science
3654 Views, 20 Favorites, 0 Comments
Intel Edison Spectrophotometer

This instructable will explain how to build a fairly basic.
Of course, this device is nothing compared to a commercial spectrophotometer, but it will allow the builder to understand how such a device works to using it for DIYbio.
Know-how
The spectrophotometry is the quantitative measurement of the reflection or transmission properties of a material as a function of wavelength. A spectrophotometer is commonly used for the measurement of transmittance or reflectance of solutions, transparent or opaque solids, such as polished glass, or gases.
The basic principle is easy: a beam of light passes through a prism or diffraction grating; out of the resulting spectrum, a range of wavelengths gets selected by sending the light through a slit. The light passes through the sample and hits a detector.
The most common spectrophotometers are used in the UV and visible regions of the spectrum, and some of these instruments also operate into the near-infraredregion as well. Visible region 400–700 nm spectrophotometry is used extensively in colorimetry science.
So, let's do it!
This device is certainly not to be compared to a commercial system, but if you are a DIYbio fun it will certainly be interesting!
Step 1: Materials
For this bit you're going to need the following.
(I am using modules from the grove kit from seeedstudio)
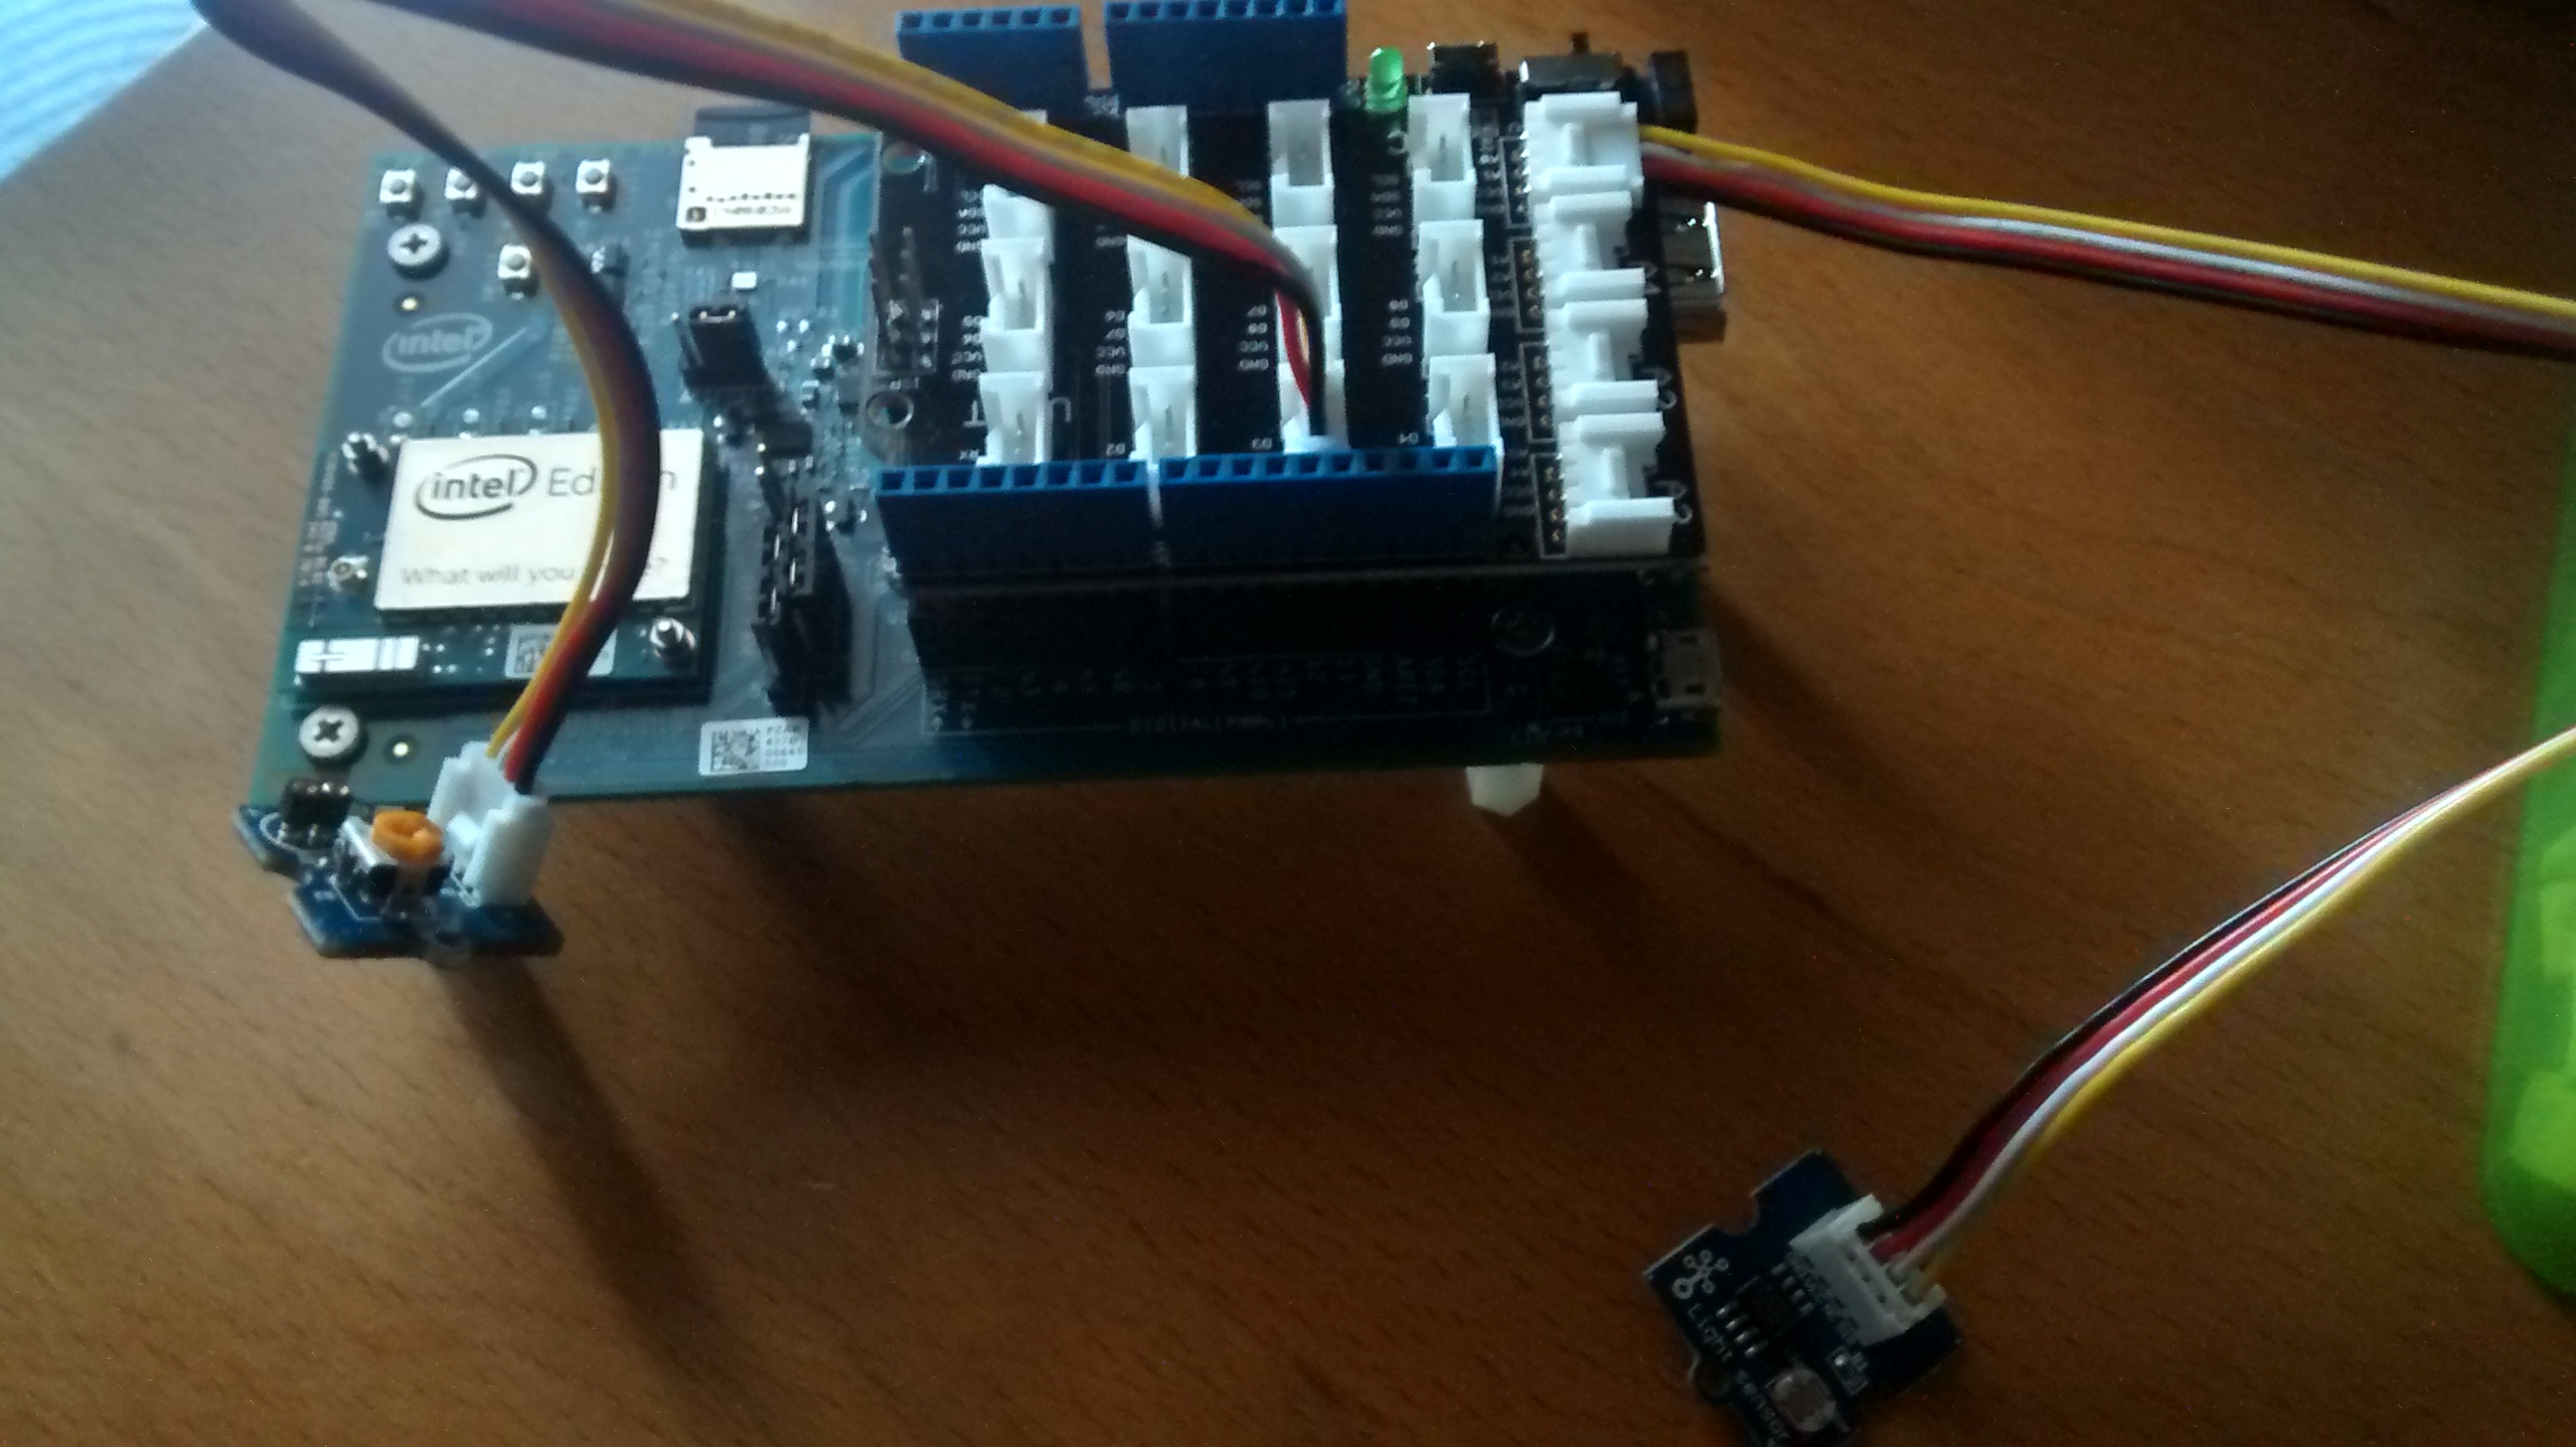
- 1 x Intel Edison;
- 1 xGrove Base Shield;
- 1 x LED driver board;
- 1 x LED of your choice (I used a color led);
- 1 x Light Sensor;
- 2 x Grove Cable
Step 2: Connecting It All Together!
![IMG_20150123_152825679[1].jpg](/proxy/?url=https://content.instructables.com/FKA/U2LM/I59HHUVR/FKAU2LMI59HHUVR.jpg&filename=IMG_20150123_152825679[1].jpg)
![IMG_20150123_152755810_HDR[1].jpg](/proxy/?url=https://content.instructables.com/FER/TPPA/I59HHURR/FERTPPAI59HHURR.jpg&filename=IMG_20150123_152755810_HDR[1].jpg)

Before we get stuck in I am assuming you have your Edison board set up as in Intel guide; if not you can view it here.
Before connecting it all up, I suggest you disconnect the power from the board, it helps prevent any short circuits and other issues.
Firstly, you must connect the Grove Base Shield on Intel Edison Board.
Then, the light sensor needs to connect to port A0 on the expansion board.
The Led Socket needs to connect to D3 on the expansion board with a LED.
Done, it's all!
Step 3: Writing the Code
Launch up the Arduino IDE and make a new project, and we can get coding!
I'll talk through my code below (anything with a "//" before, it is a comment).
So, this is the start of the code: sets the variables that the main loop requires; ss you can see in the comments, it is telling it that the light sensor is on A0 and the Led socket is attached to D3; set Vout (Volt out) on 0.0V and Vin (Volt in) on 3.0V.
Then we run the setup section: it sets the pins A0 as an INPUT and D3 as an OUTPUT; set serial too.
Now for the main loop of code: set the led as HIGH, read the value of light sensor and convert it in Volt. The conversion in Volt is to have values to use in Lambert-Beer law:
A = log (I0 / I)
where "I0" is the intensity of the light falling into the cuvette (i.e. the blank) and "I" is the light passing through the sample. So, between led and sensor you must put a cuvette with "blank" (i.e. water), firstly, and sample than.
const int pinLight = A0;          //Set Light Sensor on A0
const int pinLed = 3;             //Set Led Socket on D3
float Vout = 0.0;                //Volt out
float Vin = 3.0;                 //Volt of Intel = 3Vvoid setup()
{
    Serial.begin(9600);
    pinMode(pinLight, INPUT);    //set the Sensor on Analog 0 as an INPUT
    pinMode(pinLed, OUTPUT);       //set the LED on Digital 3 as an OUTPUT
}void loop()
{
    digitalWrite(pinLed, HIGH);                 //set the LED as HIGH
    int sensorValue = analogRead(pinLight);    //read value of Sensor Light
    Vout = (Vin/1024.0 * sensorValue);         //convert sensorValue in Volt

    Serial.print("sensor = " );
    Serial.println(Vout);

    delay(1000);
}
Step 4: Test and Conclusions

In this video, I show you how sensor responds to two different leds (red and green). In serial monitor you can see the sensor value in Volt:
- ~1.42 for red led;
- ~1.23 for green led;
- ~0.90 if I obscure the sensor.
A good thing is change the colored led with a white led because it creates all wavelength which can be selected with a slit and a wavelength divisor (i.e. CD-Rom). But in my opinion if you want a specific wavelength, use a colored led is good because we can know the exact value in nm.
Future upgrades will be an LCD that shows the average value of all sensor values and the implementation of Lambert-Beer law (and blank value) into code.
Cheers!