Image Decoder Gadget

Do you know how to encode images and decode images based on the encoding? If not, come and take a look now!
Supplies
Material List
Future Board*1
Robotbit Edu*1
Sugar Line Follower Module*1
3-pin cable *2
LEGO bricks
Cardboards
Printed papers
Technical Principle1

The Sugar Line Follower Module will return a low level when it receives reflected light, and a high level when it does not. Therefore, on a white surface, it will detect reflected light and return a low level; on a black surface, it will return a high level since there is no reflection.
Based on this conclusion, we can read the "data barcode". If the Sugar Line Follower Module does not scan the black square, it will return a low level, which we call "0, " and a high level will be returned for "1".
On a long piece of paper, black squares are marked at predetermined positions as shown in the black-and-white squares in the figure, with a total of eight. By uniformly scanning the entire "data barcode" within five seconds, and obtaining the values in corresponding time intervals (every 0.625 seconds), we can obtain the barcode data (10010010).
Technical Principle2

The above method is theoretically feasible, but in practical operations, it is difficult for humans to drag the "barcode data" at a uniform speed, so we have optimized the solution. We find a paper strip with the same length as the "data barcode", paint it with a black-and-white alternating pattern, and then prepare a Sugar Line Follower Modul.
So currently there are two Sugar Line Follower Modules and two "barcodes": the black-and-white intersecting "barcode", which we will call the "timeline code" later; and the "custom data barcode" for user-defined data, which we still call the "data barcode".
Next, two line Sugar Line Follower Modules simultaneously begin "code scanning". Unlike the previous method, in this program, the "data barcode" will only be recorded when the "timeline code" data changes. This way, the speed of scanning does not need to be considered.
Technical Principle3

Assuming that I need to display a smiley face on a 5*5 grid, it can be converted into a matrix where the lit areas are represented by 1 and the unlit areas are represented by 0. Then, in order, from left to right and top to bottom, it can be converted into a string consisting of 0 and 1. Finally, it can be converted into black and white squares on a "data barcode".
Barcode Production


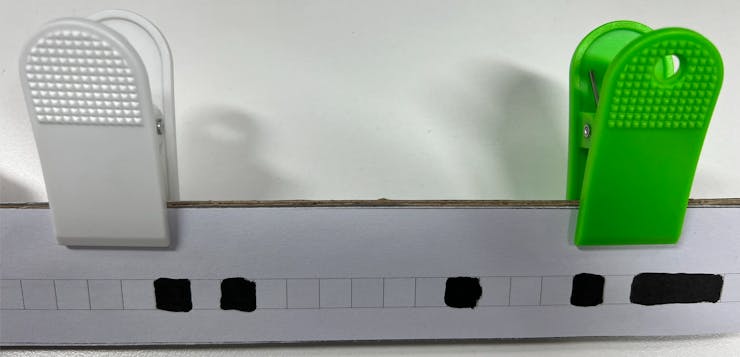
Cut a piece of cardboard measuring 22cm*4cm in size to be used for fixing the "timeline code" and "data barcode". Next, print out the "timeline code" and "data barcode". Since the "timeline code" will not change, it can be directly glued onto the cardboard with 3m tape. The "data barcode" can be fixed onto the cardboard using a clip.

Module Fixation

Considering the convenience of use, fixed sensors and dragging barcodes are adopted here to complete the code reading. Place the two modules in a relative way and ensure that the spacing is sufficient to accommodate the cardboard with fixed barcodes.
Connect Furture Board


Connect two modules to Robotbit Edu. Since the scanning convention is from top to bottom and the starting point of the "data barcode" is on the left side, the left side of the barcode is the "timeline code" and the right side is the "data barcode". Correspondingly, the left line-tracking module is used to control the rhythm, and the right line-tracking module is responsible for recording the "data barcode".
Decorate

Just decorate it a little bit to make the work look better.
Program Coding

Talking about this program specifically, let's first address drawing a 5x5 grid and then combine it with the data to set the colors of the grid.
from future import *
from sugar import *
screen.sync = 1

heng = 20
shu = 4
screen.fill((0,0,0))

for i in range(5):
  for j in range(5):
    screen.rect(heng,shu,22,22,color,1)
    heng+=24

  heng = 20
  shu+=24
By the above program, we can draw a 5x5 red dot matrix. Next, we will modify the program to set the square color based on the current barcode data.
from future import *
from sugar import *
screen.sync = 1
sda = Tracker('P2')
scl = Tracker('P8')


heng = 20
shu = 4
select = (255,0,0)
noselect = (255,255,255)
x = 0
y = -1

screen.fill((0,0,0))
screen.textCh('Place the barcode',5,10,1,(255, 255, 255))
screen.textCh('press Key A',5,25,1,(255, 255, 255))

while not sensor.btnValue("a"):
  pass

screen.fill((0,0,0))
x = scl.value()
for i in range(5):
  for j in range(5):
    while x==y:
      x = scl.value()
    y = x
    sleep(0.1)
    data = int(sda.value())
    print("write--"+str(data))
    color = noselect
    if data == 1:
      color = select
    screen.rect(heng,shu,22,22,color,1)
    heng+=24
  heng = 20
  shu+=24
The specific implementation approach is: before the "data barcode" changes, the next square will not be drawn, and after the data code changes, the color of the square to be drawn will be set to the corresponding data.