IOS Kernel Debugging
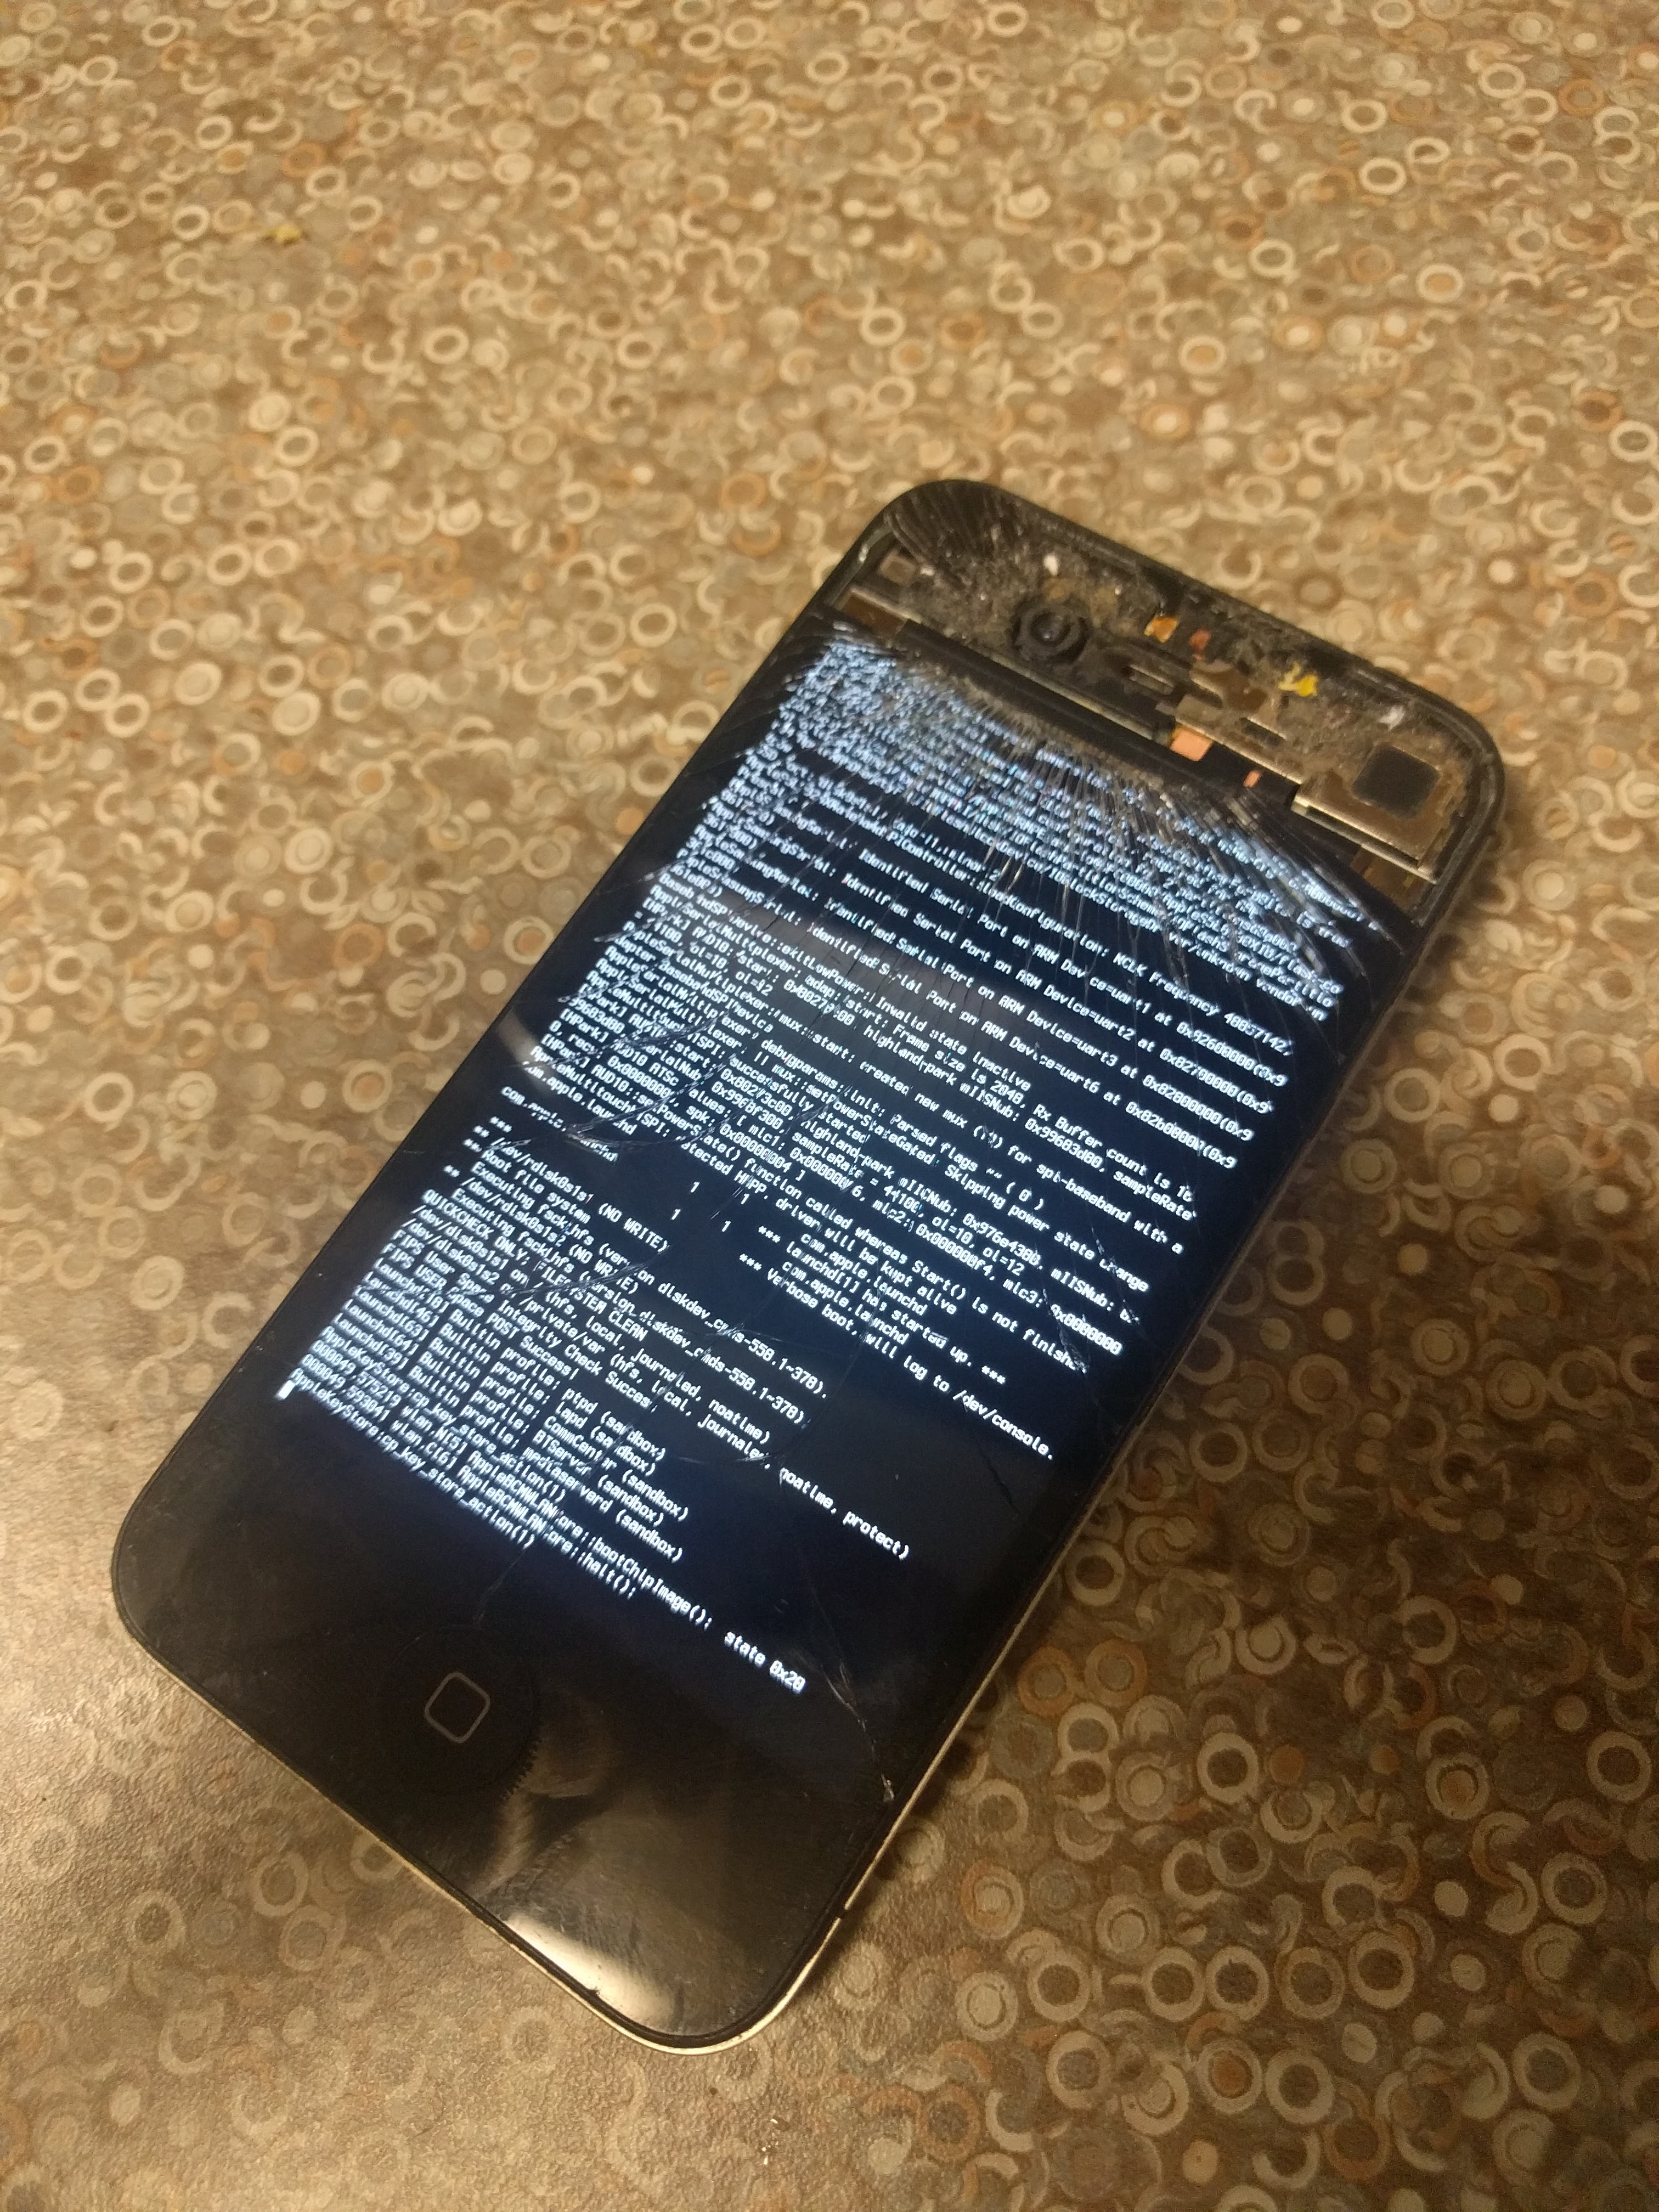
If you are working with the iOS kernel, which is a very complex piece of software, a debugger will come in very handy. It will allow you to step through code, set breakpoints, read and write both memory and registers, and even more. Fortunately, the builtin debugging protocol that Apple engineers themselves use for development is also included in production releases. However it is a bit complex to get it setup and running so I hope this Instructable is very useful.
Step 1: Required Items
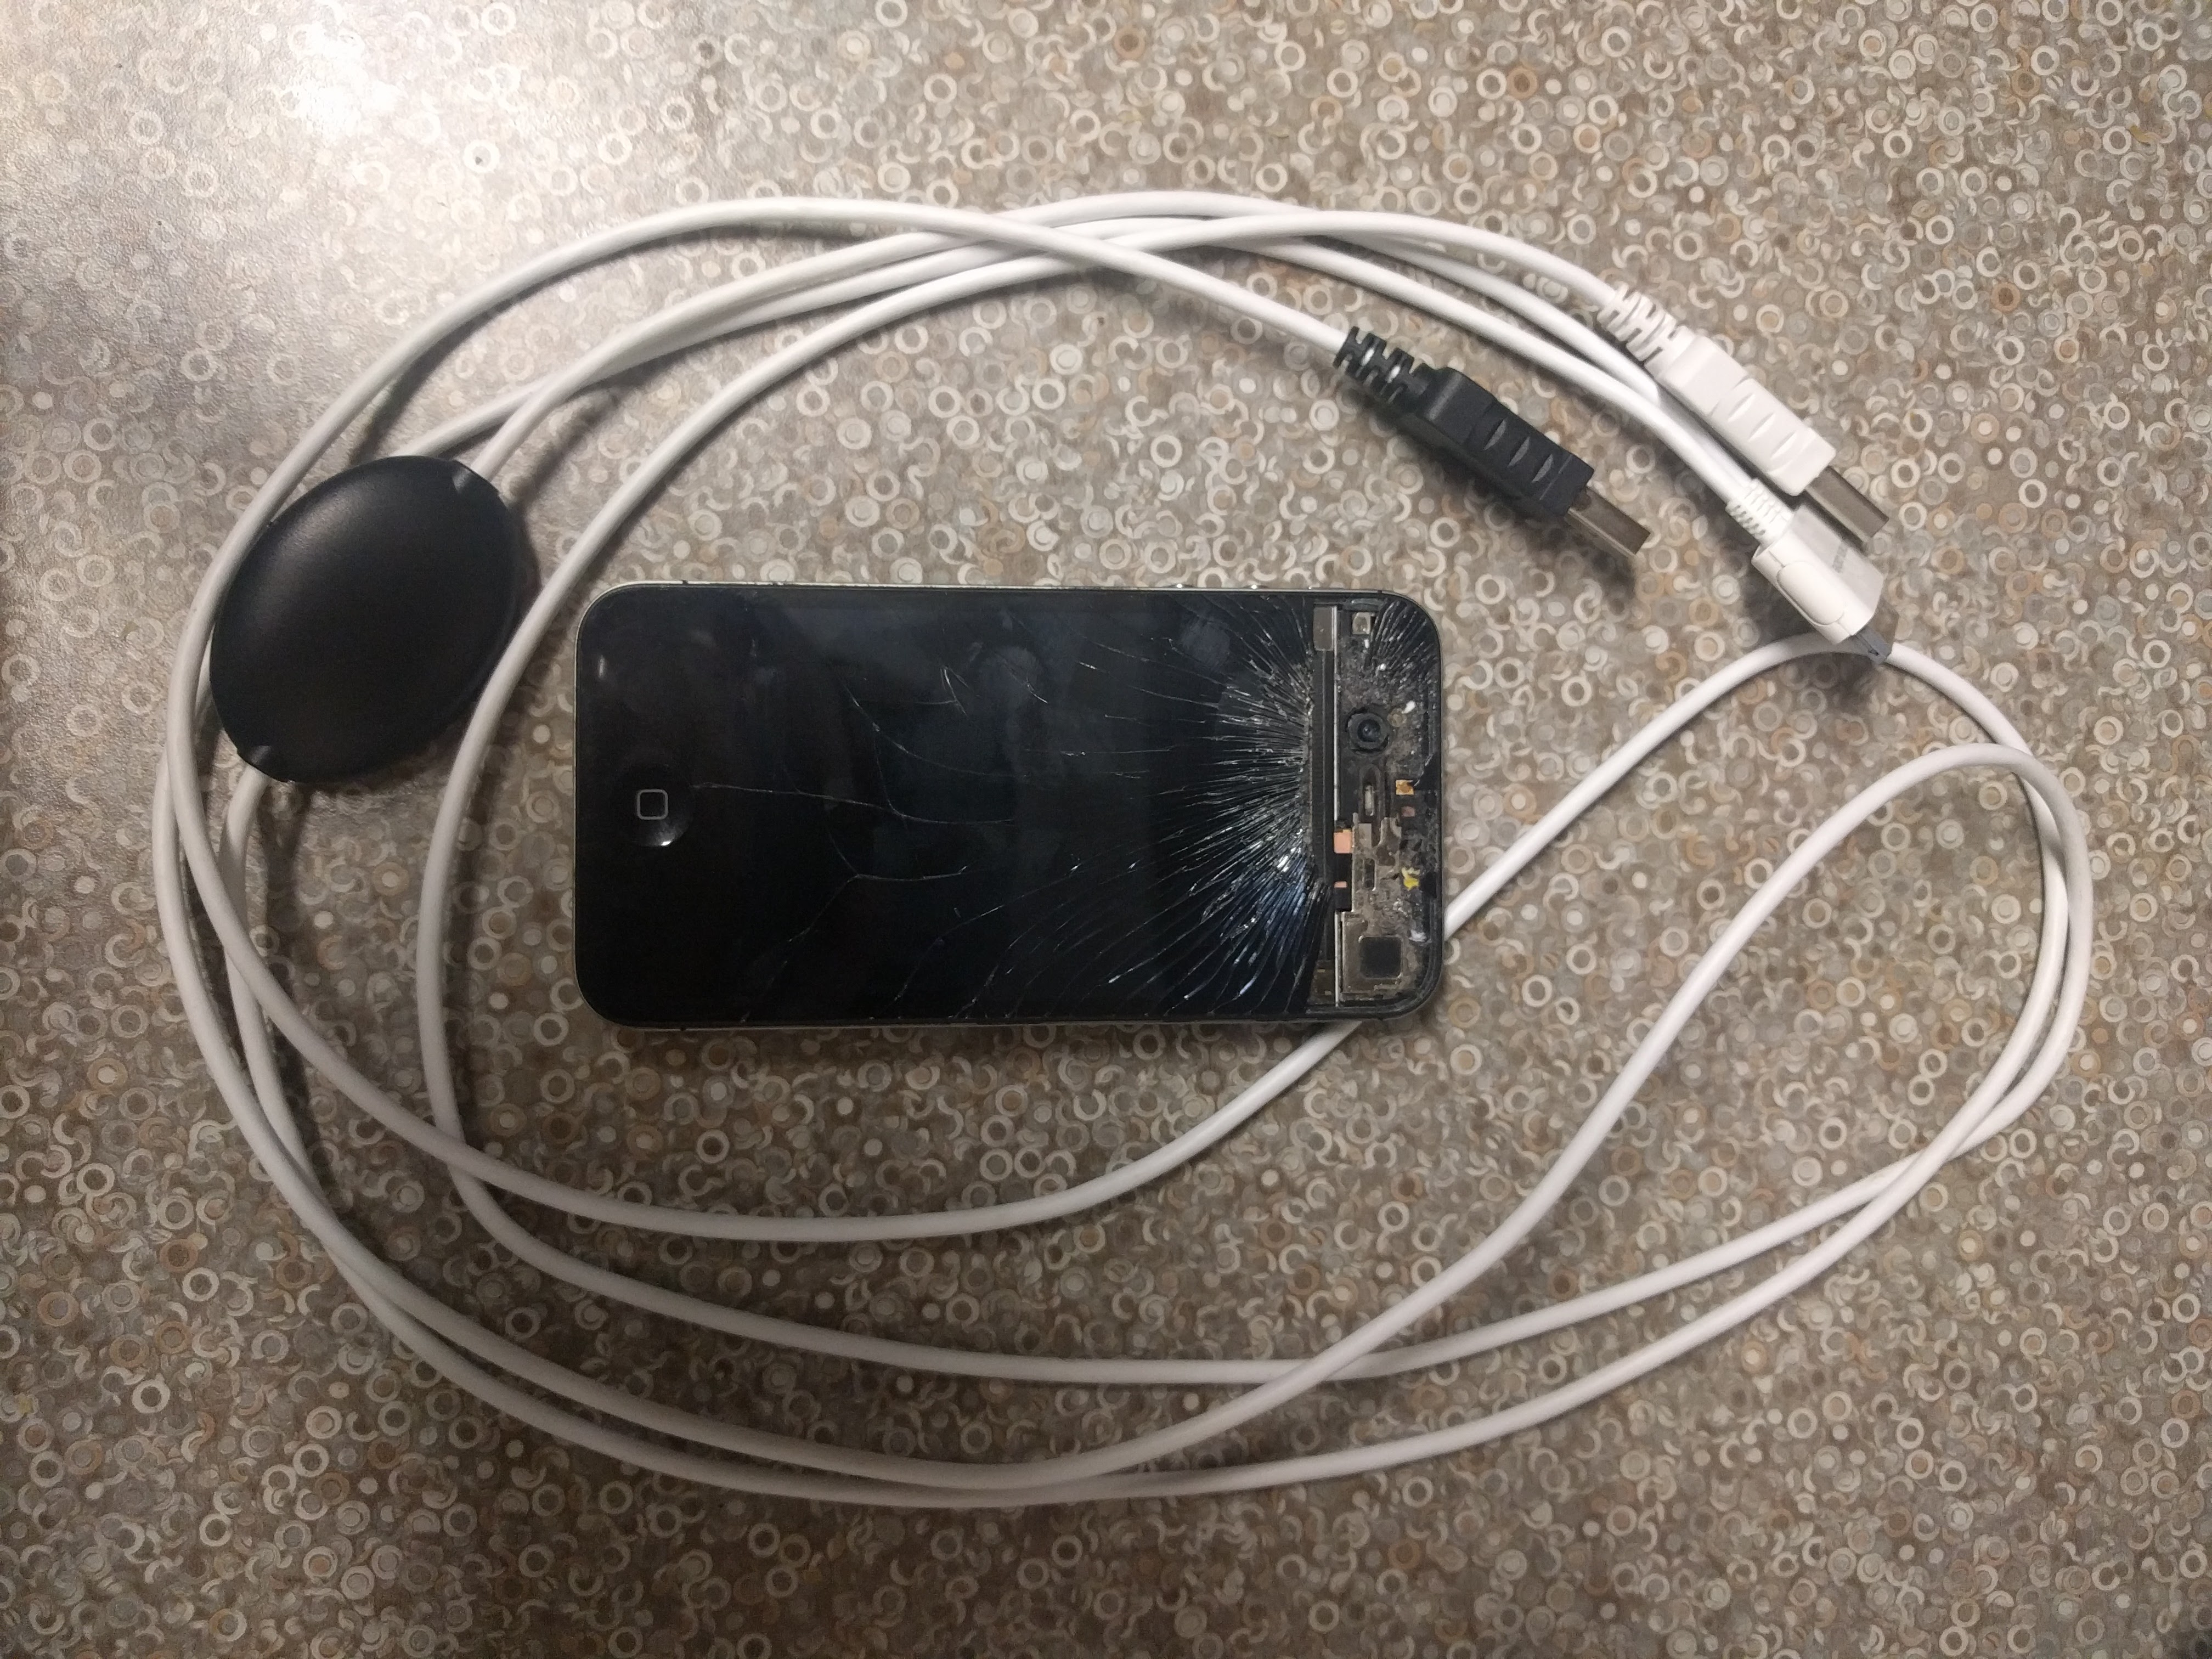
All that is needed to get basic kernel debugging is:
- An iOS device that you can either set the boot arguments for, or have necessary kernel patches to enable debugging
- In this Instructable I will demonstrate using an iPhone 4, which we are able to set the boot arguments for using the RedSn0w tool.
- An iOS serial debugging cable
- GDB installed with Apple's modifications
- The GDB that comes with XCode will work perfectly.
- serialKDPproxy installed.
- The protocol that is used for kernel debugging is normally used over a UDP socket not serial, so we need to use a tool that will proxy it for us. Luckily, someone has written the code to do that already. The code and installation instructions are available here.
Step 2: Jailbreaking the Device and Setting Boot Arguments
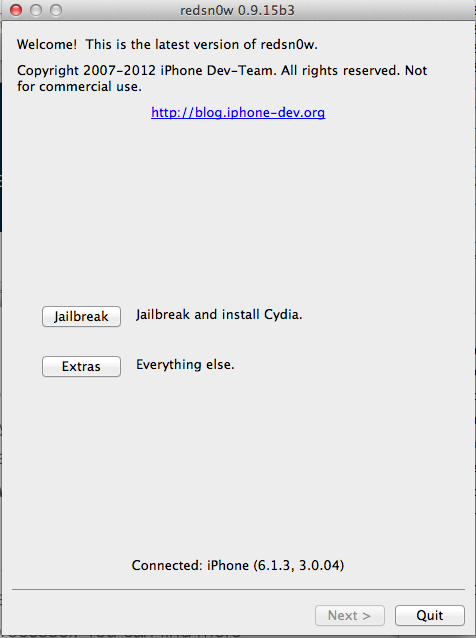
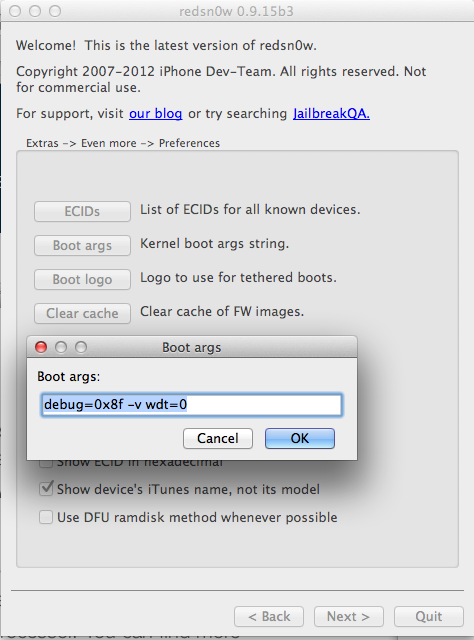
iOS kernels are not able to be debugged right out of the box. This is because Apple engineers do not want to make it easier for exploits to be found. So we must jailbreak the device first to be able to set the correct boot arguments and apply the appropriate kernel patches.
The process of jailbreaking an iOS device with RedSn0w has been covered extensively elsewhere, however it is crucial that you add the appropriate boot arguments when you use the tool. You can do this by going to Extras -> Even More -> Preferences -> Boot Args. In the text box you should enter the following string "debug=0x8f -v wdt=0". These arguments in order tell the kernel to:
- boot in debug mode with special flags
- boot in verbose mode
- boot with the watchdog timer disabled so execution can be paused for arbitrary amounts of time without being killed.
When you boot now the device will halt at startup and wait for you to attach a debugger.
Step 3: Using SerialKDPproxy
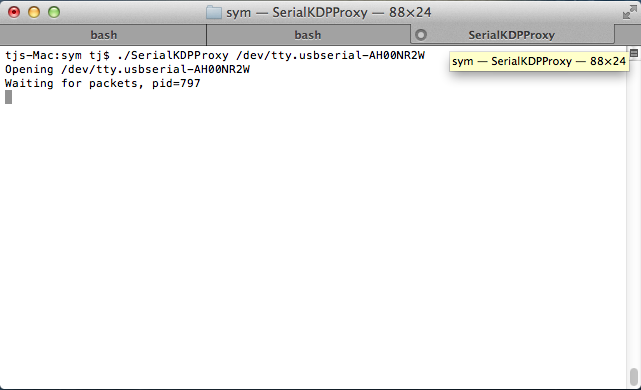
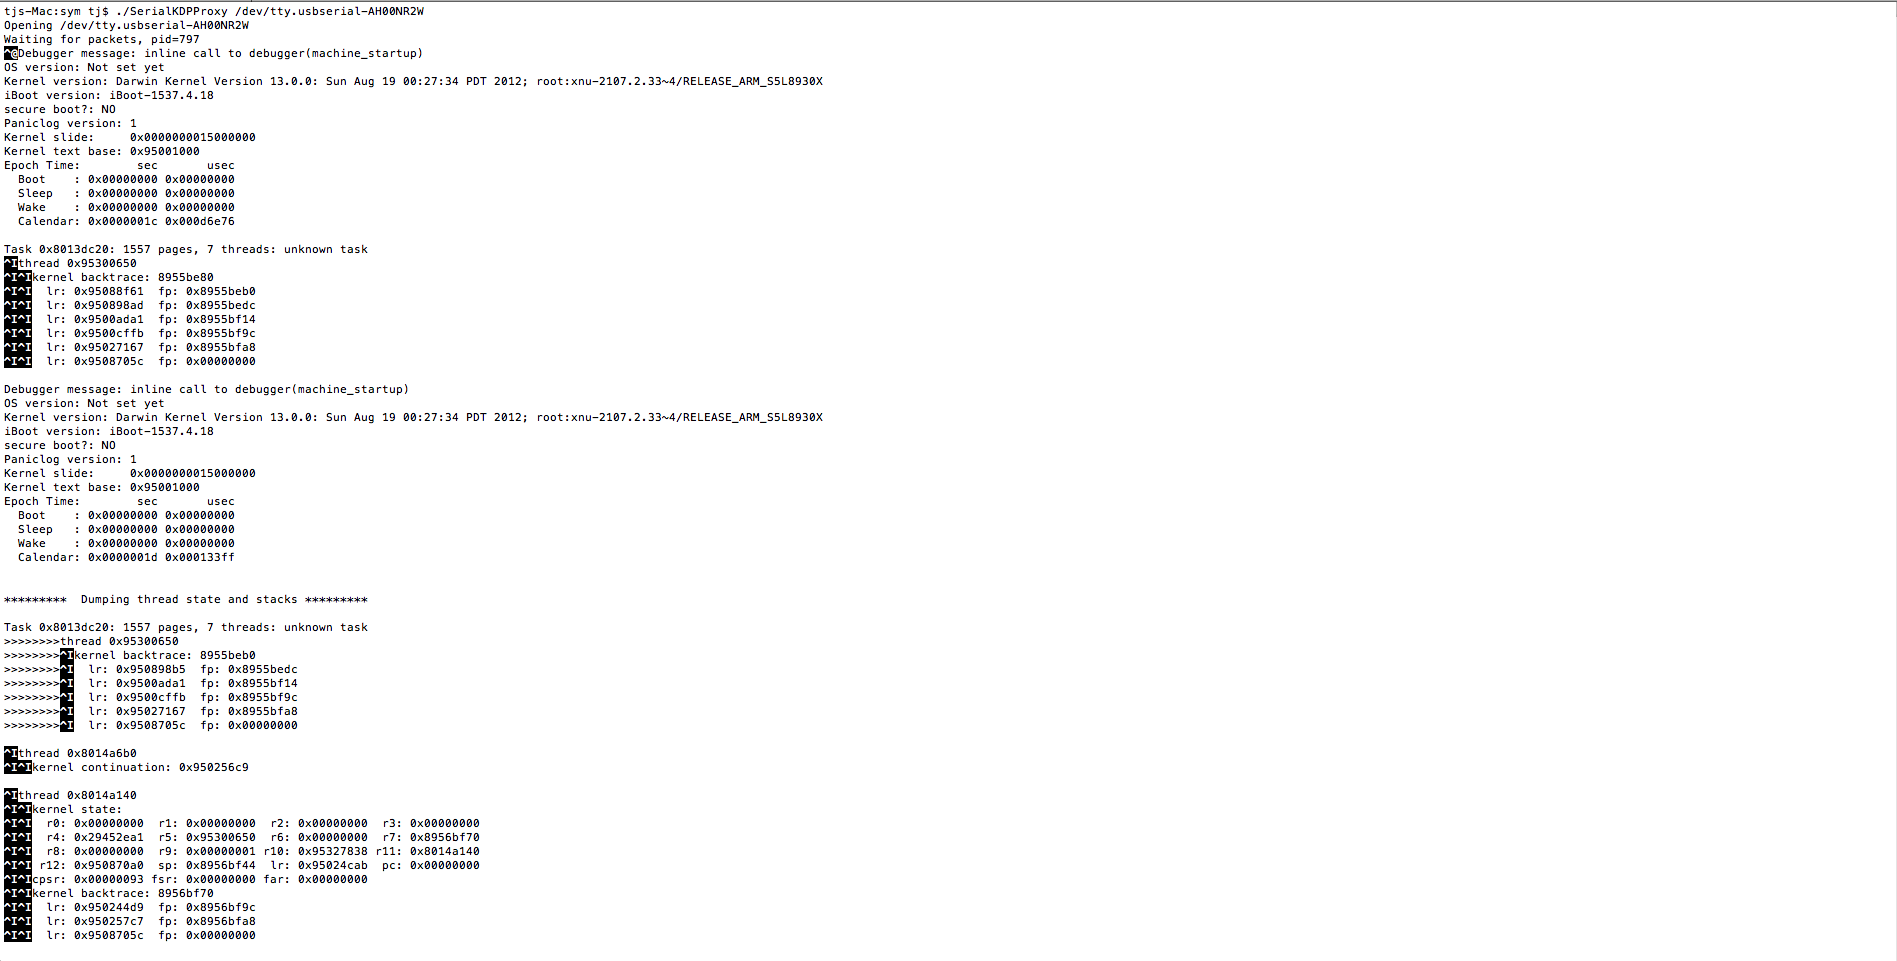
Now that device is halted and waited for a debugger to be attached we need to start serialKDPproxy. The usage is simply ./SerialKDPProxy . So for example for me it was ./SerialKDPProxy /dev/tty.usbserial-AH00NR2W. After this there should be various debug messages outputted to the console from the device. You could also run this before the device boots up and there would be a flood of output that would help show you what is truly going on when the device turns on. For example the kernel slide will be displayed which will allow us to determine function addresses.
Step 4: Attaching With GDB
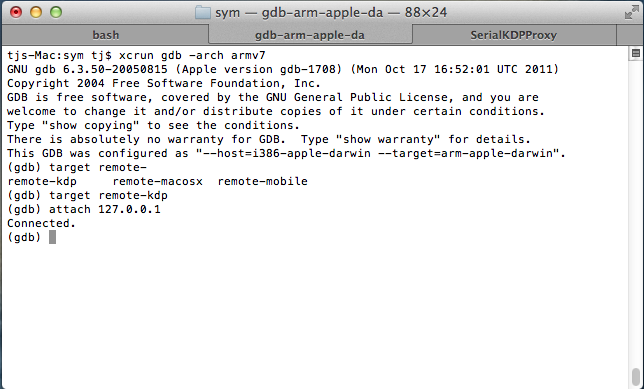
Since serialKDPproxy is now forwarding the connection how we want it. It is now very simple to get attached to the kernel. First off you need to start gdb with the following command. gdb -arch armv7. This tells gdb that it will be debugging an iOS device rather than an OS X application which has an i386 architecture. After you are in the gdb prompt all that you need to do to connect is type target remote-kdp and then attach localhost. You should get a response back that says you are connected. If not make sure that put the right boot arguments in, and that you have the serialKDPproxy attached to the right device.
Another thing that you can do is if you have a symbolized kernelcache you can add that to the arguments when you start gdb. It will then add the symbols to the kernel process when you connect and allow you to reference functions by their names rather than just by their address.
Step 5: Basic Debugging Abilities
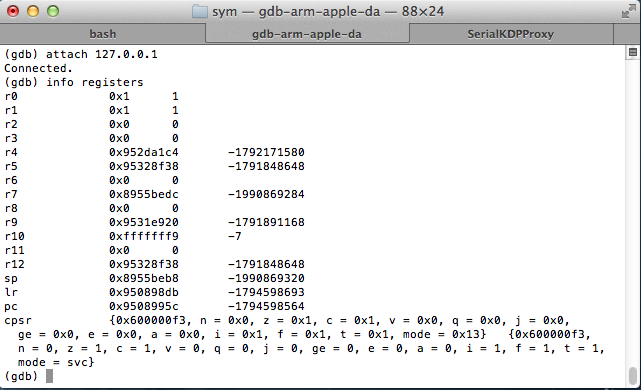
You now have basically all the same capabilities that gdb normally has. You can get the contents at a memory address with the command p *(int *)address, and you can also set the contents as well with set {int} = val . You can also disassemble the code at a function with x/i addr or disassemble . You can also view all the registers with the command info registers. Breakpoints are also set with the command break *(addr). These are all just standard gdb commands that work flawlessly.
These capabilities can be very powerful. There are many situations where this can greatly help your reverse engineering efforts. Sometimes one minute of debugging can be equivalent of hours of static analysis of the binary. The next step will show you an example of this.
Step 6: Example of Setting a Breakpoint
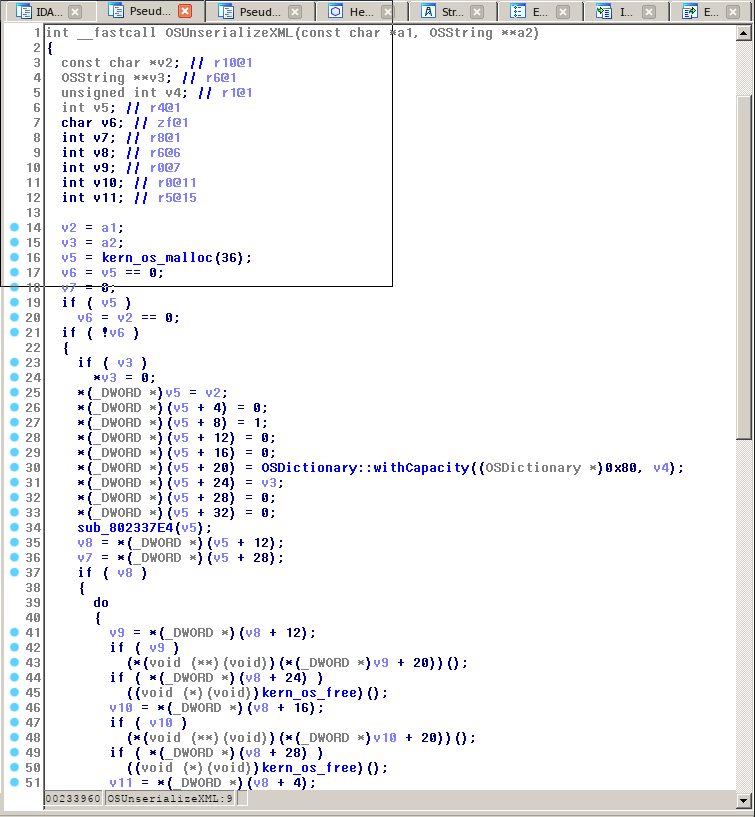
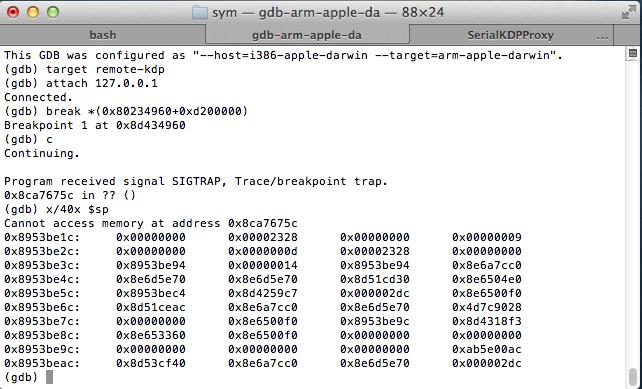
So let's say you were analyzing the function OSUnserializeXML for a vulnerability and you wanted to know what the stack looked like when it was called at a certain time. You could use static analysis to look at the assembly of the kernel inside a program like IDA Pro to figure out what possibly it would look like. Or you could simply find the address of the OSUnserializeXML function in IDA, and add it to the kernel slide that was printed to the serial console at boot to find the true address of the function, and then just set a breakpoint there. Then when it is called the execution will stop and you will have complete control to analyze what is going on.
That's all and I hope you learned a lot!