How to Make an Adult Hearing Test Using MATLAB
by amaizyng in Circuits > Software
2885 Views, 3 Favorites, 0 Comments
How to Make an Adult Hearing Test Using MATLAB
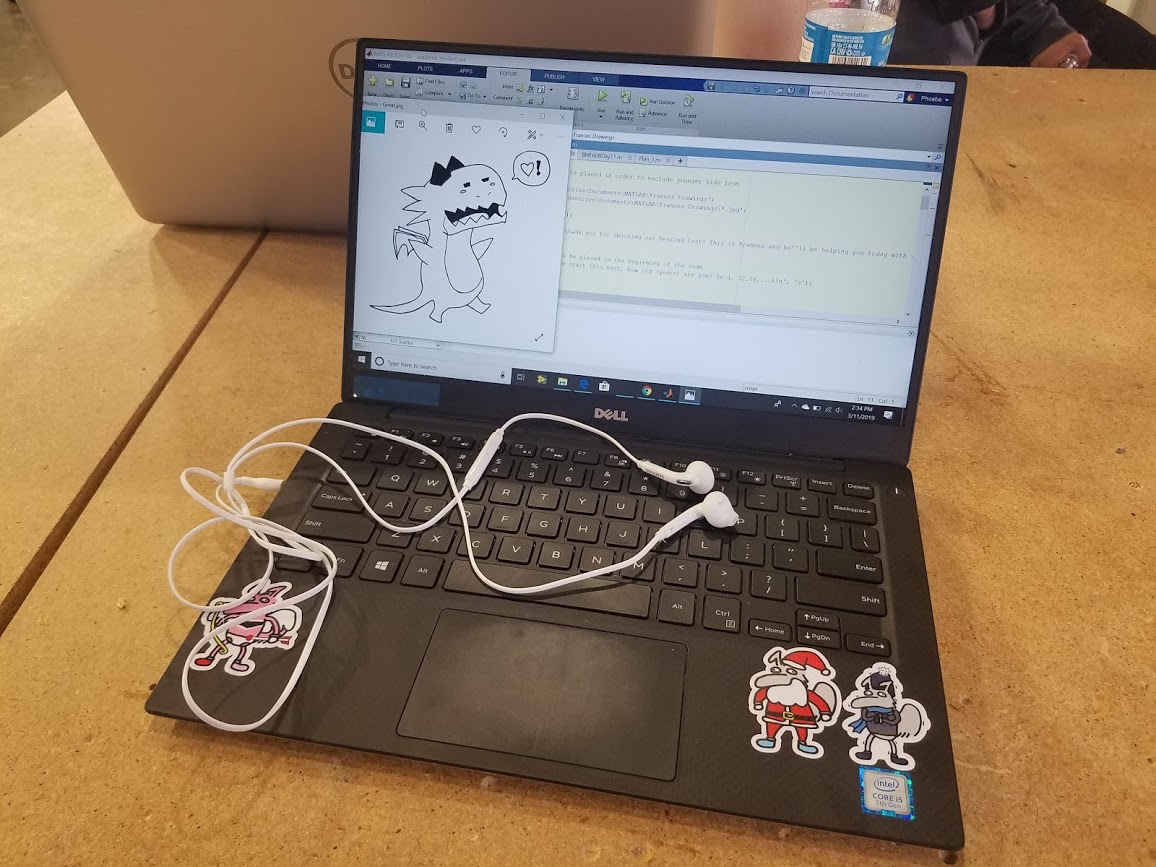
DISCLAIMER: Our test is NOT a medical diagnostic and should not be used as such. To accurately measure hearing, please see a medical professional.
Using materials we already had, our group made a hearing test. Our test is for adult and teen use only because young children's hearing comes in various ranges and should be measured only by a professional.
This project was inspired while working in our BME MATLAB class and playing with sounds made by sine waves. We were interested in the ways a sine wave could be changed to play a sound at different pitches.
All we needed for this project was a computer running MATLAB R2018b and a pair of earbuds. We included an original character, Frances, as a mascot to make the program more humorous.
Create a User Input to Analyze the User's Age
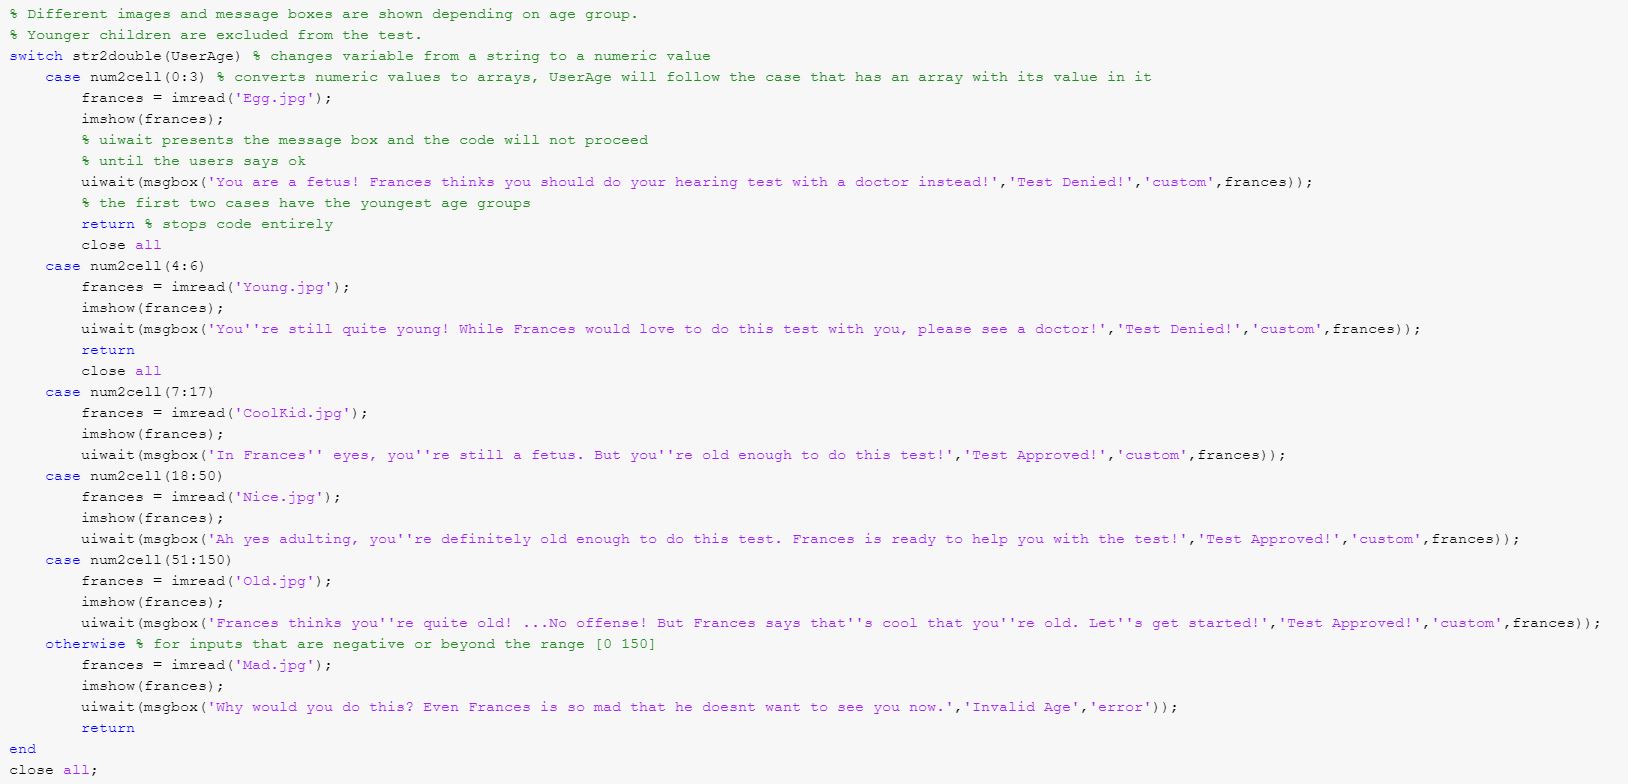

The first part to this code is to make a user input in which decides whether they are old enough to proceed to do the hearing test. Why not do it by also adding in silly pictures of our mascot, Frances? To do so, download the zip file included and then extract it to a file that can be pulled up into the code. Proceed to batch upload the file full of drawings by using this:
Dir = 'C:\Users\phoeb\OneDrive\Documents\MATLAB\Frances Drawings';
GetDir = 'C:\Users\phoeb\OneDrive\Documents\MATLAB\Frances Drawings\*.jpg';
In order to present the message boxes and large images of the drawings, we used this fun method of showing Frances to you. Simply imread an image of your choice with the format: variable = imread('nameofpicture.jpg');
Then proceed to show it by using imshow(variable); it will then show up as a figure in your MatLab when you run it!
Next are the message boxes which are used throughout the code. uiwait() is a function in which the code is halted until the fuction that is chosen for uiwait is finished. This chosen function is msgbox('message','title','icon')!
You can feel free to change the messages Frances says so long as you follow the msgbox() format above. If you want to use Frances pictures, label 'icon' as 'custom' and proceed that with a comma and the variable of the imread of the picture you chose! You can also use the preset 'icon' types as well. it should look like this:
hi = imread('Regular.jpg'); % reads the image from the file uploaded
imshow(hi); uiwait(msgbox('Hello and thank you for choosing our hearing test! This is Frances and he''ll be helping you today with your test!','Welcome!','custom',hi));
Next create an input that asks the user's age like so!
UserAge = input('Before we start this test, how old (years) are you? (e.g. 32,56,...)\n', 's');
NOTE: if the figures are being weird and there are too many, use close all in order to remove the earlier figures as your code runs
Then create a switch case structure! Remember that the user input is in string and you need to convert that into a numerical value. So use str2double(UserAge). Each case should have a range of ages such as 4 to 6 or 18 to 40. to have the variable to verify as true for one of the cases use num2cell(array) like so:
switch str2double(UserAge) % changes variable from a string to a numeric value
case num2cell(0:3)
frances = imread('Egg.jpg');
imshow(frances);
uiwait(msgbox('You are a fetus! Frances thinks you should do your hearing test with a doctor instead!','Test Denied!','custom',frances));
return
The earlier groups should be returned in order to prevent the user from proceeding with the code.
Remember to end the case structure and close all figures.
Downloads
Test the Audio for the User
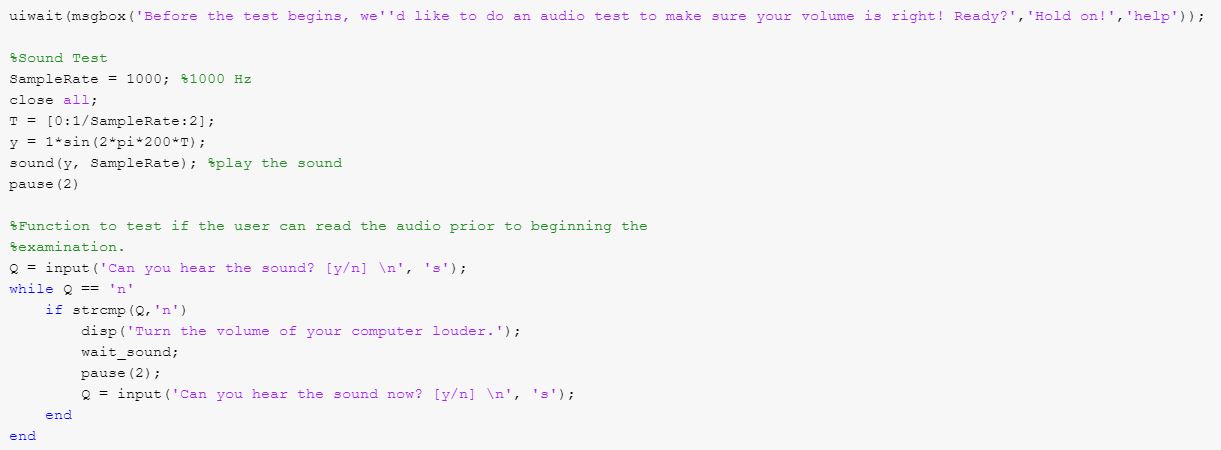
This segment exists to ensure that the participant's sound on their device is neither too quiet nor too loud.
To give the user some warning a message box pops up and waits for confirmation from the user before continuing onward with the sound: uiwait(msgbox('Before the test begins, we''d like to do an audio test to make sure your volume is right! Ready?','Hold on!','help'));
A sine wave is played with an amplitude of 1 and the sample rate of 1000 Hz: T = [0:1/SampleRate:2]; y = 1*sin(2*pi*200*T); sound(y, SampleRate);
The user is then asked a question with an user inputted response: Q = input('Can you hear the sound? [y/n] \n', 's');
Then there is a while look for when Q == 'n', if true then the sound repeats and asked the user again until the answer has changed from 'n' to 'y': while Q == 'n' if strcmp(Q,'n') disp('Turn the volume of your computer louder.'); wait_sound; pause(2); Q = input('Can you hear the sound now? [y/n] \n', 's'); end end
There is then a moment of waiting before carrying onto the actual examination portion of the code.
Make the Audiometry Test for the Right Ear
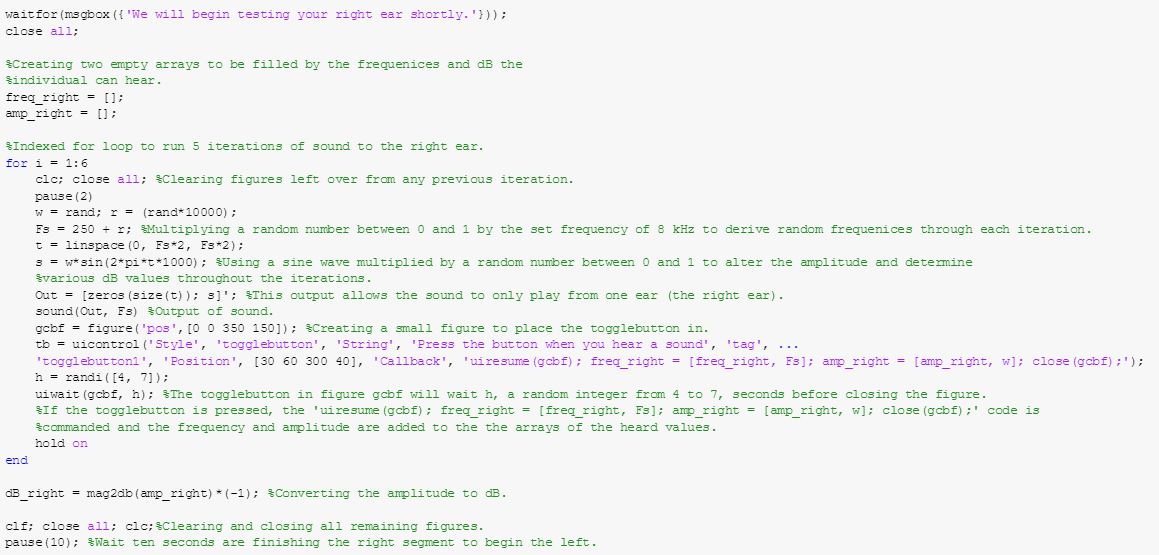
In this code, a loop will run for 6 iterations with varying frequencies and volumes for each individual ear. Depending on the ear you want to test, the Out variable will have sound in one row and zeros in another.
First you make two empty line vectors to record the frequencies and amplitude of sound that the user hears.
This portion is in a indexed for loop for however many sounds you want to play if you wish to randomize the frequencies played and the amplitude.
F is the frequency: r = (rand*10000); Fs = 250 + r; (the rand function is to create a randomly generated frequency) t is a certain amount of time progressed determine by: t = linspace(0, Fs*2, Fs*2); s is the sine wave: s = sin(2*pi*t*1000); (this can be multiplied by the random variable w to create a random amplitude/dB value for the sound function: w = rand;)
The output for the right ear is: Out = [zeros(size(t)); s]';
The outputs is played through the code: sound(Out, Fs)
The next step is to make a user interface in with the code records whether the user heard the sound or not.
First you make a figure and determine the position in which the figure will appear: gcbf = figure('pos',[30 800 350 150]);
***If the button does not appear for you, the position of the figure, as shown by the array above, may be positioned wrong for your computer. To solve this, change the 30 and 800 values to whichever position you desire. For instance, having [0 0 350 150] will spawn the gui button at the bottom left of the monitor.***
A togglebutton is made to record when the user hears the sound, and the position and display can be customized: tb = uicontrol('Style', 'togglebutton', 'String', 'Press the button when you hear a sound', 'tag', 'togglebutton1', 'Position', [30 60 300 40], 'Callback', 'uiresume(gcbf); freq_right = [freq_right, F]; amp_right = [amp_right, w]; close(gcbf);'); This particular code has the code resume and the empty vectors add a value if the button is pressed.
Then create a wait function to intake the response of the button and activate the code in the button when pressed: h = randi([4, 7]); uiwait(gcbf, h); (we did the random variable h so participants couldn't cheat and determine the number of seconds necessary to respond.)
After the loop is finished, keep the frequency output variable (freq_right) in Hz so leave it alone. Then convert the dB_right variable from amps to decibels by using the equation: dB_right = mag2db(amp_right)*(-1);
Then add the function: close all. this will exit out of any unnecessary figures that may have popped up.
Add a pause function, about 10 seconds, in order to give time for the user to adjust and prepare for the left ear.
Create the Same Code for the Left Ear
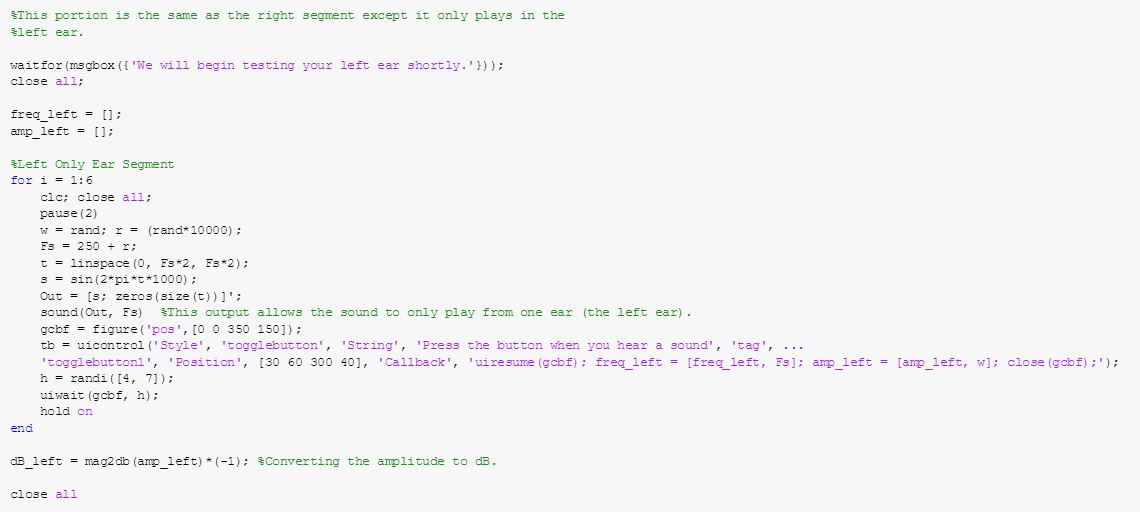
Repeat the code for used for the right ear to make the next segment that tests the left ear. The only difference is changing which output channel the sound will come from. To do this, flip the order of the array values for the variable Out. It should look like this:
Out = [s; zeros(size(t))]';
By doing so, no sound will come out of the right channel but the left channel instead!
Make a Side-By-Side Figure to Compare the Data
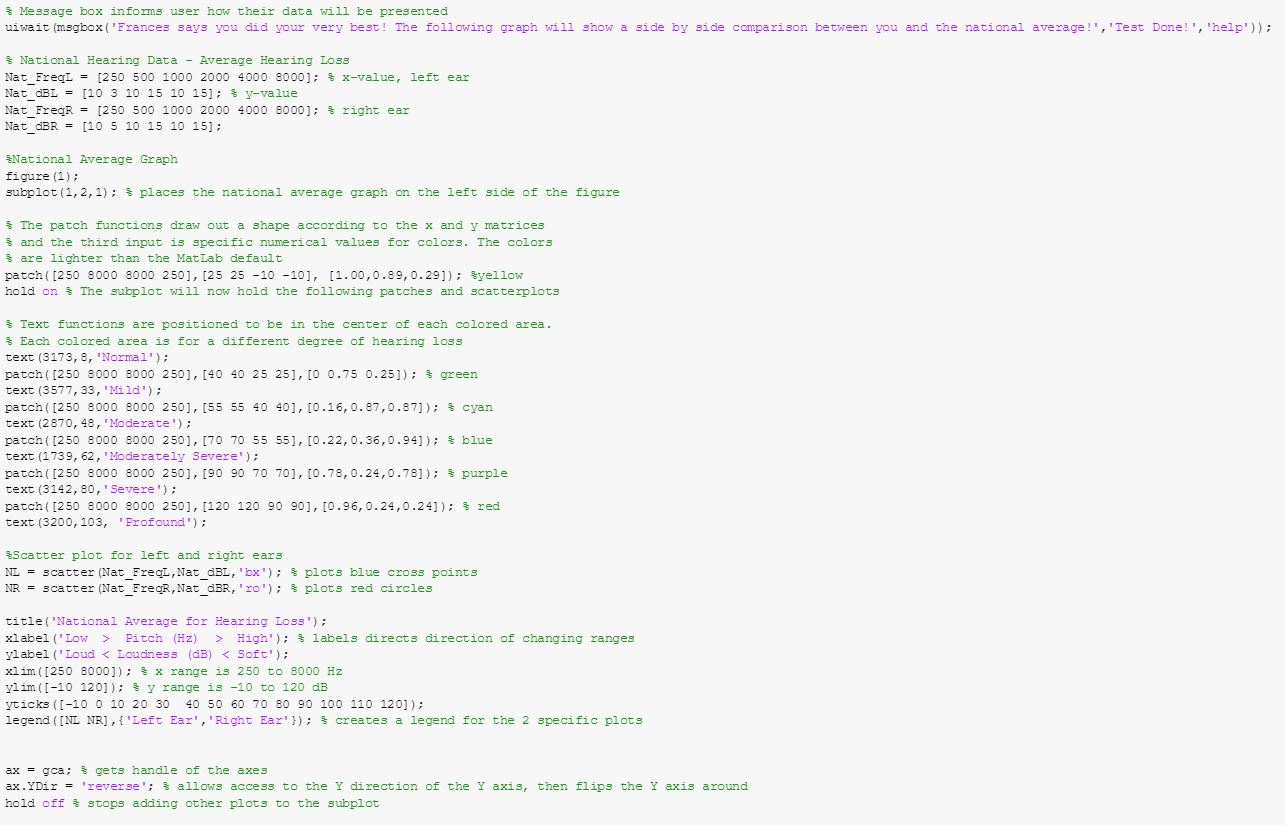

Now make a graph to show the data! You're putting two graphs into a single figure so do this!
figure(1);
subplot(1,2,1); ***subplot(1,2,2) for the other one
For each subplot, add in these patches with specific colors and coordinates. These section off the graph depending on how big the degree of hearing loss it is. Like so:
patch([250 8000 8000 250],[25 25 -10 -10], [1.00,0.89,0.29]); %yellow
hold on % The subplot will now hold the following patches and scatterplots
text(3173,8,'Normal');
patch([250 8000 8000 250],[40 40 25 25],[0 0.75 0.25]); % green
text(3577,33,'Mild');
patch([250 8000 8000 250],[55 55 40 40],[0.16,0.87,0.87]); % cyan
text(2870,48,'Moderate');
patch([250 8000 8000 250],[70 70 55 55],[0.22,0.36,0.94]); % blue
text(1739,62,'Moderately Severe');
patch([250 8000 8000 250],[90 90 70 70],[0.78,0.24,0.78]); % purple
text(3142,80,'Severe');
patch([250 8000 8000 250],[120 120 90 90],[0.96,0.24,0.24]); % red
text(3200,103, 'Profound')
Then add the left and right scatter plots! We can provide a general national average for you! Here:
Nat_FreqL = [250 500 1000 2000 4000 8000]; % x-value, left ear
Nat_dBL = [10 3 10 15 10 15]; % y-value
Nat_FreqR = [250 500 1000 2000 4000 8000]; % right ear
Nat_dBR = [10 5 10 15 10 15];
The scatter plots should discern the left and right points. You could do crosses and circles!
NL = scatter(Nat_FreqL,Nat_dBL,'bx'); % plots blue cross points
NR = scatter(Nat_FreqR,Nat_dBR,'ro'); % plots red circles
Make a legend for the national graph by assigning it to specific variables: legend([NL NR], {'title1','title2'});
Set your x limit from 250 to 8000 Hz and your y limit from -10 to 120 dB. Remember to change your vertical ticks with yticks([])
Label your x axis "Frequency Hz" and your y axis "Pitch dB".
Reverse the y axis by gathering the axis with ax = gca
Then bind the property of the y direction to it with: ax.YDir = 'reverse
Now the code for the second is about the same but without the legend and graphing the scatterplots with the variables from the left and right tests.
After all of this, add a pause function for about 10 seconds so that the user can look at their results.
Add a Little Thank You Message If You'd Like!

This is just for fun if you'd like but add another imread(), imshow() and uiwait(msgbox()) for a thank you and farewell! Other than that, remember to put clf; close all; clc; in order to close everything. Good job you did it!