How to Make a Basic Gantt Chart in Google Sheets
by RALEE1023 in Teachers > Resources
374 Views, 0 Favorites, 0 Comments
How to Make a Basic Gantt Chart in Google Sheets
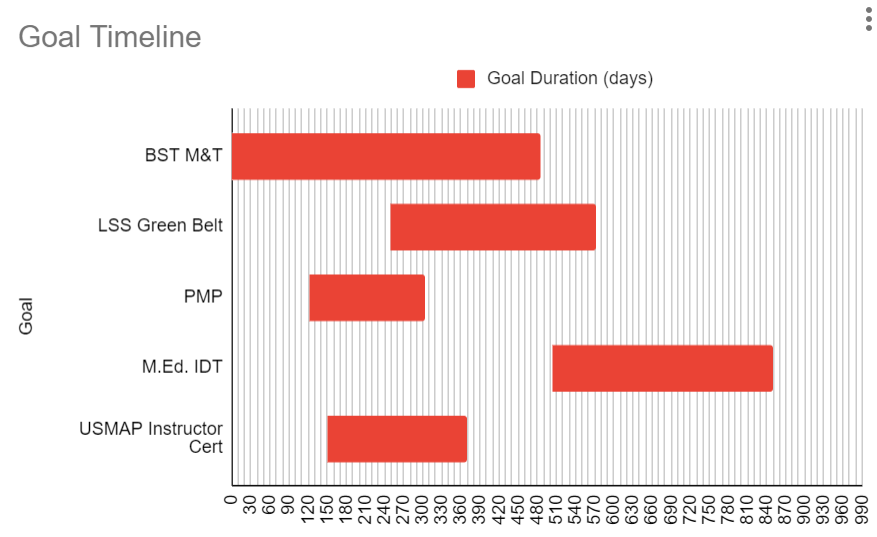
Want an easy way to visualize your goals, or manage overlaps between projects? The Gantt Chart is for you! A Gantt Chart is a project management tool that illustrates work completed over a period of time in relation to the time planned for the work. In other words, it helps you lay out individual tasks to complete a project, and then allocate resources and time accordingly throughout the project timeline.
I personally use this to schedule my personal, professional, and educational goals and tasks to help me better balance the three. There are many uses for a Gantt Chart within any aspect of your life.
Disclaimer: While there is little to no potential for someone utilizing this Instructable to be harmed physically, please use caution on the internet. Avoid entering any type of Personally Identifiable Information (PII) to avoid risking compromise but unwanted access to this information.
Supplies
You will need to following items:
- a computer with applicable accessories. A basic laptop can be had for as low as $179 at places like Walmart or Amazon
- a Google account. Free to use with sign up
- Internet access. The Google suite of tools and applications are all web based, so internet is a must. Free WIFI can be accessed in a variety of places (coffee shops, libraries, some restaurants)
Open a Browser

Open either Chrome, Microsoft Edge, or as applicable for your computer platform
Sign Into Your Google Account
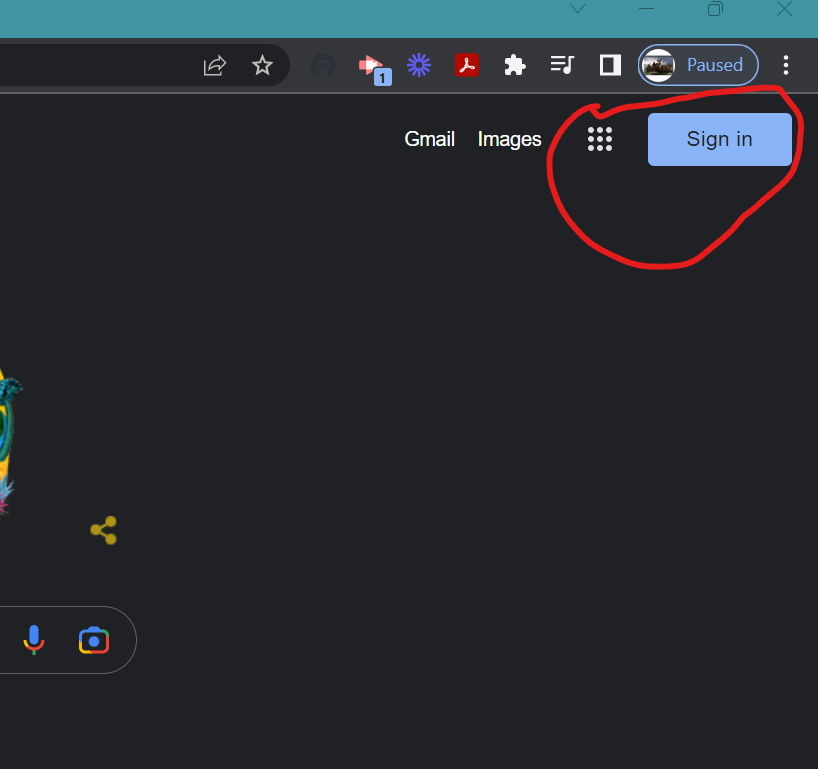
- First, navigate to google.com and click on the Sign In icon
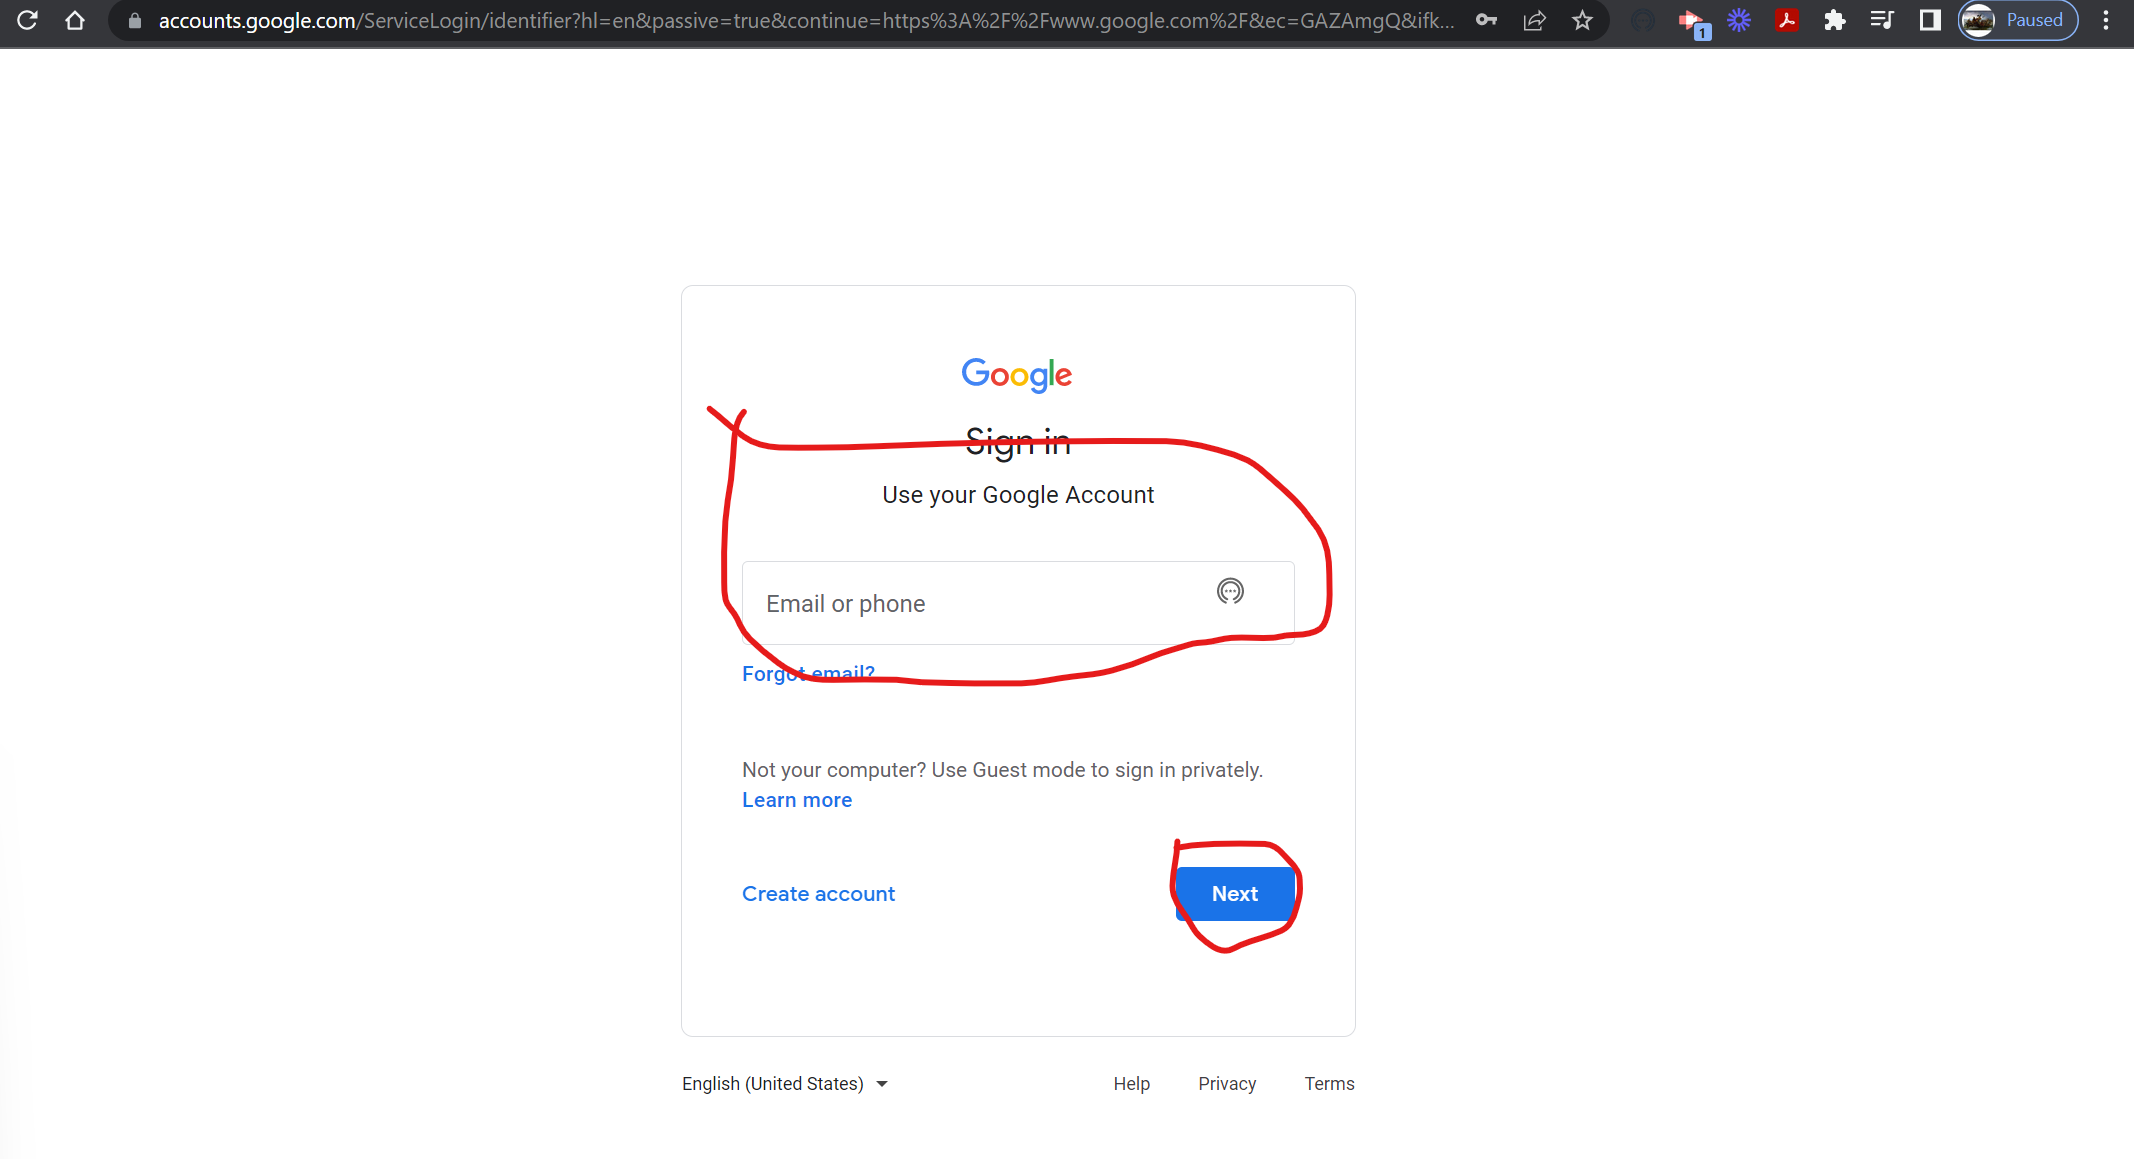
- Enter your Google email address or phone number as applicable, then hit next
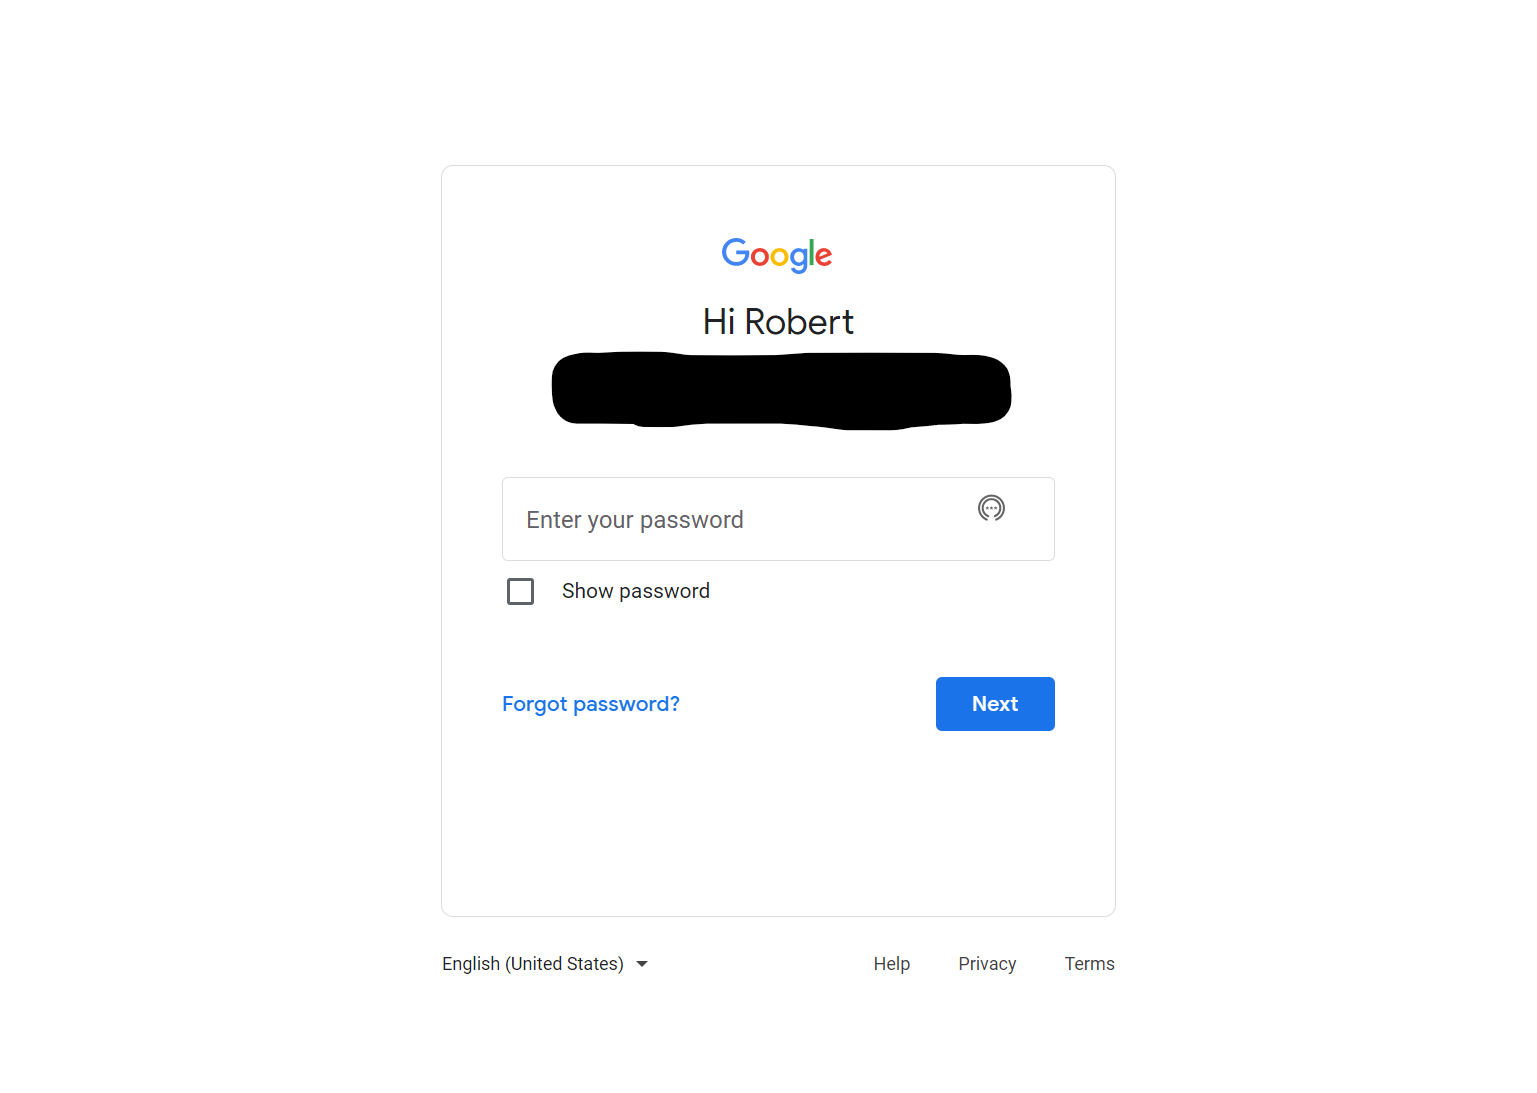
- Enter password for your Google account and hit next.
Open a New Google Sheets Spreadsheet
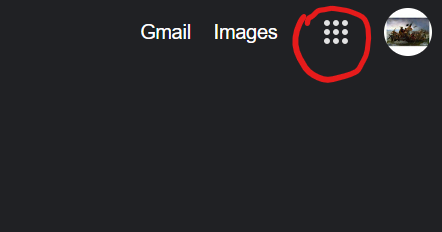
- Hover over the three by three dot icon in the top right hand corner of the page. This will open a drop down menu that you can scroll through to find the Google Sheets application icon
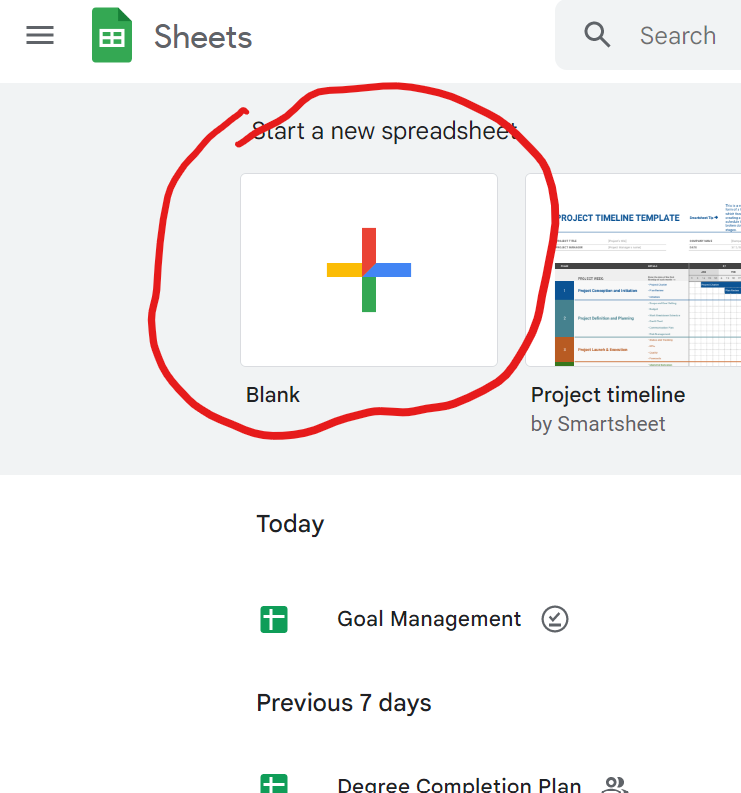
- Find the Google Sheets icon as pictured. Once you see it, click on it.
- Click on the "Blank" icon to open a new, blank spreadsheet.
Enter the Tasks and Data
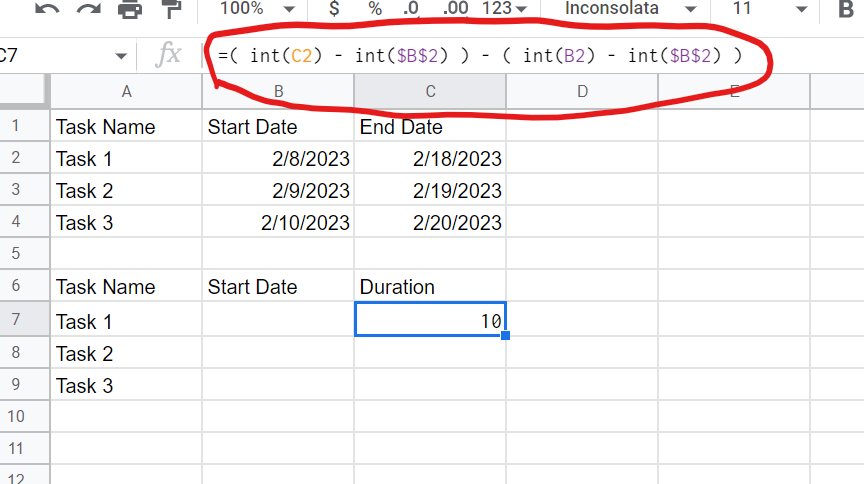
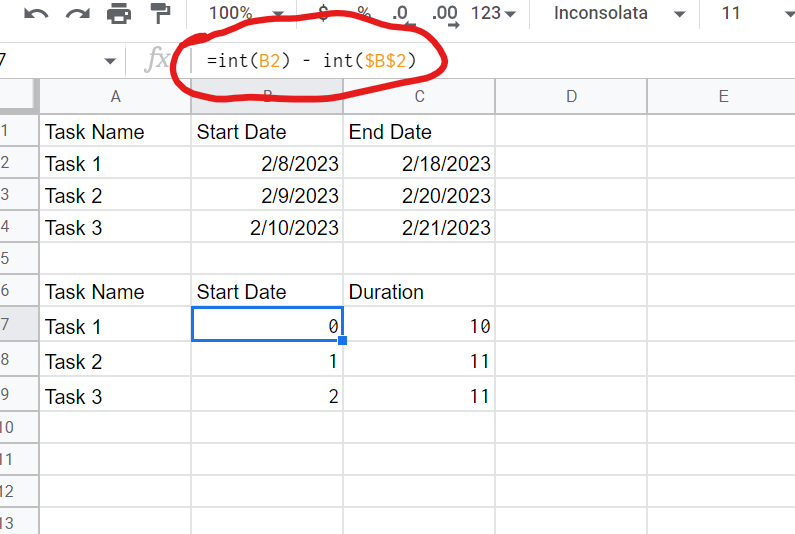
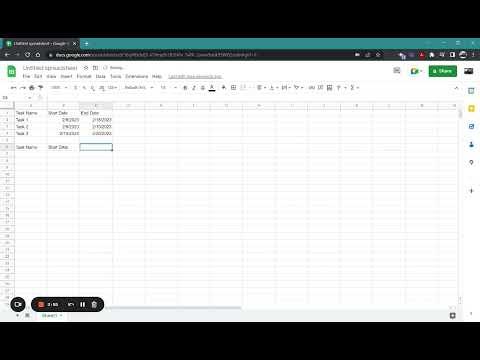
NOTE: In order for the formula and the table to work, the start dates for the Tasks must be in chronological order in the first table
- Please view the video for instructions on how to input the data for the Gantt Chart
- Here is a text version of the duration formula in the second table =( int(C2) - int($B$2) ) - ( int(B2) - int($B$2) )
- Here is a text version of the start date formula in the second table =int(B2) - int($B$2)
- NOTE: In order for the formula and the table to work, the start dates for the Tasks must be in chronological order in the first table
Insert the Chart
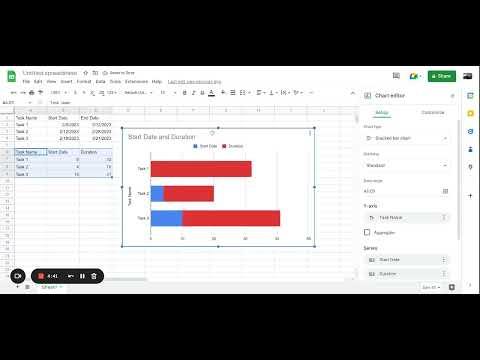
For this step, follow the video instructions. You may notice I changed some the data we inputted in Step 4 in this step. This was done to better show the purpose of the chart.
Editing the Chart
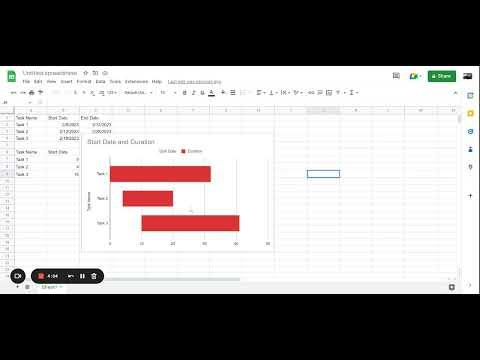
Please view the video to learn how to edit the chart from it's current state into what a Gantt Chart is supposed to look like. This will be your final product.
Adding Tasks to Your Gantt Chart and Customization
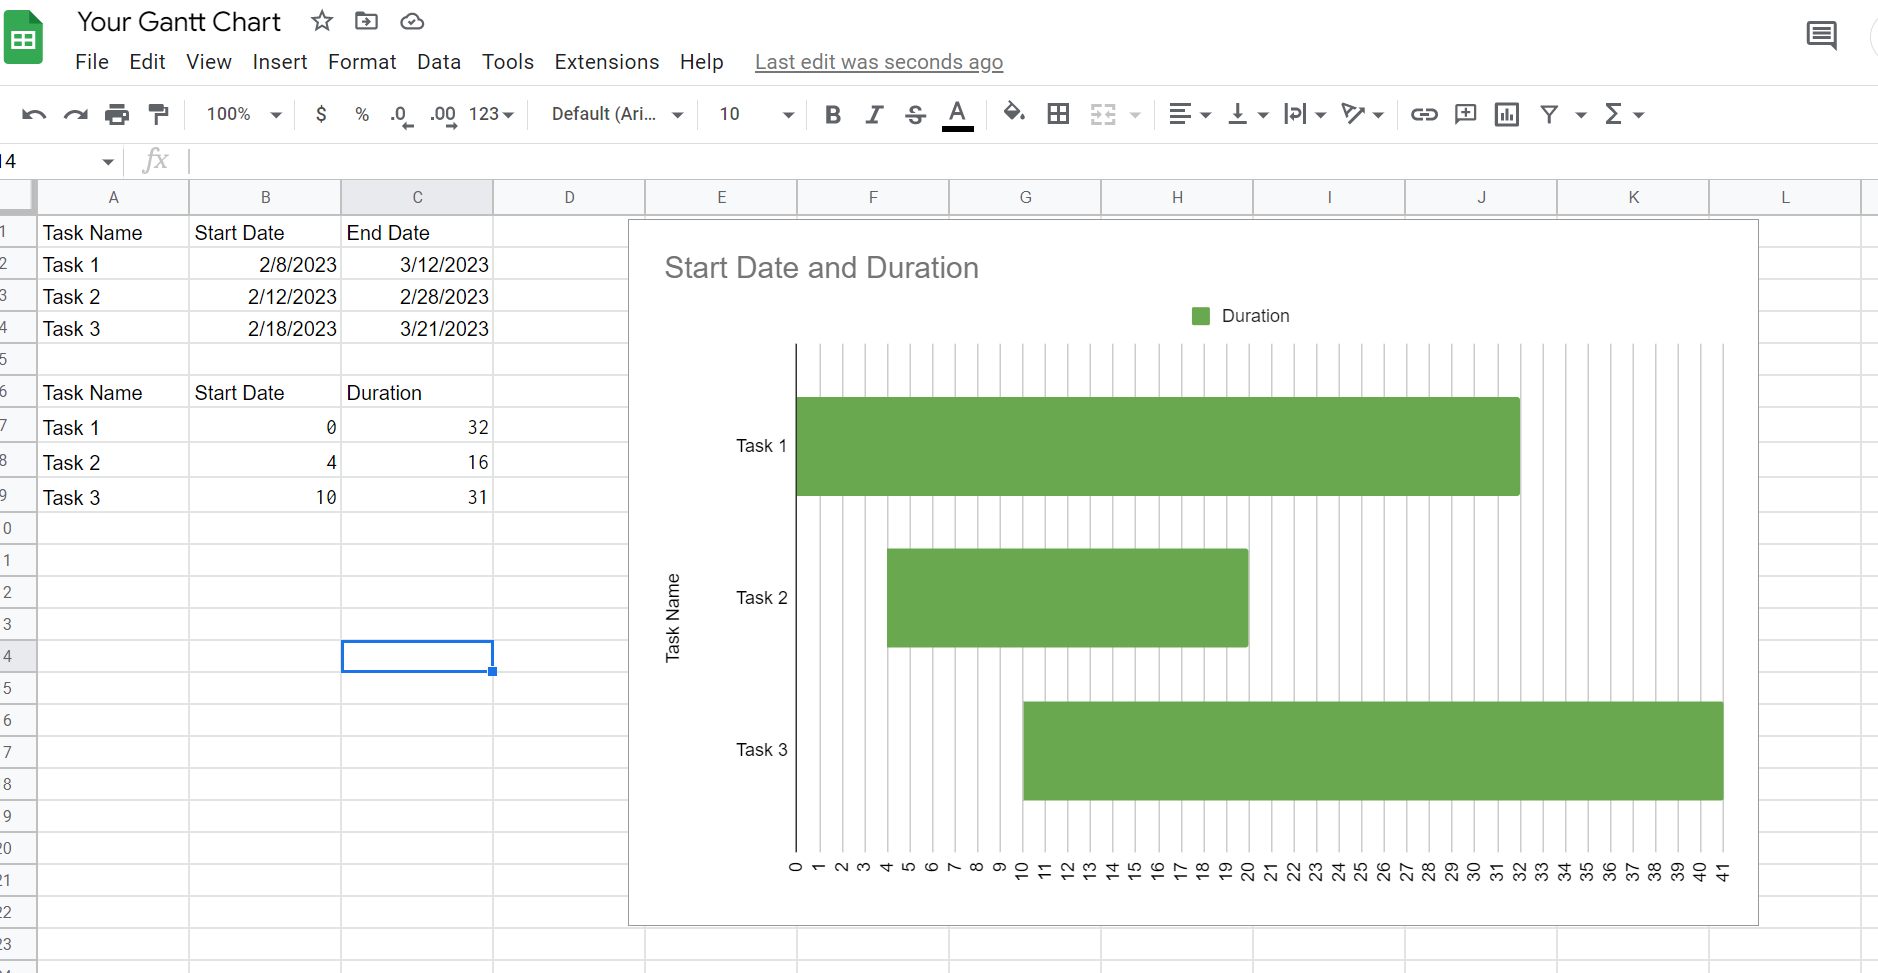
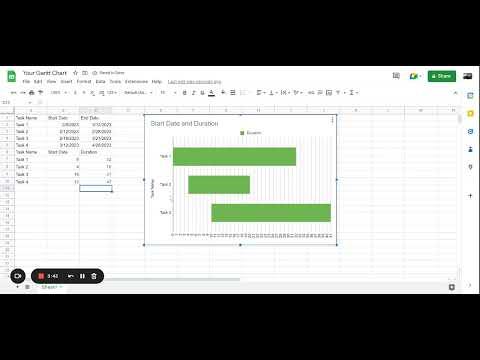
In this last step, the final image is what your Gantt Chart should look like in it's final form. From here you can edit to add new tasks, change the duration of the task, or remove completed tasks if you would like.
Thank you for taking time to view my Instructable. A Gantt Chart is a great big picture time management tool that I use in my everyday life in a personal and professional manner.