How to Draw Sweet 3D Graphics for LED Cubes
41923 Views, 252 Favorites, 0 Comments
How to Draw Sweet 3D Graphics for LED Cubes
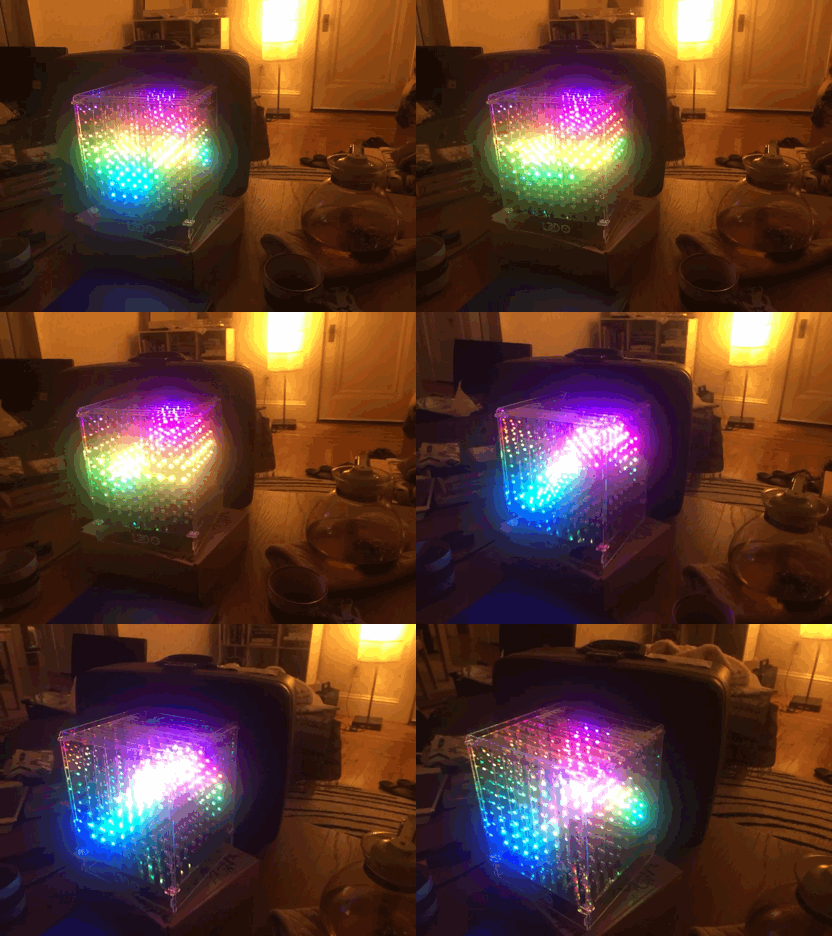
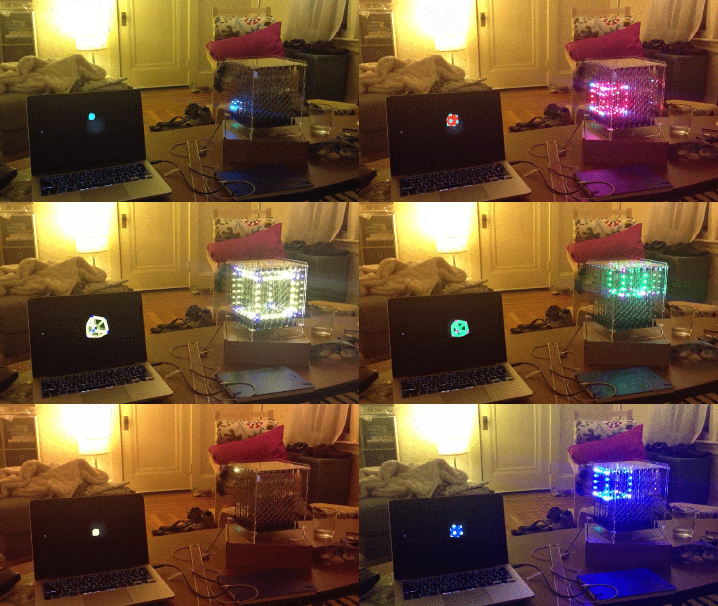
I've spent the last four months working with LED cubes, and this instructable is my way of sharing some of the knowledge and techniques that I've built up over this time. If you have a cube of your own, this might help you make cooler graphics and animations for your cube. Don't have a cube? Tinker around in simulation with my new Processing library for LED cubes.
If you want a cube of your own, allow me to shamelessly point you towards our own open-source, color LED cube, which we just launched on kickstarter.
Whatever you do, if you make something awesome, share it in the comments!
Happy Hacking,
Alex
Cube 101
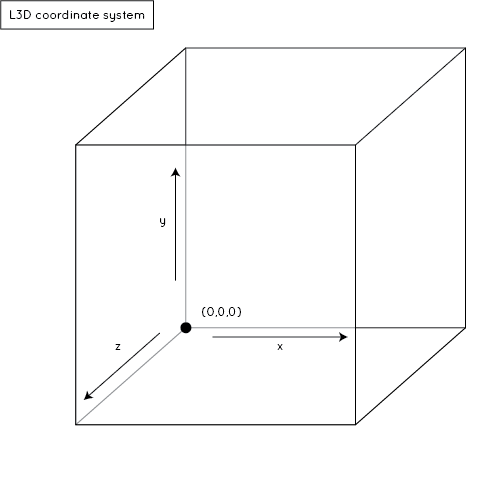
Drawing in an LED cube is just like drawing on a 2D screen.
On a 2D screen, you have a grid of pixels, and to draw a graphic, you just tell a pixel at a certain (x,y) point to be a certain color.
In a cube, you have a 3D grid of VOlumetric piXELs, or voxels, and you tell a voxel at a certain (x,y,z) point to be a certain color. The drawing here shows you the co-ordinate system I use in these animations.
In all the examples here, I'm drawing in an 8x8x8 cube, but these same techniques will work in any resolution.
If you'd like to follow along and work on your own code, grab the Processing environment if you don't already have it, and install the L3D Cube Processing library. All of the code in this instructable is included as an example in the library, and it makes a great jumping-off point for developing animations of your own.
Finally, put on a Journey playlist and punch your ticket on that midnight train.
Hello Cube: Blinking a Voxel
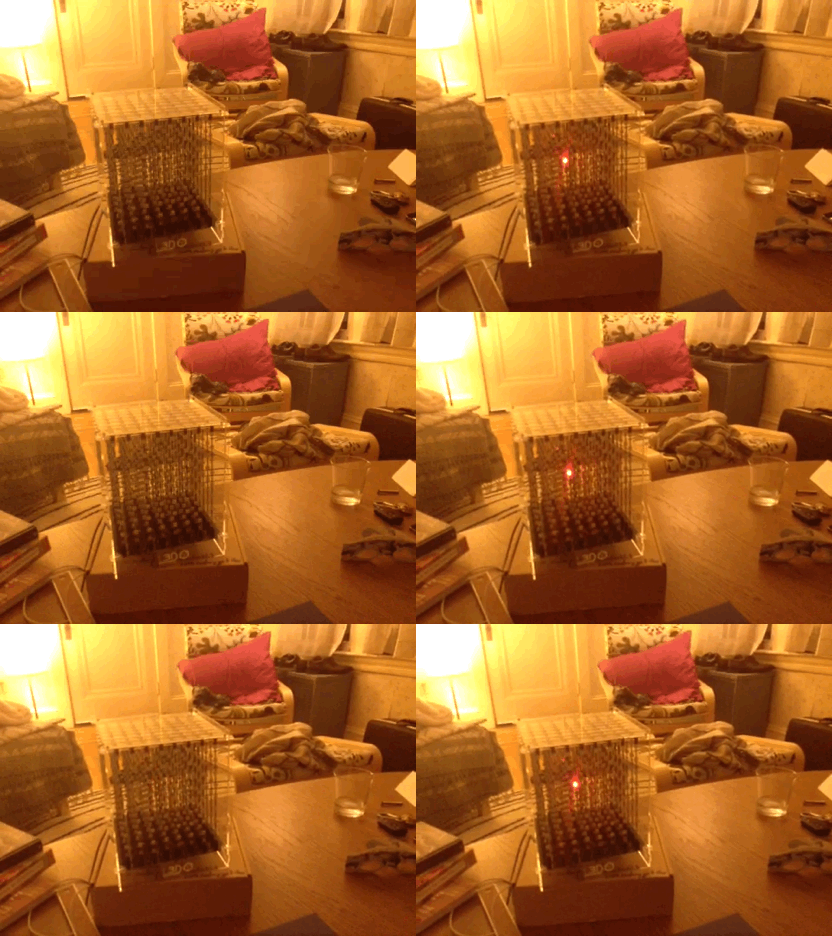
Blinking a single voxel off and on is the "hello world" of volumetric programs. I'm pasting the entire code below, and I'll go through it line by line, but before that, I want to spend some time with the most important function in the whole shebang:
setVoxel( PVector position, color col)
setVoxel turns a particular voxel a particular color. The position PVector is represents an (x,y,z) point, and the function worries about rounding the co-ordinates off to an integer value. If the voxel is outside the display volume, the function just ignores it. This function is the building block of all the other graphics that we'll look at, so it's good to get familiar with it.
Here's the rest of the code, line-by-line:
import L3D.*;

L3D cube;       //define a cube object to draw into
PVector voxel=new PVector(3,3,3);  //this is the voxel that we'll blink.  The voxels range from (0,0,0) to (7,7,7)
Start by importing the library and defining an L3D object, cube. Cube holds all the volumetric data for the LED cube, handles drawing the cube graphics in simulation, and can also stream data over wifi to L3D cubes on the local network.
void setup(){
  size(displayWidth, displayHeight, P3D);
  cube=new L3D(this);    //initialize the cube object
  cube.enableDrawing();  //draw the virtual cube
  cube.enableMulticastStreaming();  //stream the data over UDP to any L3D cubes that are listening on the local network
  cube.enablePoseCube();  //automatically centers the cube and allows the user to rotate it with the mouse
}
In setup(), we declare the graphics to be P3D graphics. That's important if we're going to draw the cube simulator -- all that is in 3D, and we have to set up our drawing context as something that can handle 3D graphics.
cube=new L3D(this); -- this creates a new L3D cube. By default, the cubes are 8x8x8 voxels
cube.enableDrawing(); -- this will draw the cube in the sketch window centered around the (0,0,0) point of the graphics context, at the end of the draw() function
cube.enableMulticastStreaming(); -- this takes all the cube data and sends it out as a UDP multicast packet to your whole local network. If you have an L3D cube set up to listen on your network, it will show whatever the screen is showing.
cube.enablePoseCube() positions the simulator's cube on the screen and lets you rotate the cube in 3D by dragging the mouse. If you don't call enablePoseCube, the library will draw the cube at the (0,0,0) point in your graphics context.
void draw(){
  background(0);                //set the screen's background to black
  cube.background(0);        //set all the voxels in the cube to black=
  if ((frameCount%20)>=10)    //turn the LED on for ten frames, then off for ten frames
    cube.setVoxel(voxel, color(255, 0, 0));

}
cube.background(0) sets all the voxels in the cube to black. If I wanted the background to be another color, I could specify it with another color datatype. If I wanted to turn the background green, I would write:
cube.background(color(0,255,0));
Next, I want to blink the voxel. Processing has a built-in counter called frameCount that increments every time I draw a frame. By default, a processing sketch updates the screen 60 times a second. The line
if ((frameCount%20)>=10)
sets the cube up to flash three times a second. I'm looking at frameCount modulo twenty, which will always have a value from 0-19. If frameCount%20 is less than 10, the if statement evaluates to false, and nothing happens -- the voxel stays black. If frameCount%20 is between 10 and 19, the code sets the voxel at (3,3,3) to red. frameCount%20 keeps looping around, and the voxel blinks off and on.
I know that's a lot, but don't sweat it if you don't get everything yet. Just pull open one of the examples from the Processing library and start tinkering with it. You'll pick it up quickly enough.
Walk That Line
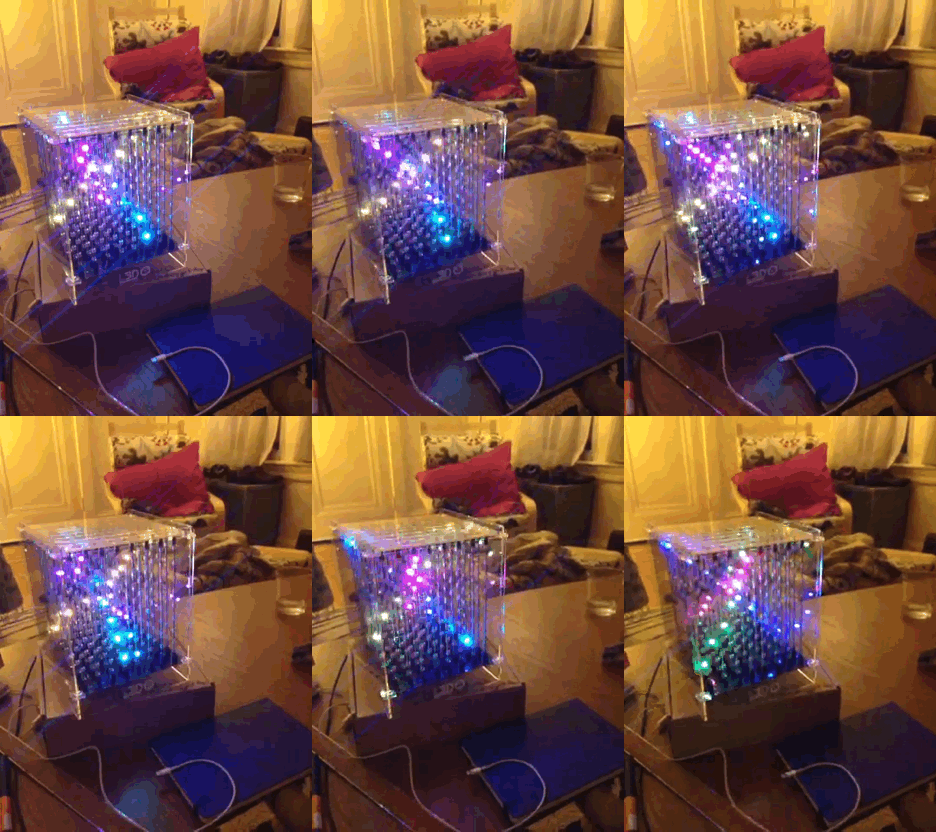
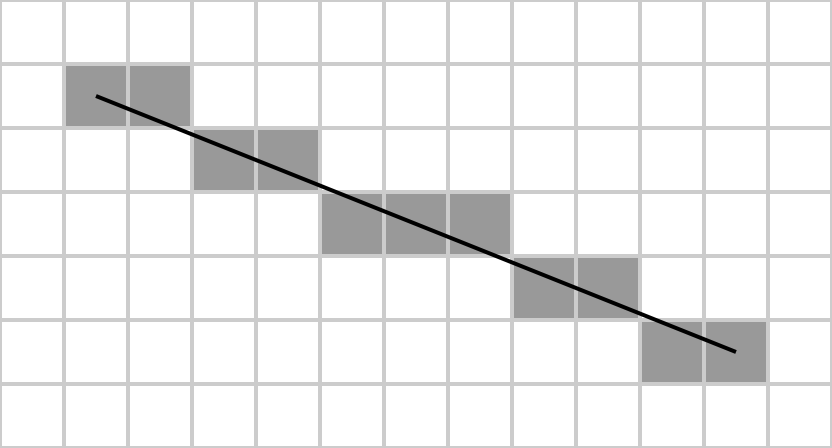
Drawing a single voxel is all well and good, but sometimes you want to draw more complex things. That's where the function
L3D.line(PVector start, PVector end, color col)
comes in handy. As the name implies, it draws a line from the start to the end points, and draws it in the specified color. If you like the way this line looks, you have Jack Bresenham to thank -- he wrote this nifty function called Bresenham's Line Algorithm that we use to draw almost every line in all computer graphics. The library uses a 3D implementation of Bresenham's algorithm to draw within the cube.
Take a look at the Line example in the library. Most of it is the same as we saw in the Blink example. The difference is in the draw() function:
void draw(){
  background(0);
  cube.background(0);

  for (float theta=0; theta<2*PI; theta+=PI/3)
  {
    PVector start=new PVector(cube.center.x+radius*cos(theta), 0, cube.center.z+radius*sin(theta));
    PVector end=new PVector(cube.center.x+radius*cos(theta+lineAngle), cube.side-1, cube.center.z+radius*sin(theta+lineAngle));
    color col=cube.colorMap(theta%(2*PI), 0, 2*PI);
    cube.line(start, end, col);
  }
  lineAngle+=.05;  //the cube library draws the cube at the end of the draw() function.
  //PoseCube() translates and rotates the graphics context to the right angle to display the cube.
  //The displayed cube will be centered about the graphics context's (0,0,0) point
  poseCube();
}
In this function, I'm drawing six lines. The start and end points of these lines are distributed in circles, parallel to the X-Z plane. I describe the start points on a circle with
X=cube.center.x+radius*cos(theta)
Z=cube.center.z+radius*sin(theta)
I lay out the end points at the other end of the cube, in a similar circle, but I "twist" the circle around the Y axis by an angular variable called lineAngle
X=cube.center.x+radius*cos(theta+lineAngle)
Z=cube.center.z+radius*sin(theta+lineAngle)
I then draw a line from each start point to each end point. If lineAngle is 0, these lines fall along the walls of a cylinder. Every frame, I increase lineAngle, and it's as if I'm twisting the start circle relative to the end circle. Once lineAngle gets to a multiple of 2*PI, everything is untwisted, and the cycle starts again.
One other function to highlight here: colorMap
colorMap is built in to the L3D library. It takes in three parameters:
color L3D.colorMap(float value, float min, float max)
It returns a color of the rainbow, based on where value falls in the range from min to max. This is an easy way to add splashes of color to a program.
Graphing
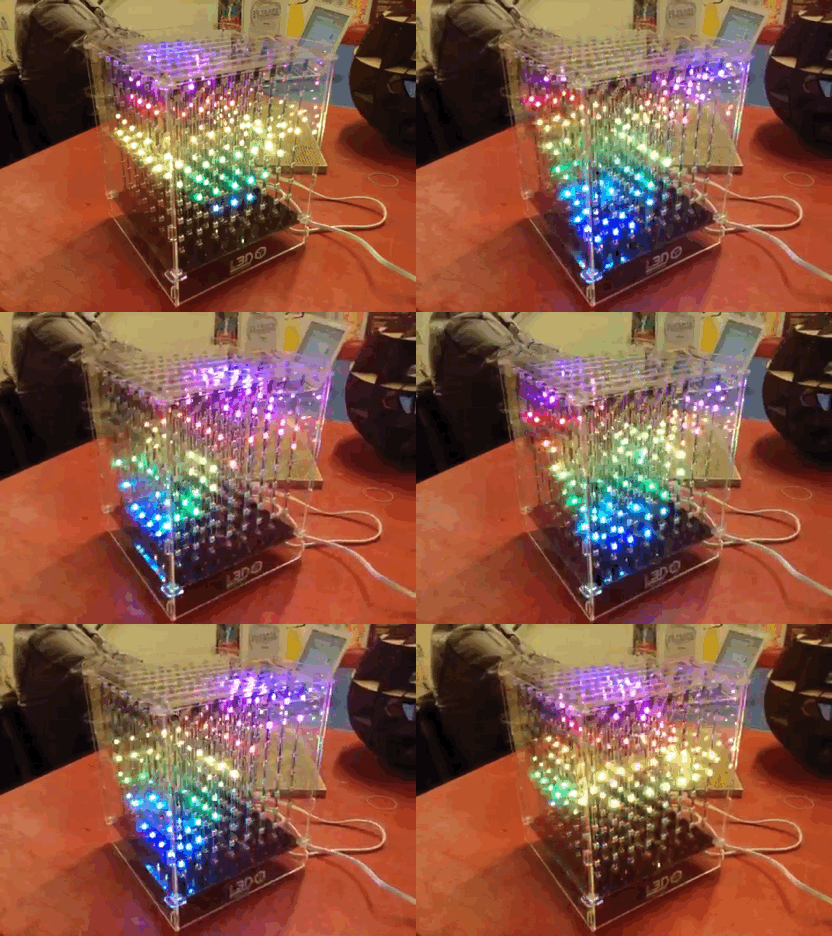
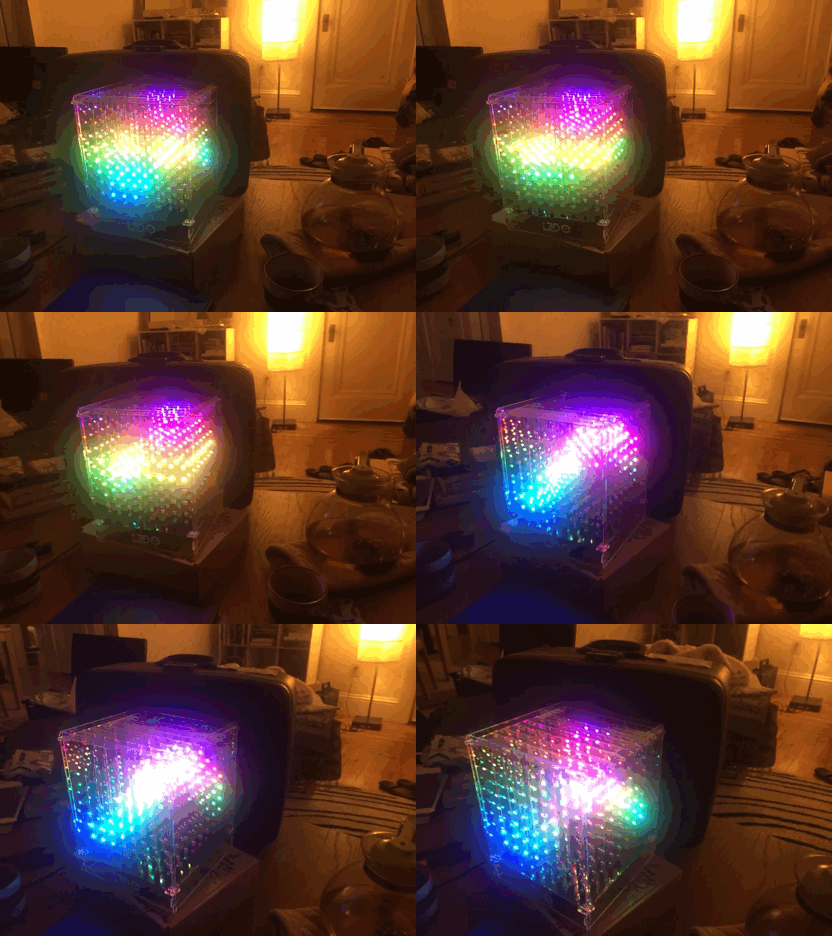
You can graph in a cube, just like you would in a graphing calculator.
The best way to graph is to loop across all the points in the X-Z plane, calculate a function value y as a function of x and z, and set the voxel at the (x,y,z). Take a look at the example below:
float xScale=0.5;
float zScale=0.3;


for (float x=0; x<cube.side;x++)
 for (float z=0; z<cube.side; z++)
 {
    float y=map(sin(xScale*x+offset)*cos(zScale*z+offset), -1, 1, 0, cube.side);
    PVector point=new PVector(x, y, z);
    cube.setVoxel(point, cube.colorMap(y, 0, cube.side));
 }
This function draws the 3D sinusoidal shape seen in the animated gif. I calculate a value of a function, f(x,y)=sin(xScale*x+offset)*cos(zScale*z+offset), and then, to make things easy on myself, I use Processing's built-in function map to map function values between -1 and 1 into y values between 0 and 7. Once I have the y value, I just use setVoxel to color in that voxel.
There are a bunch of other 3D functions in the Graphs example in the processing library. Take a gander!
Viva La Musica Pop
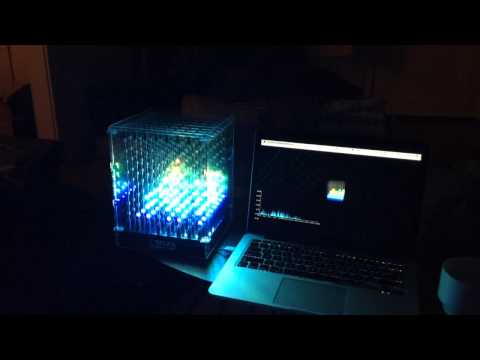
My favorite thing to do with cubes is to make them respond to the real world. Music is particularly cool. In the Musical Landscapes example in the library, I use the minim audio library to compute a fast fourier transform from the microphone audio. This gives me a frequency spectrum, that looks a bit like a mountainous landscape. I wrote some code to continuously draw the frequency spectrum to the cube, scrolling older data backwards along the z axis. Check out the video above, or try it on your own computer.
3D Primitives: Spheres
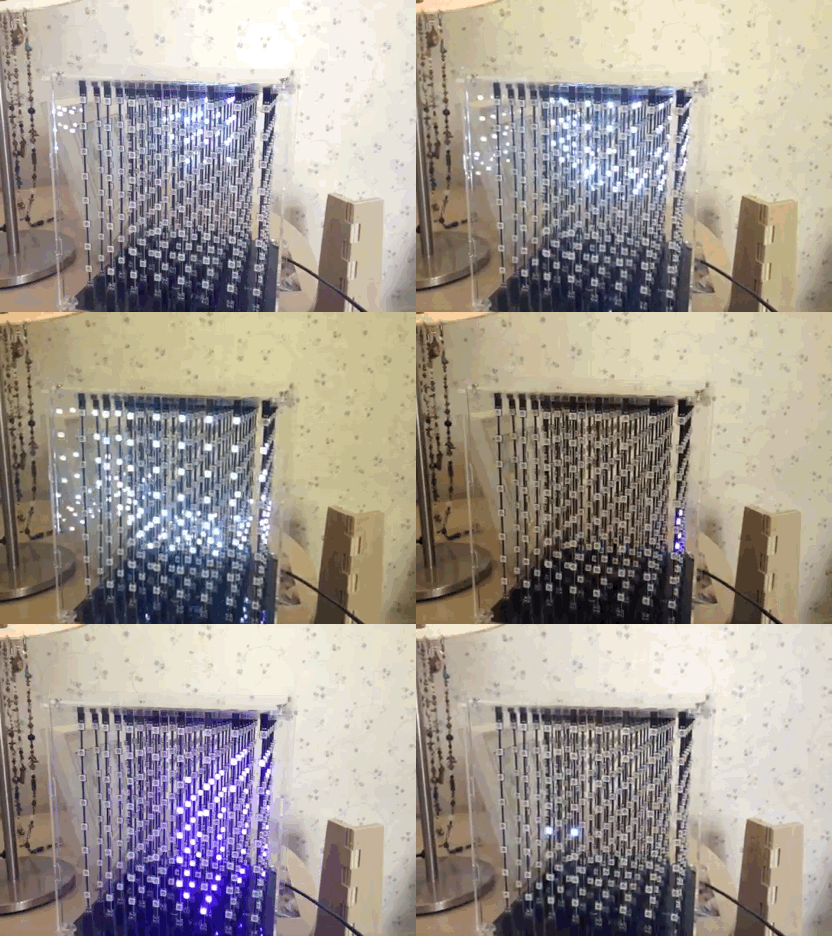
So let's look at drawing some actual solid shapes. A sphere is a good place to start. Let's say that we want to draw a sphere with radius r, centered on point p.
One thing I've noticed with cube graphics -- solid spheres don't actually look very good -- with most graphics, you want to draw the surface, but leave the inside empty. If you fill the entire shape, you'll get a very bright blob, but it doesn't add any additional information about the shape. Resolution is very limited in cubes, so I try to keep the LEDs to the minimum that I need and focus on conveying the shape information.
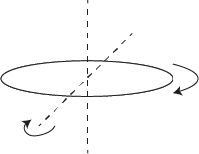
Drawing in a cube is similar to the processes I use to draw in CAD. I'd start by drawing a circular cross-section of LEDs, and then revolve that cross section around an axis to create a sphere. To draw a circle, I could write a simple loop like:
for(float angle=0;angle<2*PI;angle+=.1)

	setVoxel(p.x + radius*cos(angle), p.y + radius * sin(angle), p.z, color(255));
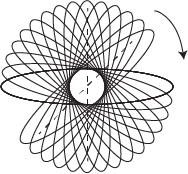
To spin that circle, I would nest the circle loop inside another loop, like so:
for(float phi=0;phi<PI;phi+=0.1)
   for(float angle=0;angle<2*PI;angle+=.1)
	setVoxel(p.x + radius*cos(angle)*sin(phi), p.y + radius * sin(angle) * sin(phi), p.z + r*cos(phi), color(255));
Bada bing bada boom, I have a sphere!
Of course, this is built into the library. Instead of writing this loop yourself, you can just call
L3D.sphere(PVector center, float radius, color col)
and the object will take care of drawing a sphere into the cube.
For more info, check out the Spheres example in the library, which is what generated the animated gif above.
3D Primitives: Cubes

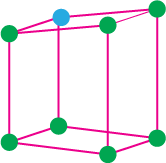
Drawing a cube follows a similar logic to the sphere.
The outline of a cube has eight corners, with twelve edges connecting those corners. Just like the sphere, I'm not going to fill in the inside of the sphere, but rather, just draw the edges and vertices. To know where to put the cube, I need to know the position of one of the vertices and the edge length. I'm going to base all the positions off of the top back left vertex (shown in cyan in the image above)
  PVector[] topPoints=new PVector[4];
  PVector[] bottomPoints=new PVector[4];
  topPoints[0]=topLeft;
  topPoints[1]=new PVector(topLeft.x+side, topLeft.y, topLeft.z);
  topPoints[2]=new PVector(topLeft.x+side, topLeft.y+side, topLeft.z);
  topPoints[3]=new PVector(topLeft.x, topLeft.y+side, topLeft.z);
  PVector bottomLeft=new PVector(topLeft.x, topLeft.y, topLeft.z+side);
  bottomPoints[0]=bottomLeft;
  bottomPoints[1]=new PVector(bottomLeft.x+side, bottomLeft.y, bottomLeft.z);
  bottomPoints[2]=new PVector(bottomLeft.x+side, bottomLeft.y+side, bottomLeft.z);
  bottomPoints[3]=new PVector(bottomLeft.x, bottomLeft.y+side, bottomLeft.z);

//draw the twelve edges of the cube
  for (int i=0; i<4; i++)
  {
    drawLine(topPoints[i], bottomPoints[i], col);
    drawLine(topPoints[i], topPoints[(i+1)%4], col);
    drawLine(bottomPoints[i], bottomPoints[(i+1)%4], col);
  }

//now draw the vertices.  I think that it looks nice to make these in a different color than the edges.
  for (int i=0; i<4; i++)
  {
    cube.setVoxel(topPoints[i], color(255,0,0));
    cube.setVoxel(bottomPoints[i], color(255,0,0));
  }
The complete function and working code are in the Cubes example in the processing library.
Drawing, Saving and Sharing Volumetric Graphics (without Programming)
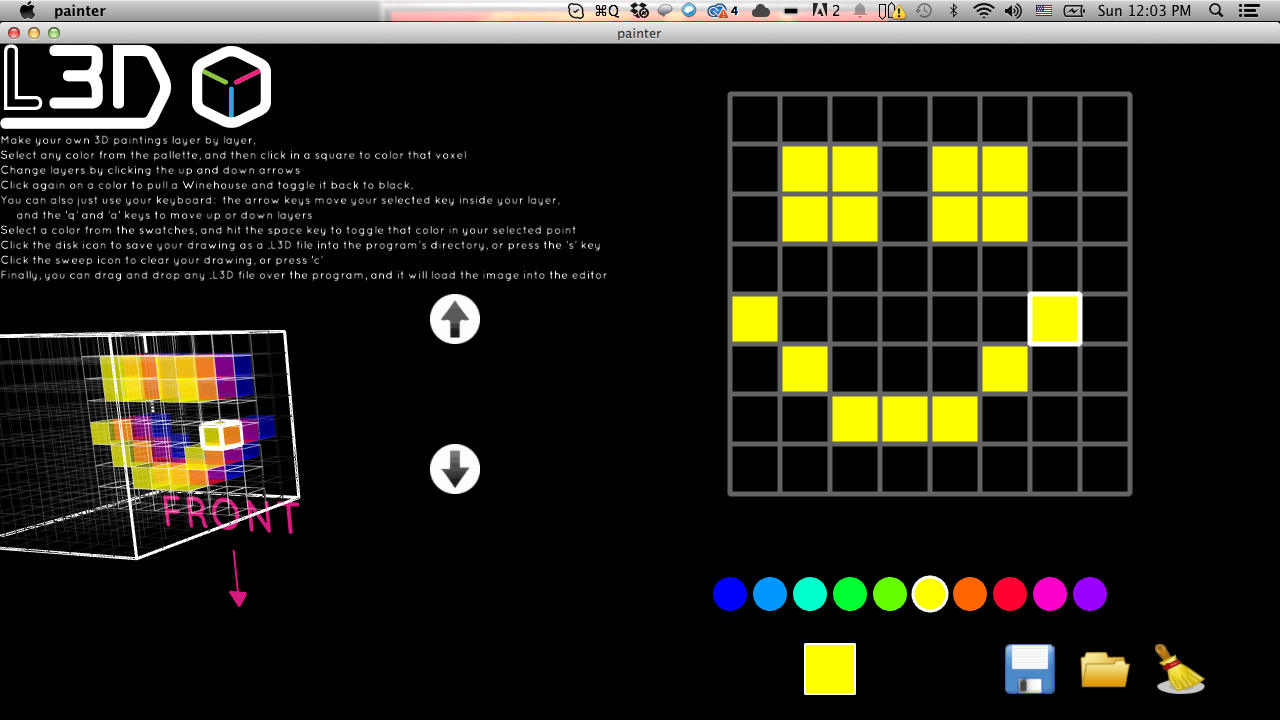
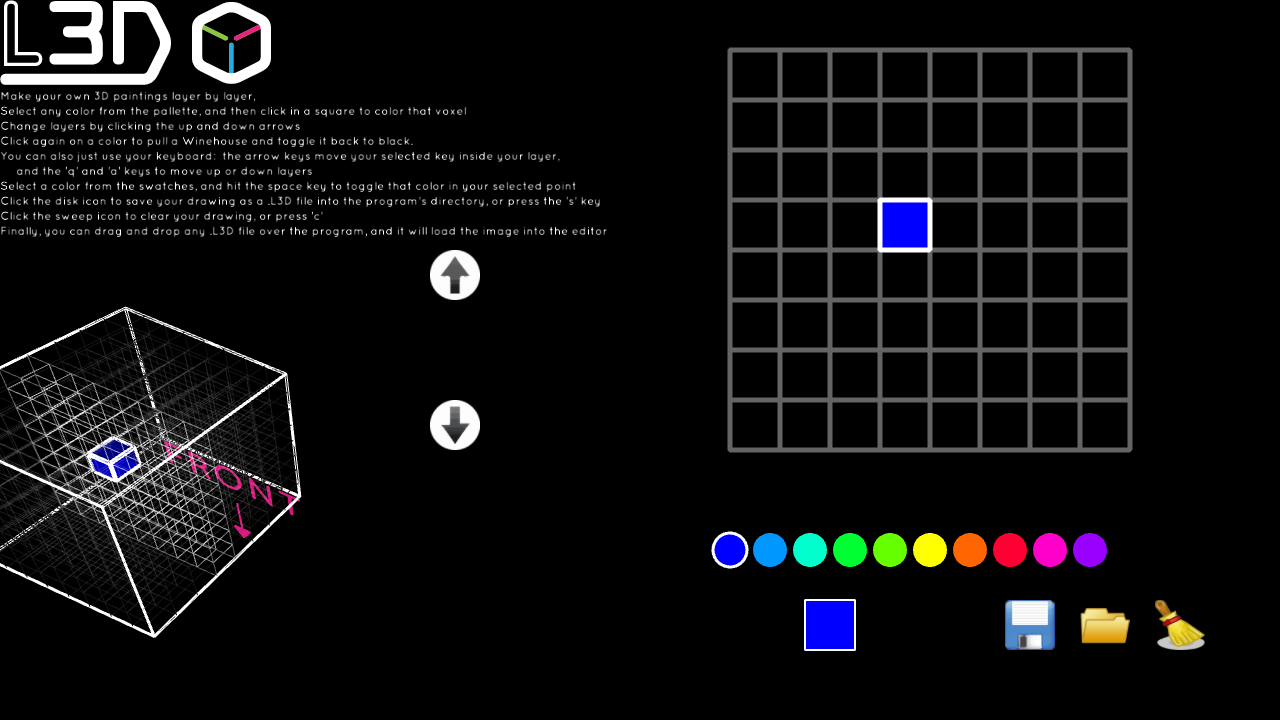
Sometimes code doesn't float my boat. Semicolons are nice, but when the feeling hits me, I've just got to go freehand, you know? Fortunately, volumetric fans have been making just the right tool, called a voxel editor, that lets me draw inside a volume, layer by layer.
We wrote our own voxel editor for LED cubes (it's called Space Painter, and it's one of the examples included with the Processing library). In Space Painter, each layer in the cube is represented as an two-dimensional 8x8 grid, which represents a plane along the X-Z axes. You move within the grid, setting the color of spaces in the grid to draw in that layer. You move between layers to move along the Y axis of the cube.
Sometimes, I want to save my drawings for later, so we developed a file format for volumetric data called the L3D format. For anyone interested, the details of the format are available here. Space Painter has the ability to save or load drawings.
We'd love to extend this format to include volumetric animations. If anyone is interested in working with us on this, take a crack and send us a pull request on github.
To the Future
For those of you who are interested in making your own cubes, that's awesome! We built our software to run on our own cubes, which are based around the open-source spark core processor and the popular WS2812 LED. All of our hardware and software is open-source and available on github, for anyone to download or build off of. If you make something cool based on our work, let us know!
If you don't have a cube, but want to get started drawing, you can draw for free with the cube simulator in our Processing library. We developed a streaming format to send the data from processing sketches to our cubes over wifi, and that could be easily extended to other hardware and firmware, if you have a certain cube and you want to write code. Even if you don't use our library, the concepts I described in this instructable will work for any kind of 3D display.
Finally, as a shameless plug, we just launched our own LED cube on kickstarter. If you're excited in cubes and want an awesome cube to work with, go check it out!
<3 Happy Hacking <3,
Alex