Home Appliance Raspberry PI Based Power Monitor
by MikeKulls in Circuits > Raspberry Pi
2302 Views, 5 Favorites, 0 Comments
Home Appliance Raspberry PI Based Power Monitor
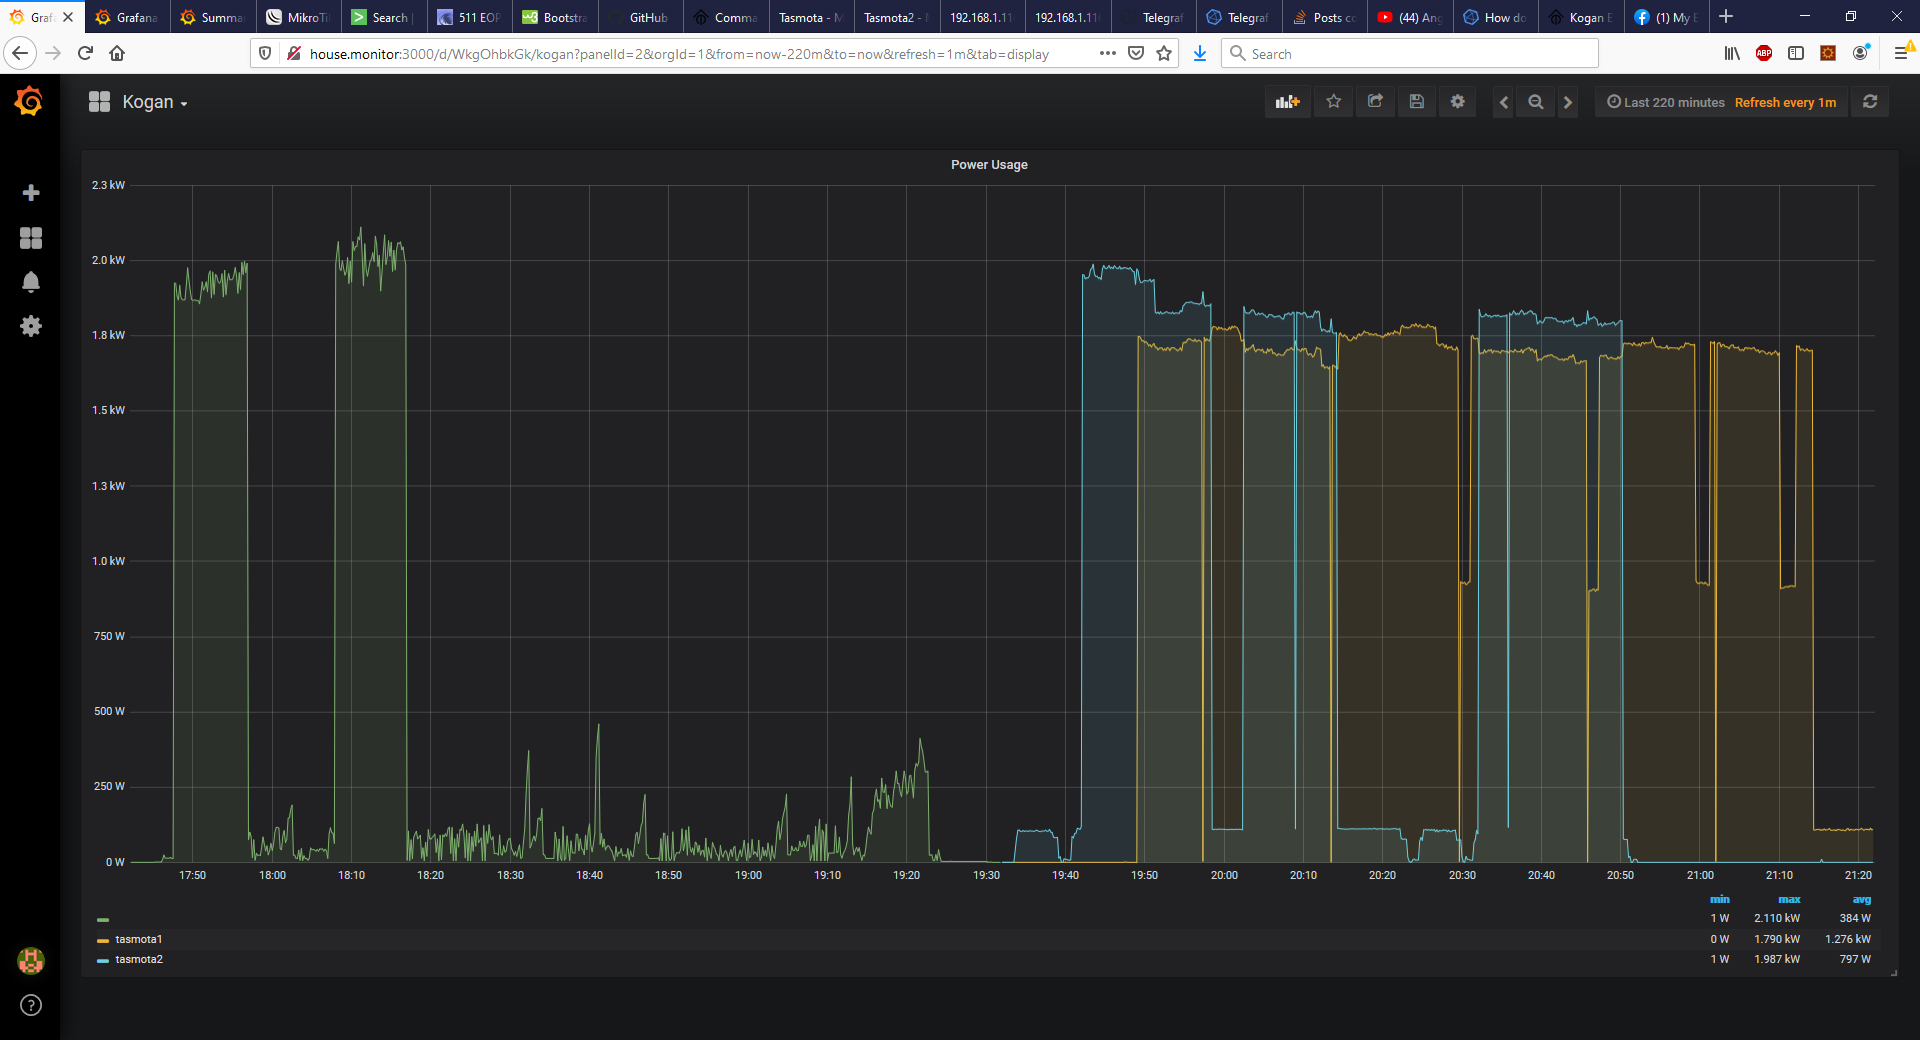
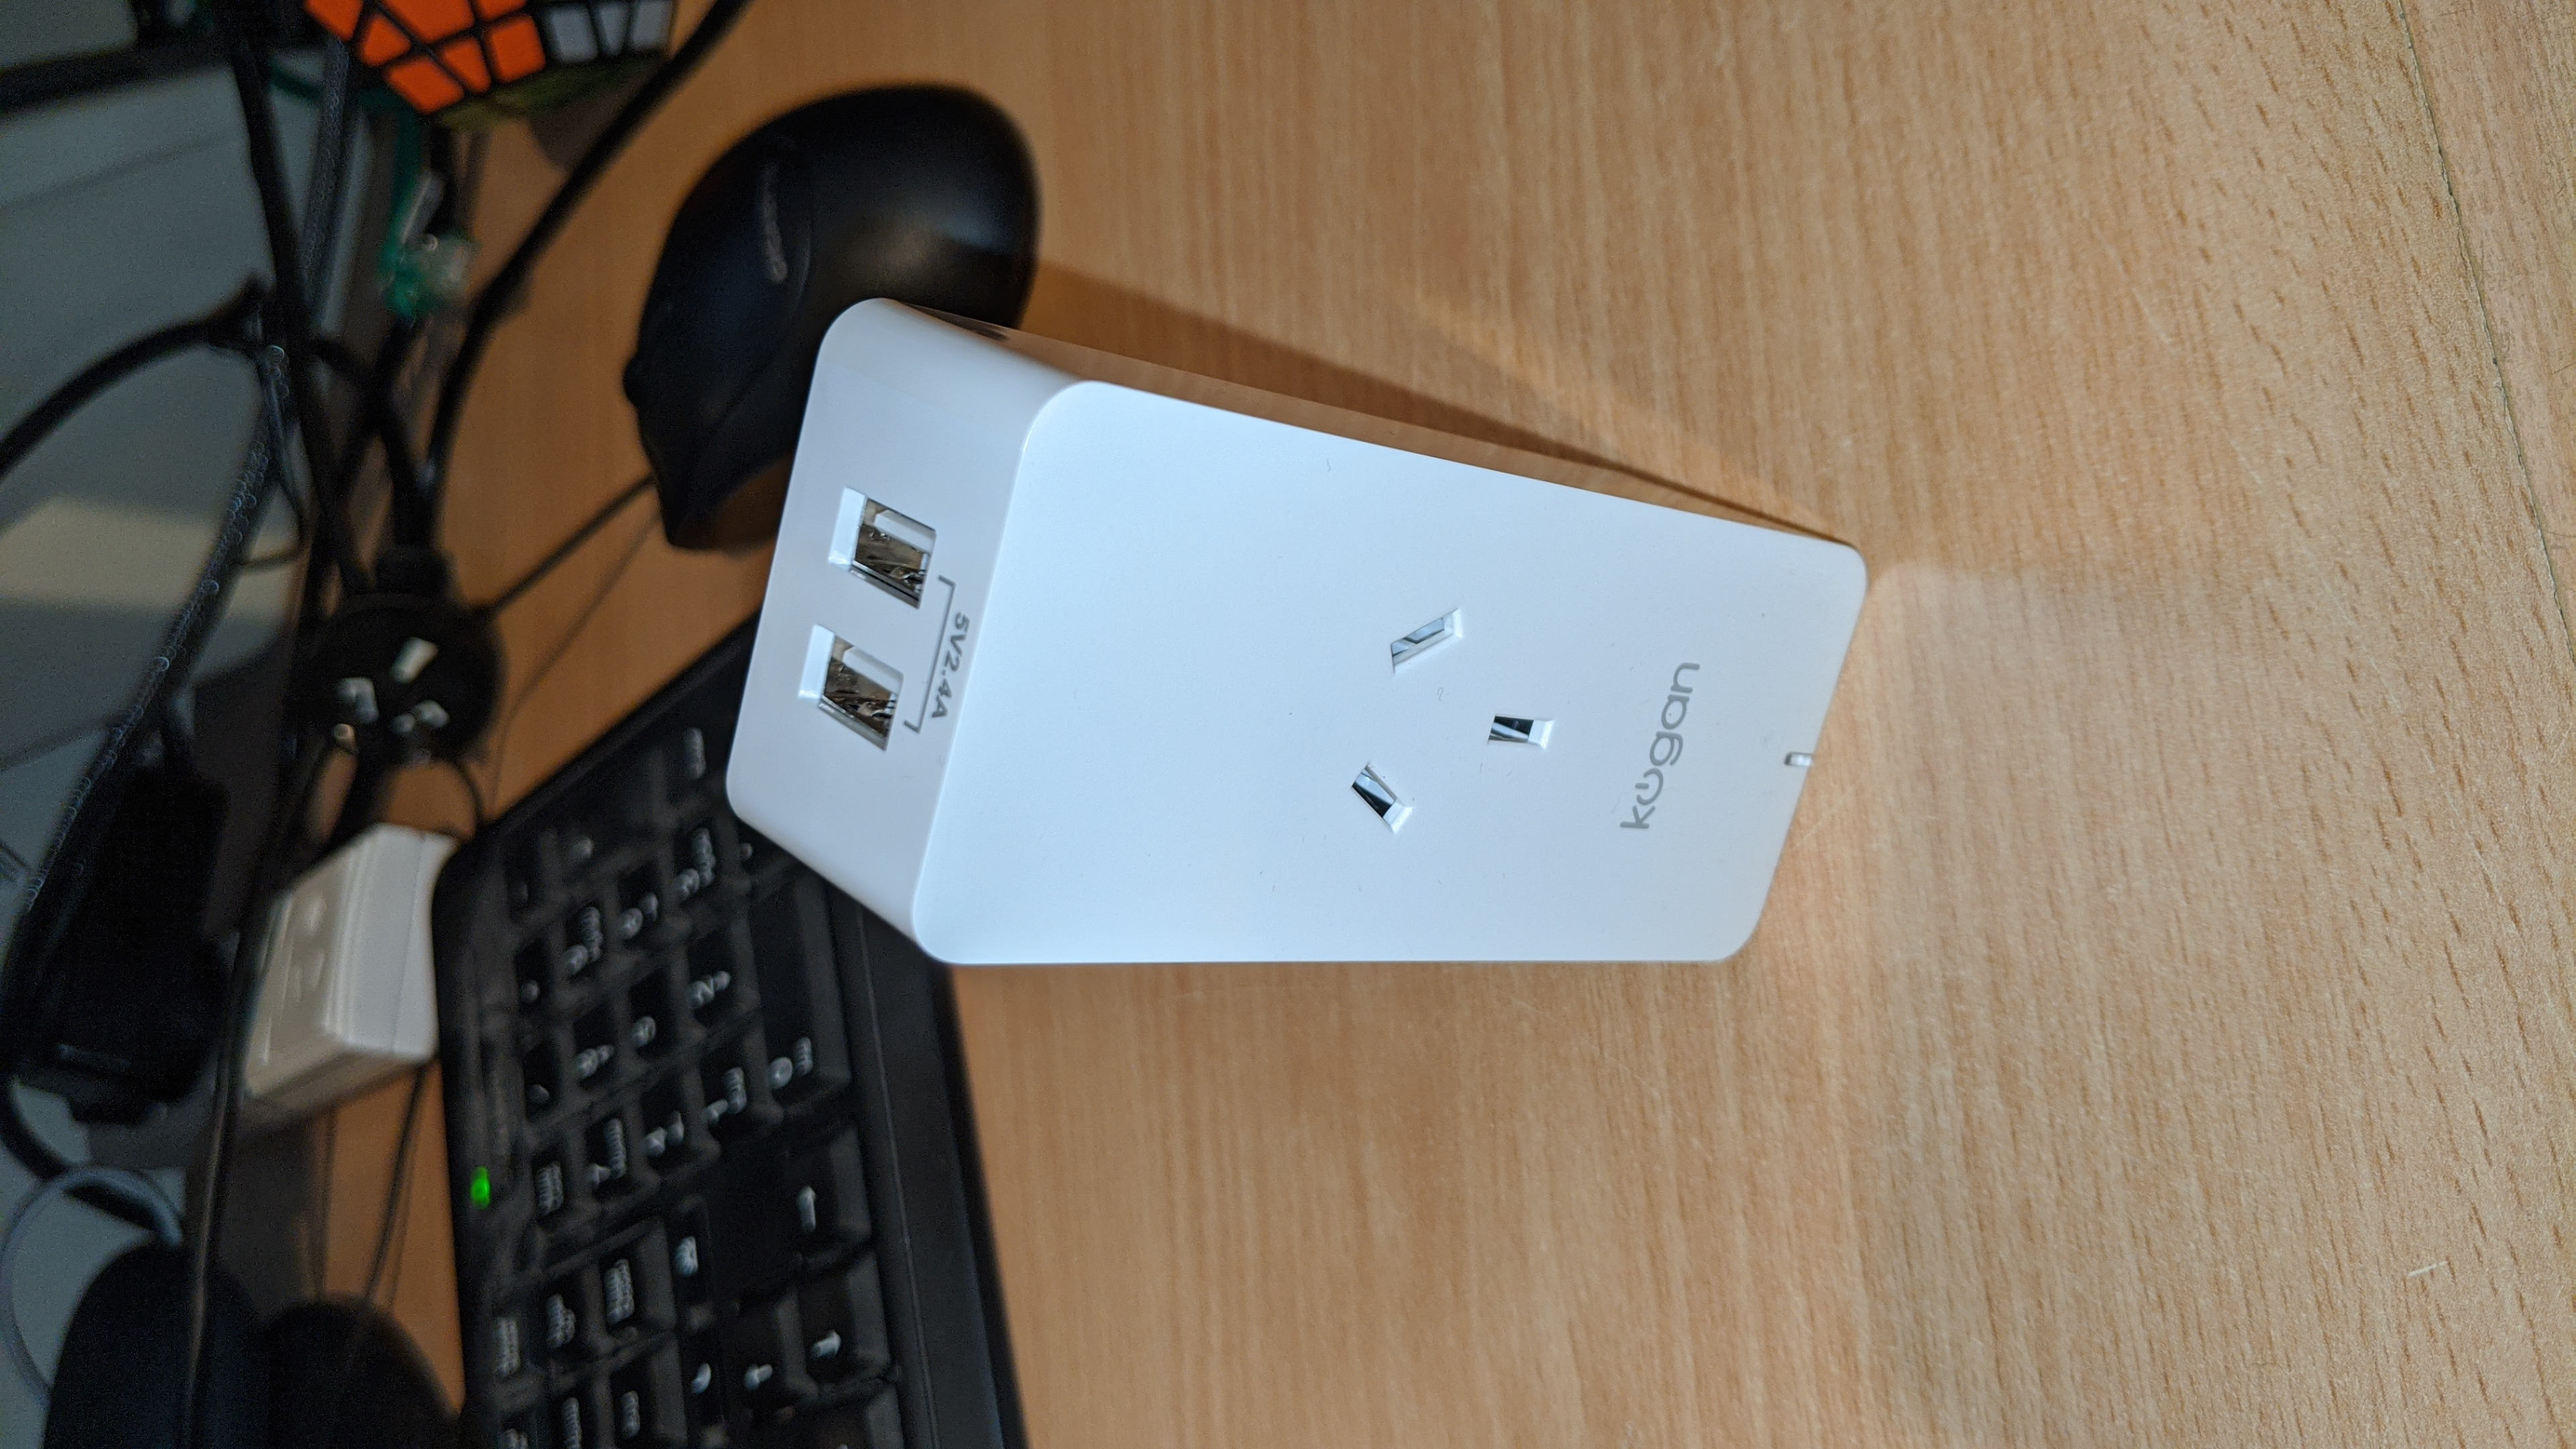
This was a small project I did to monitor the power usage of individual appliances around the house and display graphs of their power usage over time. It's actually one of the easier Raspberry PI based projects I've done, no soldering or hacking open products required. It doesn't have to be a Raspberry PI project, it could easily be done on a Linux box or maybe Windows.
The cost is $50 AUD for the a set of 4 of the power monitor/smart plugs and the cost of a Raspberry PI. This can run on a Pi Zero or the Original PI although I found it was a bit slow. The only other PI I have is a PI 3 and I found it very snappy, so that's what I would recommend. Note if you want to run it on an older PI you could reduce the frequency of data collection (I was using 10 seconds).
This project also has the added benefit or freeing the smart plug from the manufacturers firmware, so you don't have to use their specific apps and cloud services. So they can be used with Home Assist or just with your own python scripts.
Please note I am assuming you know how to install the OS on the PI, connect to it and run some basic linux commands. I'm also assuming you know how to find the IP address of your smart plug once it connects to your WiFi.
Supplies
2 pack or 4 pack of smart plugs from here:
https://www.kogan.com/au/buy/kogan-smarterhome-sma...
1 Raspberry PI
Skills:
Ability to setup a raspberry PI
Basic linux command line
Text editor like vi or nano (nano is more user friendly, vi is faster once you get to know it)
Ability to find IP of devices on your network.
Buy Some Smart Plugs

The smart plug I used was from here:
https://www.kogan.com/au/buy/kogan-smarterhome-sma...
Note that there are a whole range of smart plugs that are compatible, most (all?) are ESP8266 (WEMOS) based devices and are very easy to flash. Make sure to get something that has power monitoring as many don't. This page shows a large list of compatible devices:
Flashing the Device
This part was surprisingly easy. You basically just download the software, run it and it steps you through.
For this you will need a Raspberry PI or Linux box with WiFi. You will need to have your primary connection to this device NOT being the WiFi. For my PI3 this was easy as I was connected via Ethernet. If you have a PI Zero then you'll have to connect the old fashioned way, with a keyboard and monitor.
I am assuming you know how to setup a PI and connect to it with SSH or a keyboard so I won't be going through that. If you're unsure there are plenty of tutorials on the web.
Before we start, just a bit of background on the devices. There is a company in China called Tuya that pumps out smart plugs for different customers. They make customization for different customers and provide a default firmware and allow companies to make their own modifications. The problem with this is if you have a bunch of products from different vendors then you end up having to run a bunch of apps, some of which work better than others. By flashing an open source firmware you free yourself from all of that. So this is good for general home automation.
So .... without further ado, here are the instructions:
1) Run these commands on the PI, this will install the required software.
# git clone https://github.com/ct-Open-Source/tuya-convert
# cd tuya-convert
# ./install_prereq.sh
2) Plug the smart plug into power
3) Power it on with the button
4) Hold the power button in until the blue light starts flashing
5) Wait 10 seconds. This isn't essential but I found it worked better if you did.
6) Run this command
./start_flash.sh
From here you just follow the prompts except at the end select "2. Tasmota". There is an option for a different firmware but I have not tried that so am not sure what it's like.
Note that I had to do this more than once, at first I thought I had bricked the device, I had no lights, no relay click, no signs of life. But I powered it down and run the last command again and it worked. I had to do this with 3 out of the 4 devices I flashed, only one went straight through, I think due to step 5.
Full instructions here:
Connecting to the Firmware for the First Time
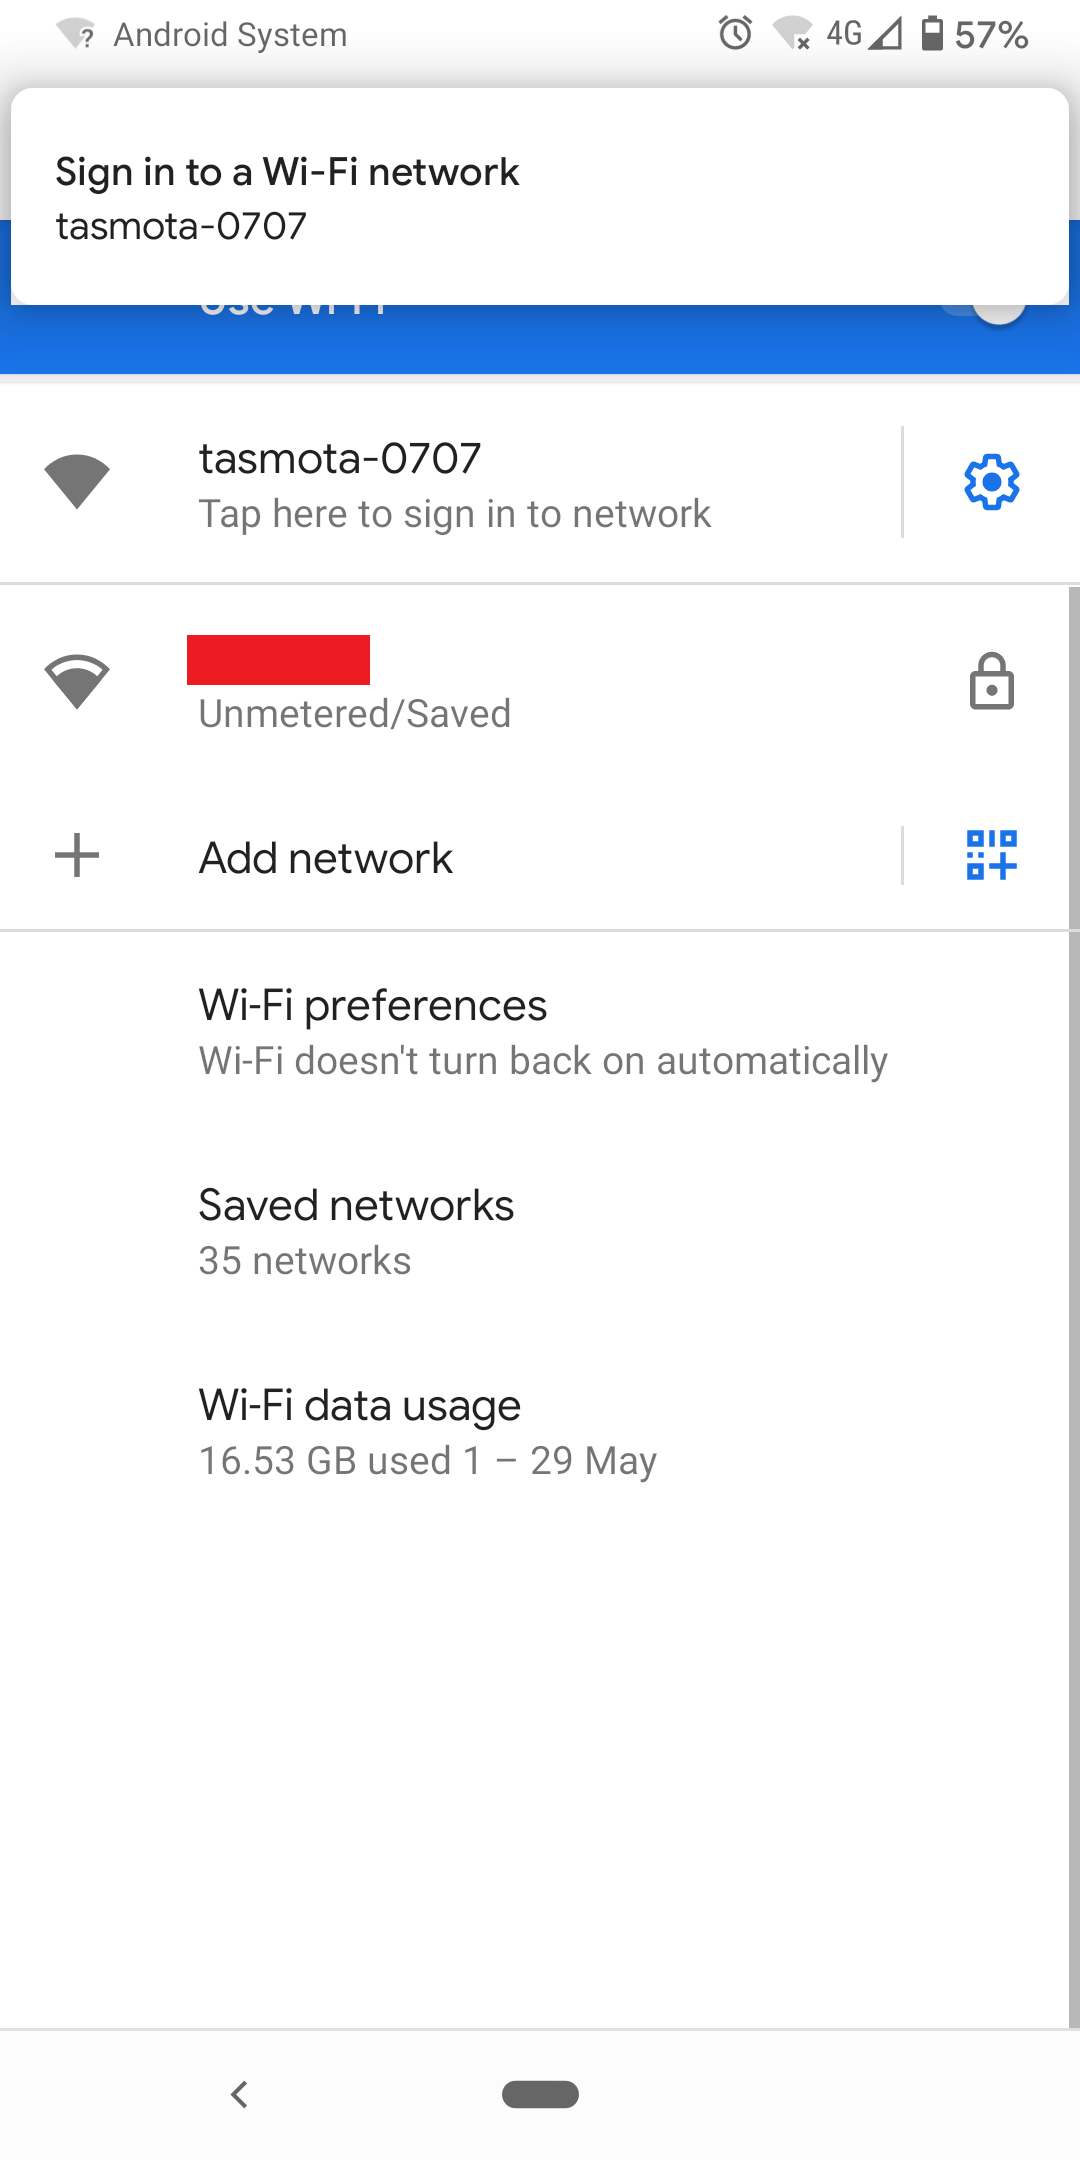
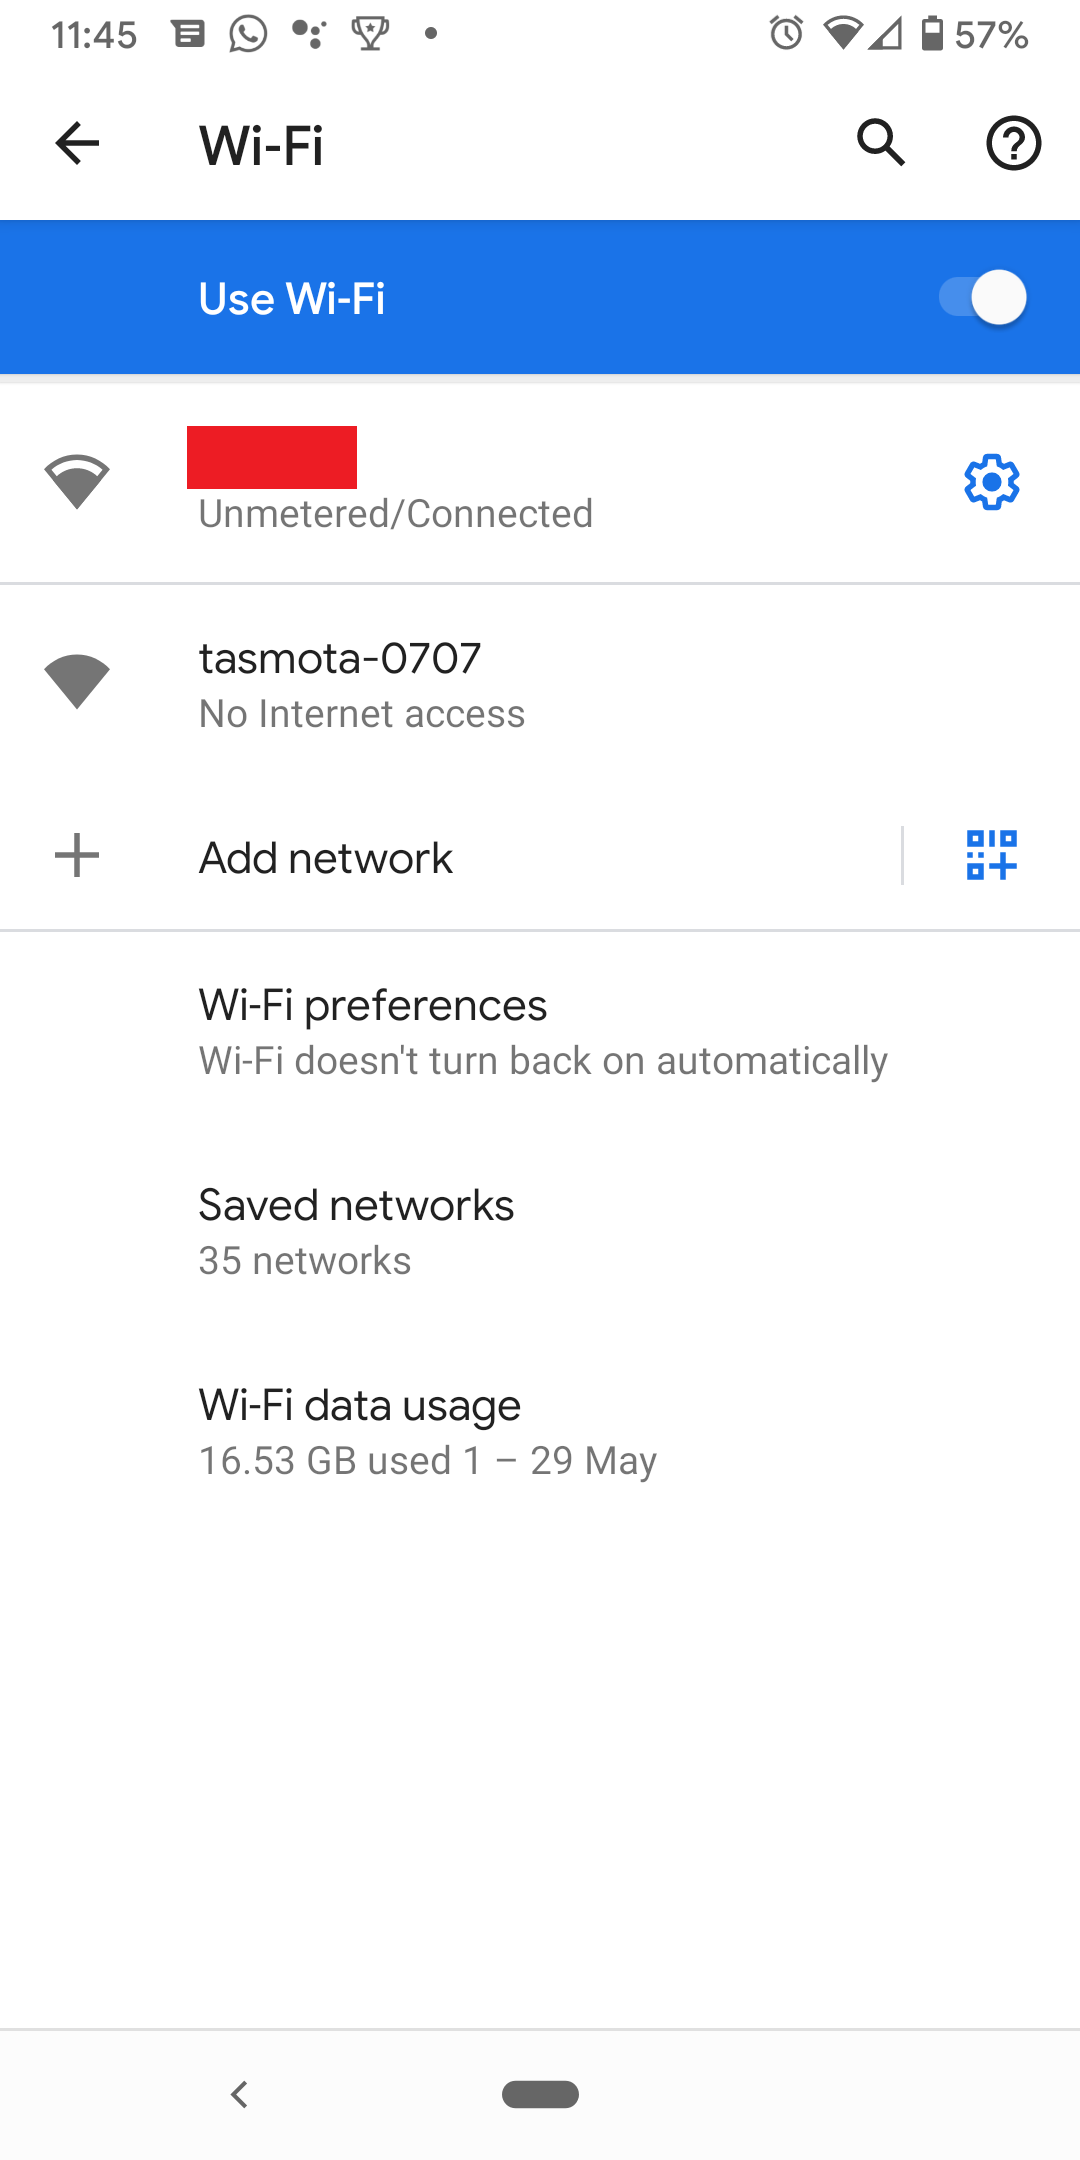
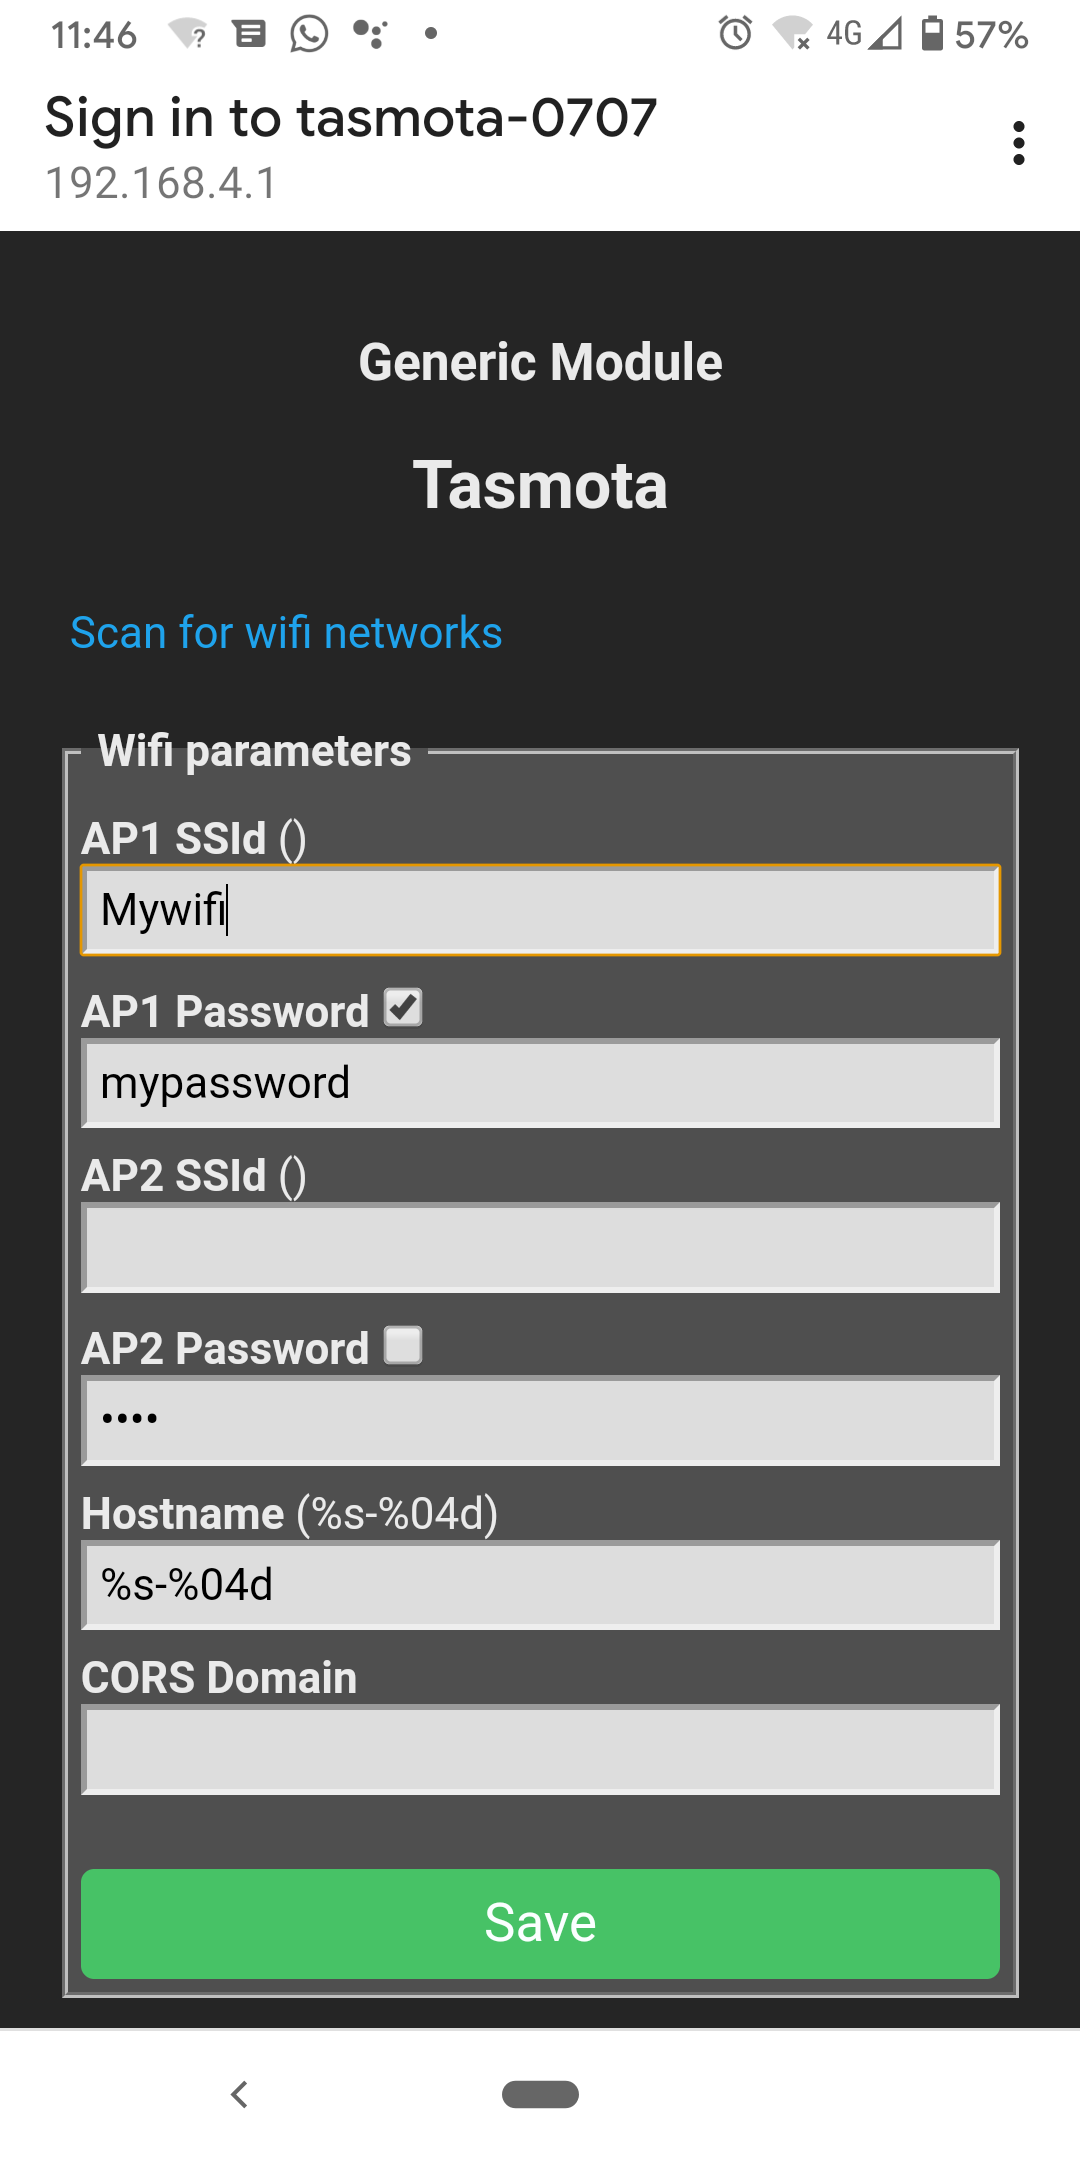
Once you flashed tasmota on to the device it won't show much signs of life. The reason for this is that it needs to be configured. Doing this is fairly easy, I found it best to do it with my phone. Steps are:
1) Search for WiFi access points
2) Connect to the one labelled tasmota_xxxx (where x is numbers)
3) The phone should direct you to the default page, if not go to 192.168.4.1
Note on some phones it may give you a message saying "no internet access, do you want to stay connected", select yes.
4) On the page it brings up enter the name of your WiFi network and the password in the first 2 boxes. Click the option to show password and triple check you've entered the right password. If you've entered the wrong password I believe it can be difficult to get back to this config screen. Note you can also scan for WiFi networks, although you obviously still need to enter the password.
5) The plug should now have connected to your WiFi network. You will need to go to the config page for your router and find the IP of your device.
6) Open a web browser on your PC and go to http://[device_ip] You should see the config screen from Tasmota.
Congratulations, you've successfully flashed the plug.
Configuring the Plug
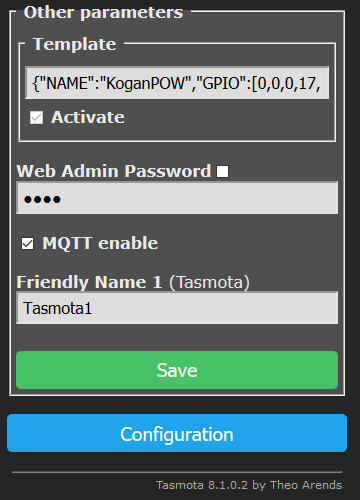
The company that makes these devices apparently makes 10,000 devices with many different configs. We've just flashed a new firmware and the firmware doesn't know what devices it's been flashed onto. So before anything will work we will need to configure it. To do it we need to find the details of our device on the web and load that particular config.
For this, find your device on this page:
https://templates.blakadder.com/plug.html
For the device I used, the config is here:
https://templates.blakadder.com/kogan-KASPEMHUSBA....
To set the config we just copy the text under Template. In this case it is:
{"NAME":"KoganPOW","GPIO":[0,0,0,17,134,132,0,0,131,56,21,0,0],"FLAG":0,"BASE":52}
Then
1) Go to your device config page http://[IP of smart plug]
2) Click configure, configure other
3) Paste in you template string
4) Tick "Enable MQTT"
5) Click activate and Save.
To test this has worked, click "Main menu" to go back to the home page and you should now see power usage figures. They will all be zero, even the voltage but this is a good sign. Click the toggle button and you should hear the relay click and see the voltage go up.
Calibrate Voltage
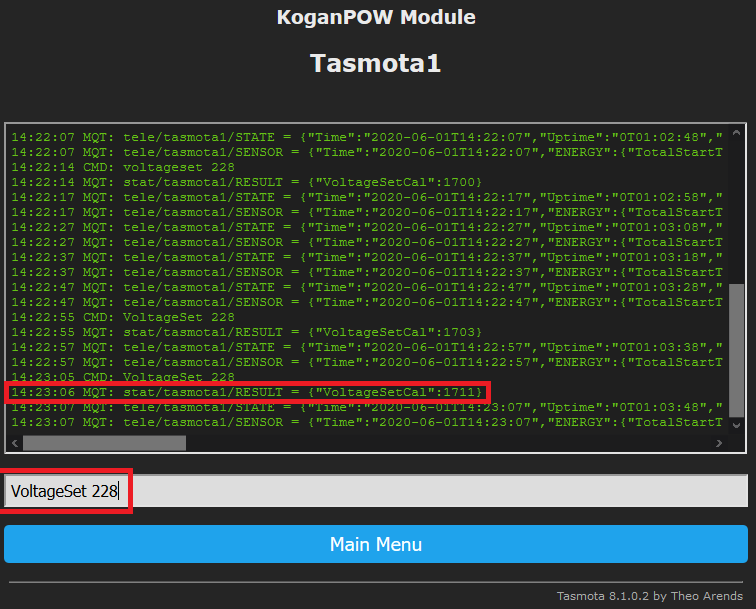
I found the voltage reading was showing quite high. If you have another source of voltage reading in the house (eg smart meter maybe??) then you can calibrate the plug very easily. To do this
1) Get the correct voltage reading
2) Turn the relay on in the smart plug
3) Click Console in the home page for the device
4) Enter the command "VoltageSet 228" and push enter (replace 228 with your voltage)
Voltage should now show correctly.
Installing Software on the PI
There's a few packages that need to be installed on the PI. These are easy to install and can be done following the instructions from the various packages. I'll give the instructions here but note they can change over time so my instructions will date. The packages are:
Grafana (for displaying graphs)
Influxdb (time series database that will store our data)
Telegraf (used to push data into Influxdb)
Mosquitto (message bus used to pass data around, the smart plug pushes the data here)
The chain of data flow is like this:
Smart Plug -> Mosquitto -> Telegraf -> InfluxDB -> Grafana
If you're asking why we can't skip Mosquitto and Telegraf, that is a good question. In theory the Smart Plug could push to Influx. The problem with that is that it would then have to be configurerable for 100s of different endpoints and it would lock us out of some choices. Most stuff in home automation uses Mosquitto to pass messages around. As an example, we can turn the plug on and off by sending messages to Mosquitto and the smart plug will receive them and respond.
Installing Grafana

From:
https://grafana.com/grafana/download?platform=arm
Or lots of other options here:
https://grafana.com/grafana/download
For Pi 1 and Pi Zero (ARMv6)
sudo apt-get install -y adduser libfontconfig1
#find the latest version from the page at the top
wget https://dl.grafana.com/oss/release/grafana-rpi_7....
sudo dpkg -i grafana-rpi_7.0.1_armhf.deb
sudo /bin/systemctl daemon-reload
sudo /bin/systemctl enable grafana-server
sudo /bin/systemctl start grafana-server
For newer PIs (ARMv7)
sudo apt-get install -y adduser libfontconfig1
#find the latest version from the page at the top
wget https://dl.grafana.com/oss/release/grafana_7.0.1_...
sudo dpkg -i grafana_7.0.1_armhf.deb
sudo /bin/systemctl daemon-reload
sudo /bin/systemctl enable grafana-server
sudo /bin/systemctl start grafana-server
To Test:
Go to http://[IP of PI]:3000
username/password is admin/admin, it will ask you to change it, you can skip for now
If you get a GUI then all good, move to next step
Installing InfluxDB
Run these commands on the PI:
curl -sL https://repos.influxdata.com/influxdb.key | sudo apt-key add -
source /etc/os-release
test $VERSION_ID = "7" && echo "deb https://repos.influxdata.com/debian wheezy stable" | sudo tee /etc/apt/sources.list.d/influxdb.list
test $VERSION_ID = "8" && echo "deb https://repos.influxdata.com/debian jessie stable" | sudo tee /etc/apt/sources.list.d/influxdb.list
test $VERSION_ID = "9" && echo "deb https://repos.influxdata.com/debian stretch stable" | sudo tee /etc/apt/sources.list.d/influxdb.list
test $VERSION_ID = "10" && echo "deb https://repos.influxdata.com/debian buster stable" | sudo tee /etc/apt/sources.list.d/influxdb.list
sudo apt-get update
sudo apt-get install influxdb
sudo systemctl enable influxdb
sudo systemctl start influxdb
Test by typing "influx". This should put you into the influxdb command line. Type "show databases", there will be no databases yet but if you get an empty list with no errors then all good.
Installing Telegraf
This one is really easy, because we added the influxdb repos we can just type:
sudo apt-get install telegraf
sudo systemctl enable telegraf
sudo systemctl start telegraf
At this point Telegraf will already be logging system metrics to influxdb. You can see them by typing these commands:
influx
show databases
use telegraf
show series
SELECT * FROM cpu LIMIT 10;
Install Mosquitto
This part is easy as we just install the default version that's packaged with raspian:
sudo apt-get -y install mosquitto
sudo apt-get -y install mosquitto-clients
sudo systemctl enable mosquitto
sudo systemctl start mosquitto
# create a password for mosquitto
sudo mosquitto_passwd -c /etc/mosquitto/tasmota tasmota
#enter a password. Write this password down as we will need to give this to smart plug
To Test:
run this in one SSH session:
mosquitto_sub -t test
Run this in another
mosquitto_pub -t test -m mymessage
You should see you message in the first SSH session
Sending Data From the Smart Plug to Mosquitto
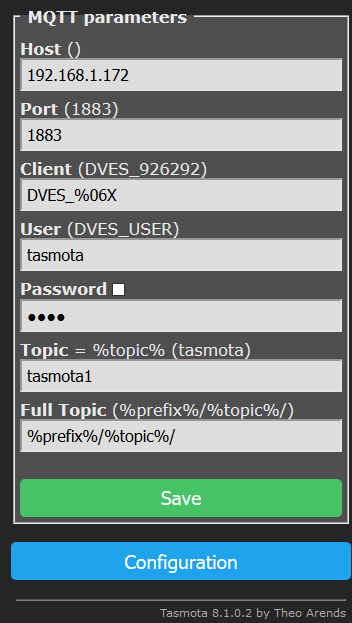
Now we have mosquitto running we need to configure the smart plug to send data to mosquitto. This is fairly easy to do. We will need the password entered for mosquitto from the previous step.
1) Log into your smart plugs web page
2) Click Configuration, then Configure Logging
3) Set telemetry period to 10 and click save.
4) Click Configure MQTT
5) For host enter the IP address of your PI
6) For username enter tasmota
7) For password enter the password from the previous step
8) For topic enter tasmota1
9) Click save
To test:
At the PI, type the below command. Within 10 seconds you should see data coming through.
mosquitto_sub -t tele/tasmota1/SENSOR
Data should look like this:
{"Time":"2020-06-01T13:24:37","ENERGY":{"TotalStartTime":"2020-06-01T13:16:40","Total":1.539,"Yesterday":0.000,"Today":1.539,"Period":0,"Power":1,"ApparentPower":12,"ReactivePower":12,"Factor":0.06,"Voltage":228,"Current":0.054}}
Use Telegraf to Push Data From Mosquitto to Influx
We are now going to configure Telegraf to read the data from mosquitto and push to influxdb. On the PI:
1) sudo mv /etc/telegraf/telegraf.conf /etc/telegraf/telegraf.conf.bak
2) sudo vi /etc/telegraf/telegraf.conf
Note vi isn't super friendly for new users, if you prefer a menu based text editor use nano instead:
sudo nano /etc/telegraf/telegraf.conf
3) Paste in the config from the attached file
4) sudo systemctl restart telegraf
To test type this on the PI:
influx
show databases
you should see the test database. If you don't like the name test you can change dest_db in the telegraf.conf file.
Downloads
Finally, Create Graphs in Grafana
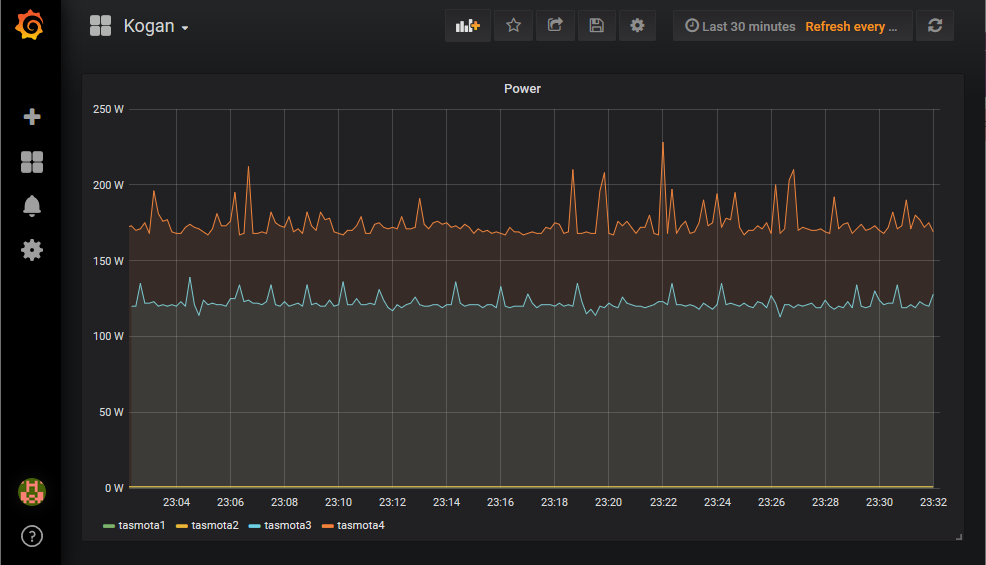
Finally we get to see some data :-) :-)
First we need to create a connection to the database. Go to the grafana web page http:[ip of PI]:3000
1) Login with admin/admin
2) In the left column click the gear icon and data sources
3) Click add data source
4) Click influxdb
5) For URL enter http://localhost:8086
6) For database enter test
7) For HTTP enter GET
8) For min time interval enter 10s
9) Click Save and Test, it should say "Datasource is working"
OK, now we have a connection to the database we can create a graph ... finally.
1) In the left column click the + and then Dashboard and Add New Panel
2) For database click InfluxDB
3) Click measurement and select Kogan
4) For field select Energy_Power.
5) For alias, give your series a name (eg Dishwasher)
6) On the right hand side for Panel Title give it a name, eg Power.
7) That's it, you should see data. Click the left arrow button to go out of edit and then click save, give your dashboard a name.
If you got this far, great work, seriously.
A Few More Tips
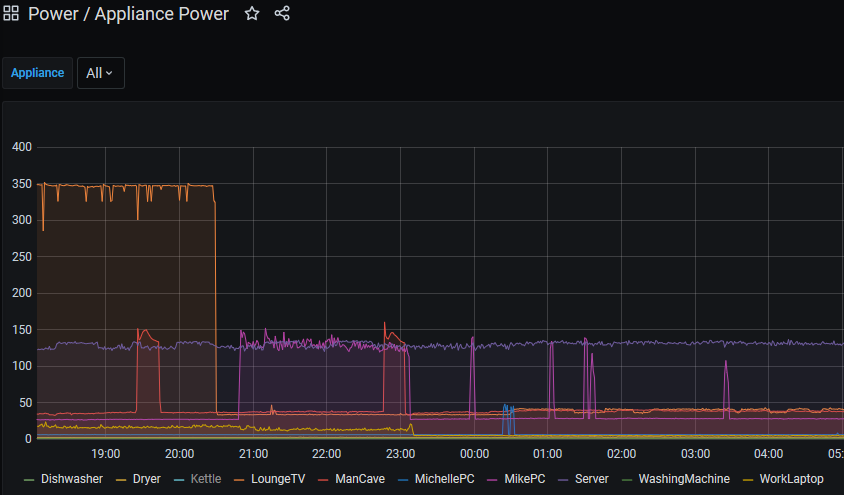
The default Telegraf config I provided was a bit maintenance intensive in that a new section needs to be added for each device and a restart of Telegraf needs to be done. With the changes below it makes things much more dynamic in that devices can be added or renamed in the Tasmota config without the need to change Telegraf.
The first change is to put the + in the topic name, this is basically a wildcard. This on its own would be enough except when you're making graphs in Grafana the devices come up named as things like "tele/WashingMachine/SENSOR". The second part of the Telegraf config below is the regex processor. It pulls the text "WashingMachine" out of the centre and turns it into a new tag that gets pushed to InfluxDB.
Note: make sure to set up a different topic name in the Tasmota config for each device.
[[inputs.mqtt_consumer]]
servers = ["tcp://127.0.0.1:1883"]
topics = [ "tele/+/SENSOR" ]
name_override = "kogan"
data_format = "json"
topic_tag = "topic"
[inputs.mqtt_consumer.tags]
dest_db = "test"
[[processors.regex]]
namepass = ["kogan"]
[[processors.regex.tags]]
key = "topic"
pattern = "^tele\\/(.*)\\/SENSOR$"
replacement = "$1"
result_key = "device"
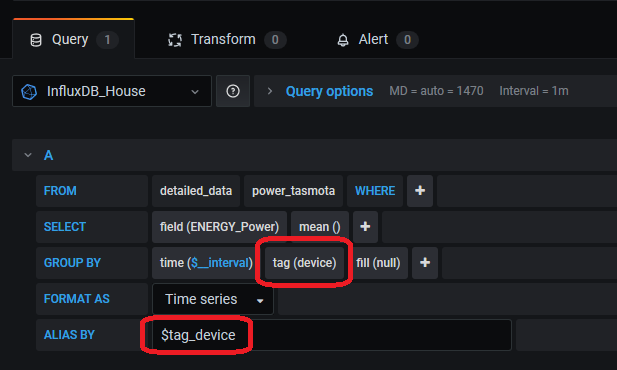
Once this is done it's very easy to configure Grafana to show multiple devices on the one graph. The pic attached to this step shows what needs to be done. Just click the + sign on the group by line and select tag(device). The down the bottom at Alias By enter $tag_device. You should now see multiple series on the one graph. You can click the text of each item to turn them on and off (ctrl click works to select multiples)