Flowmeter Calibration Introduction
by audreykoz in Workshop > Science
149 Views, 1 Favorites, 0 Comments
Flowmeter Calibration Introduction
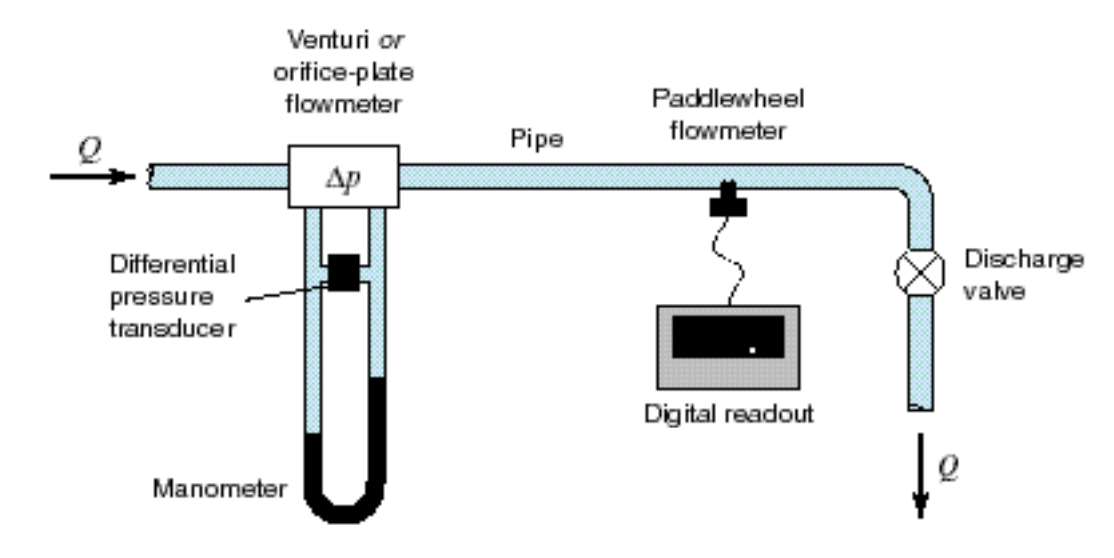
As seen in the above figure from the lab manual, check that the discharge valve on the is closed. Next, make sure that the levels of mercury in the manometer are at equal heights. Make sure that there is no air trapped in the supply lines.
Calibrate the Manometer Differential Pressure Transducer
As seen in the above figure from the lab manual, the manometer's differential pressure transducer is labeled as VF(pipe number) for each pipe and will need to be calibrated. Zero the transducer output, open the manometer bleed valve, and then take 5 recordings of the pressure, with each pressure recording increasing to the maximum pressure.
Acquire Data
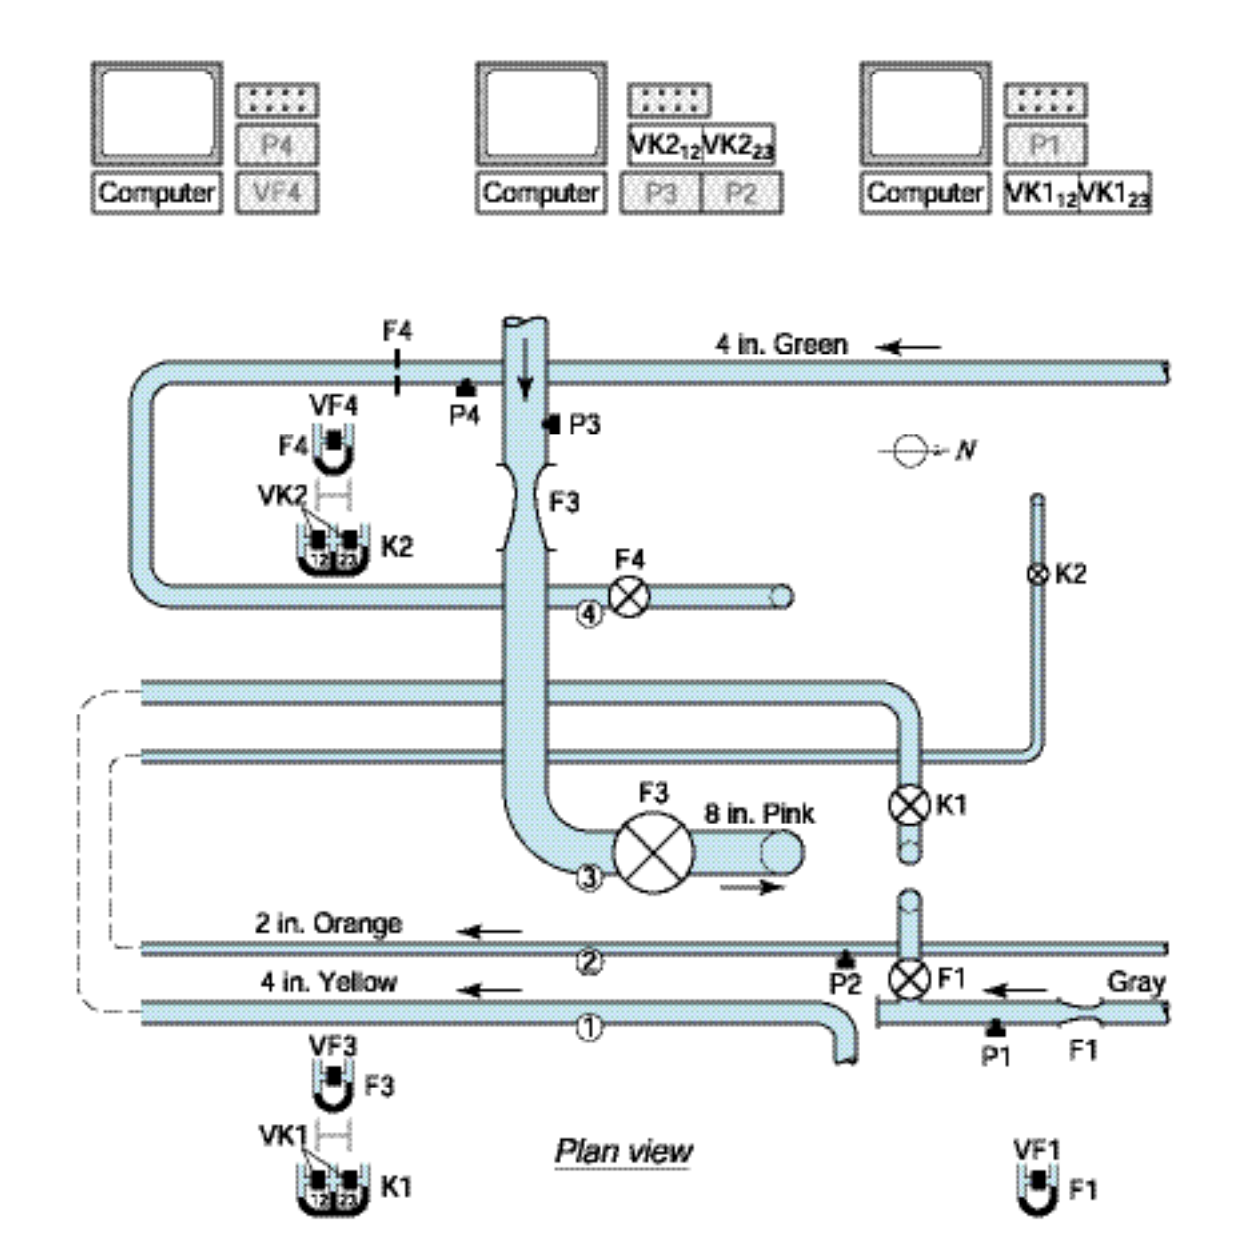
The "Gain Adjust" control on the paddlewheel flowmeter must be set to 6.25 turns for P1 and P4 in the previous figure, and 3 turns for P3. Next, zero the paddlewheel output. Next, open the discharge valve until a maximum flow is reached, and record data for the paddlewheel flowmeter and the hydraulic flowmeter. Make sure to record the manometer deflection. This can be repeated at slower and slower flow rates until the manometer reaches 10% of its original deflection.
Analyze Data Step 1
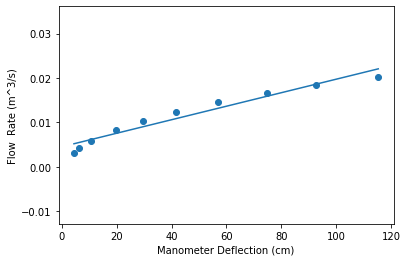
Make a plot of flow rate vs. manometer deflection. The above figure shows an example plot. Add a best fit line to the data to use as the flowmeter's calibration curve.
Analyze Data Step 2
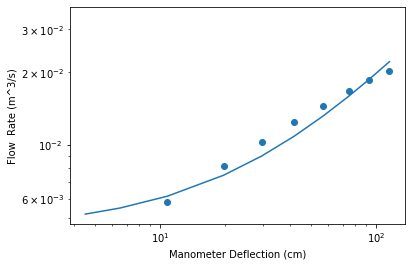
Next, flow flowrate and manometer deflection on a log scale. Follow the same steps as in Analyze Data Step 1. An example plot is shown above. Check that the data appears as a straight line, if it does, it will satisfy a power-law relation. The above plot meets this standard.
Analyze Data Step 3

Next, plot the discharge coefficient vs. the Reynolds number on a linear-log scale. You can calculate the Reynolds number by dividing the pipe diameter times the pipe velocity by the water viscosity. An example plot is shown above.
Analyze Data Step 4

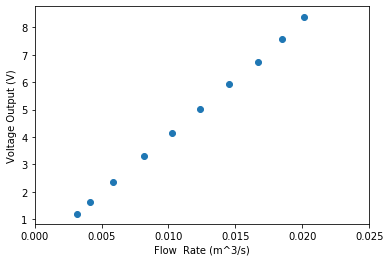
Next, the voltage for the paddlewheel will be plotted, as the voltage corresponds to the fluid velocity. Plot the voltage vs. the flow rate. Note any points where the paddlewheel isn't moving. Record what velocities should be the cutoff velocities and what is the maximum velocity. As seen in the above figure, the cutoff velocity appears to be when the flow rate is less than 0.003 m^3/s or at around 1 V. The maximum velocity is around 8.3 V.
Analyze Data Step 5
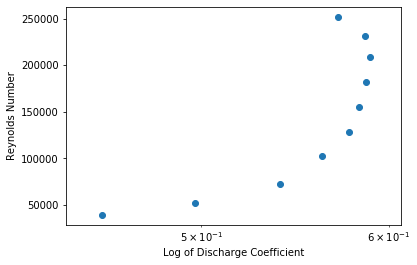
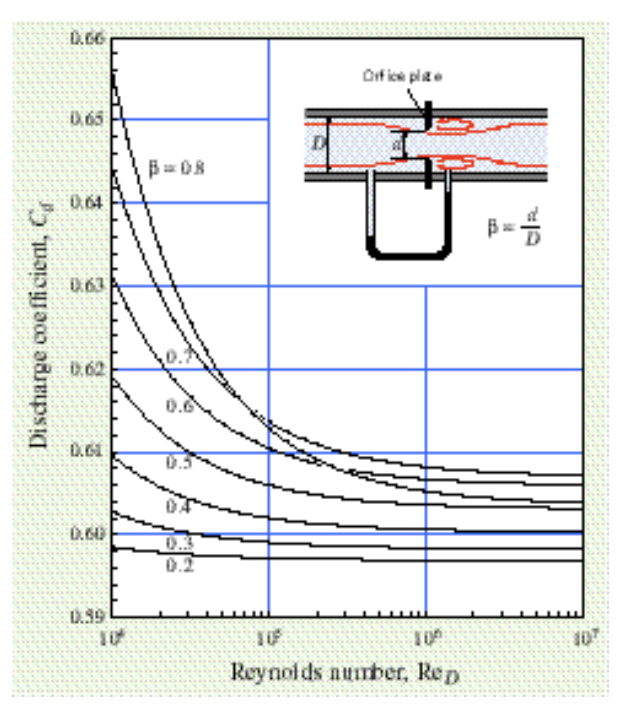
Check your plot of Reynolds number, and see whether the discharge coefficient is constant of the whole range. As seen in the above figure, the discharge coefficient does appear to be linearly correlated, up until the 5th data point. Compare these points to the values in the 2nd figure shown above from the lab manual, and see if they correlate. The included plot does seem to correlate, even its axes are switched. The discharge coefficient could be made more accurate by better measurements over more data points.
Analyze Data Step 6
Think about how accurate your graph for the paddlewheel flowmeter is. For the above graph, the paddlewheel flowmeter appears to be accurate across many velocities, although it is probably less accurate as the velocity decreases and more friction influences the wheel.