EcoMaris: Healthy Waters, Greener Earth.
by CodersCafeTech in Circuits > Arduino
5541 Views, 80 Favorites, 0 Comments
EcoMaris: Healthy Waters, Greener Earth.
.jpg)
The health of aquatic ecosystems is vital not only for marine life but also for the sustainability of human communities and the planet as a whole. Whether in oceans, rivers, lakes, or aquaculture ponds, maintaining balanced water conditions is essential.
Across the globe, aquatic ecosystems are facing unprecedented challenges — from the rapid loss of biodiversity and climate-induced changes to pollution and overexploitation. These issues not only threaten marine and freshwater species but also affect human livelihoods, food security, and public health. Despite this, continuous, real-time water quality monitoring remains inaccessible or unaffordable for many stakeholders.
This project presents a solar-powered, low-cost, and modular smart buoy, built to be universally deployable across a range of aquatic environments — from aquaculture ponds to coral reefs, community reservoirs to coastal restoration zones. The buoy uses a suite of robust sensors to monitor key water quality parameters:
- Temperature (°C): Critical for metabolic rates and oxygen solubility.
- Dissolved Oxygen (DO) (mg/L): Indicates whether aquatic life can breathe.
- pH: Reflects chemical balance and pollution susceptibility.
- Turbidity (NTU): Suggests sediment load, pollution, or algal bloom activity.
- Total Dissolved Solids (TDS) (ppm): Reflects the concentration of dissolved minerals, salts, and organic matter in water—critical for assessing water quality, osmotic balance for aquatic species, and ecosystem health.
The system is built around open-source hardware and software, allowing for customizability and ease of replication. It transmits real-time data wirelessly and can be accessed via cloud dashboards, mobile apps, or alerts — enabling on-the-go decision-making.
Supplies
Hardware
- Particle B524 SoM
- Waterproof LM35 Sensor
- DFRobot Gravity: Analog Spear Tip pH Sensor / Meter Kit
- DFRobot Gravity: Analog Dissolved Oxygen Sensor / Meter Kit For Arduino
- Turbidity Sensor, Phototransistor Output
- DFRobot TDS sensor
- Rain Sensor
- Solar Panels
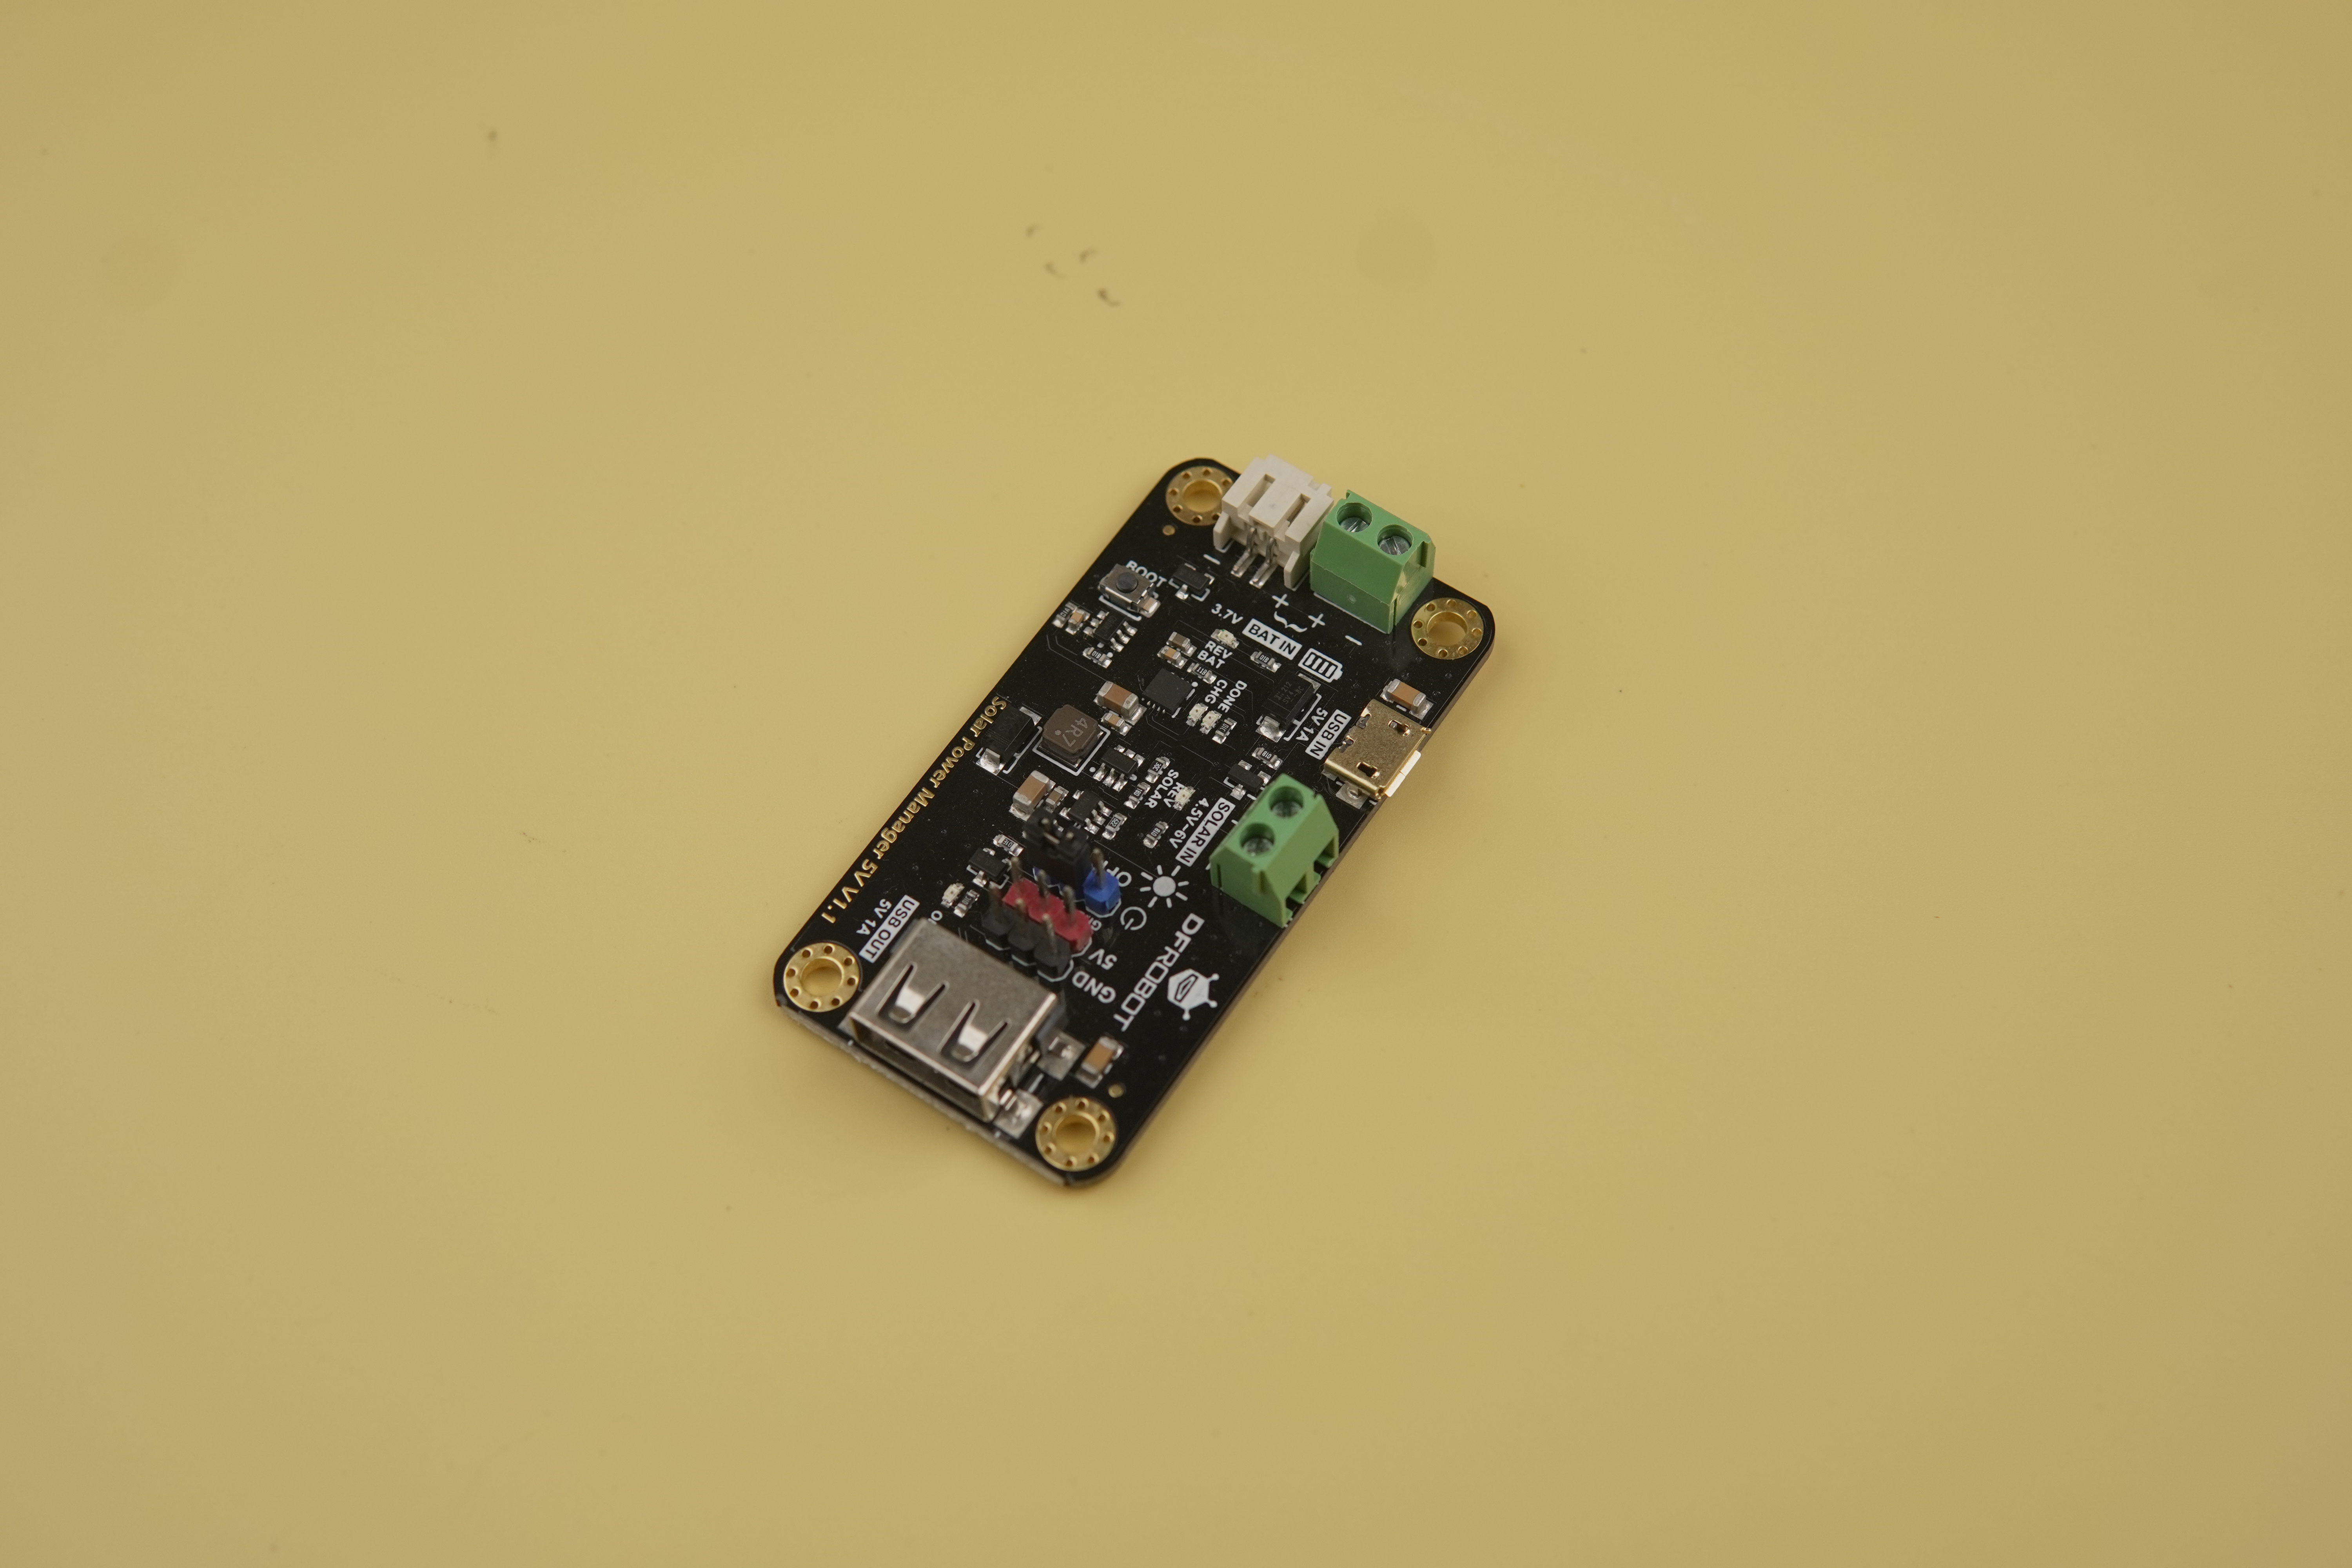
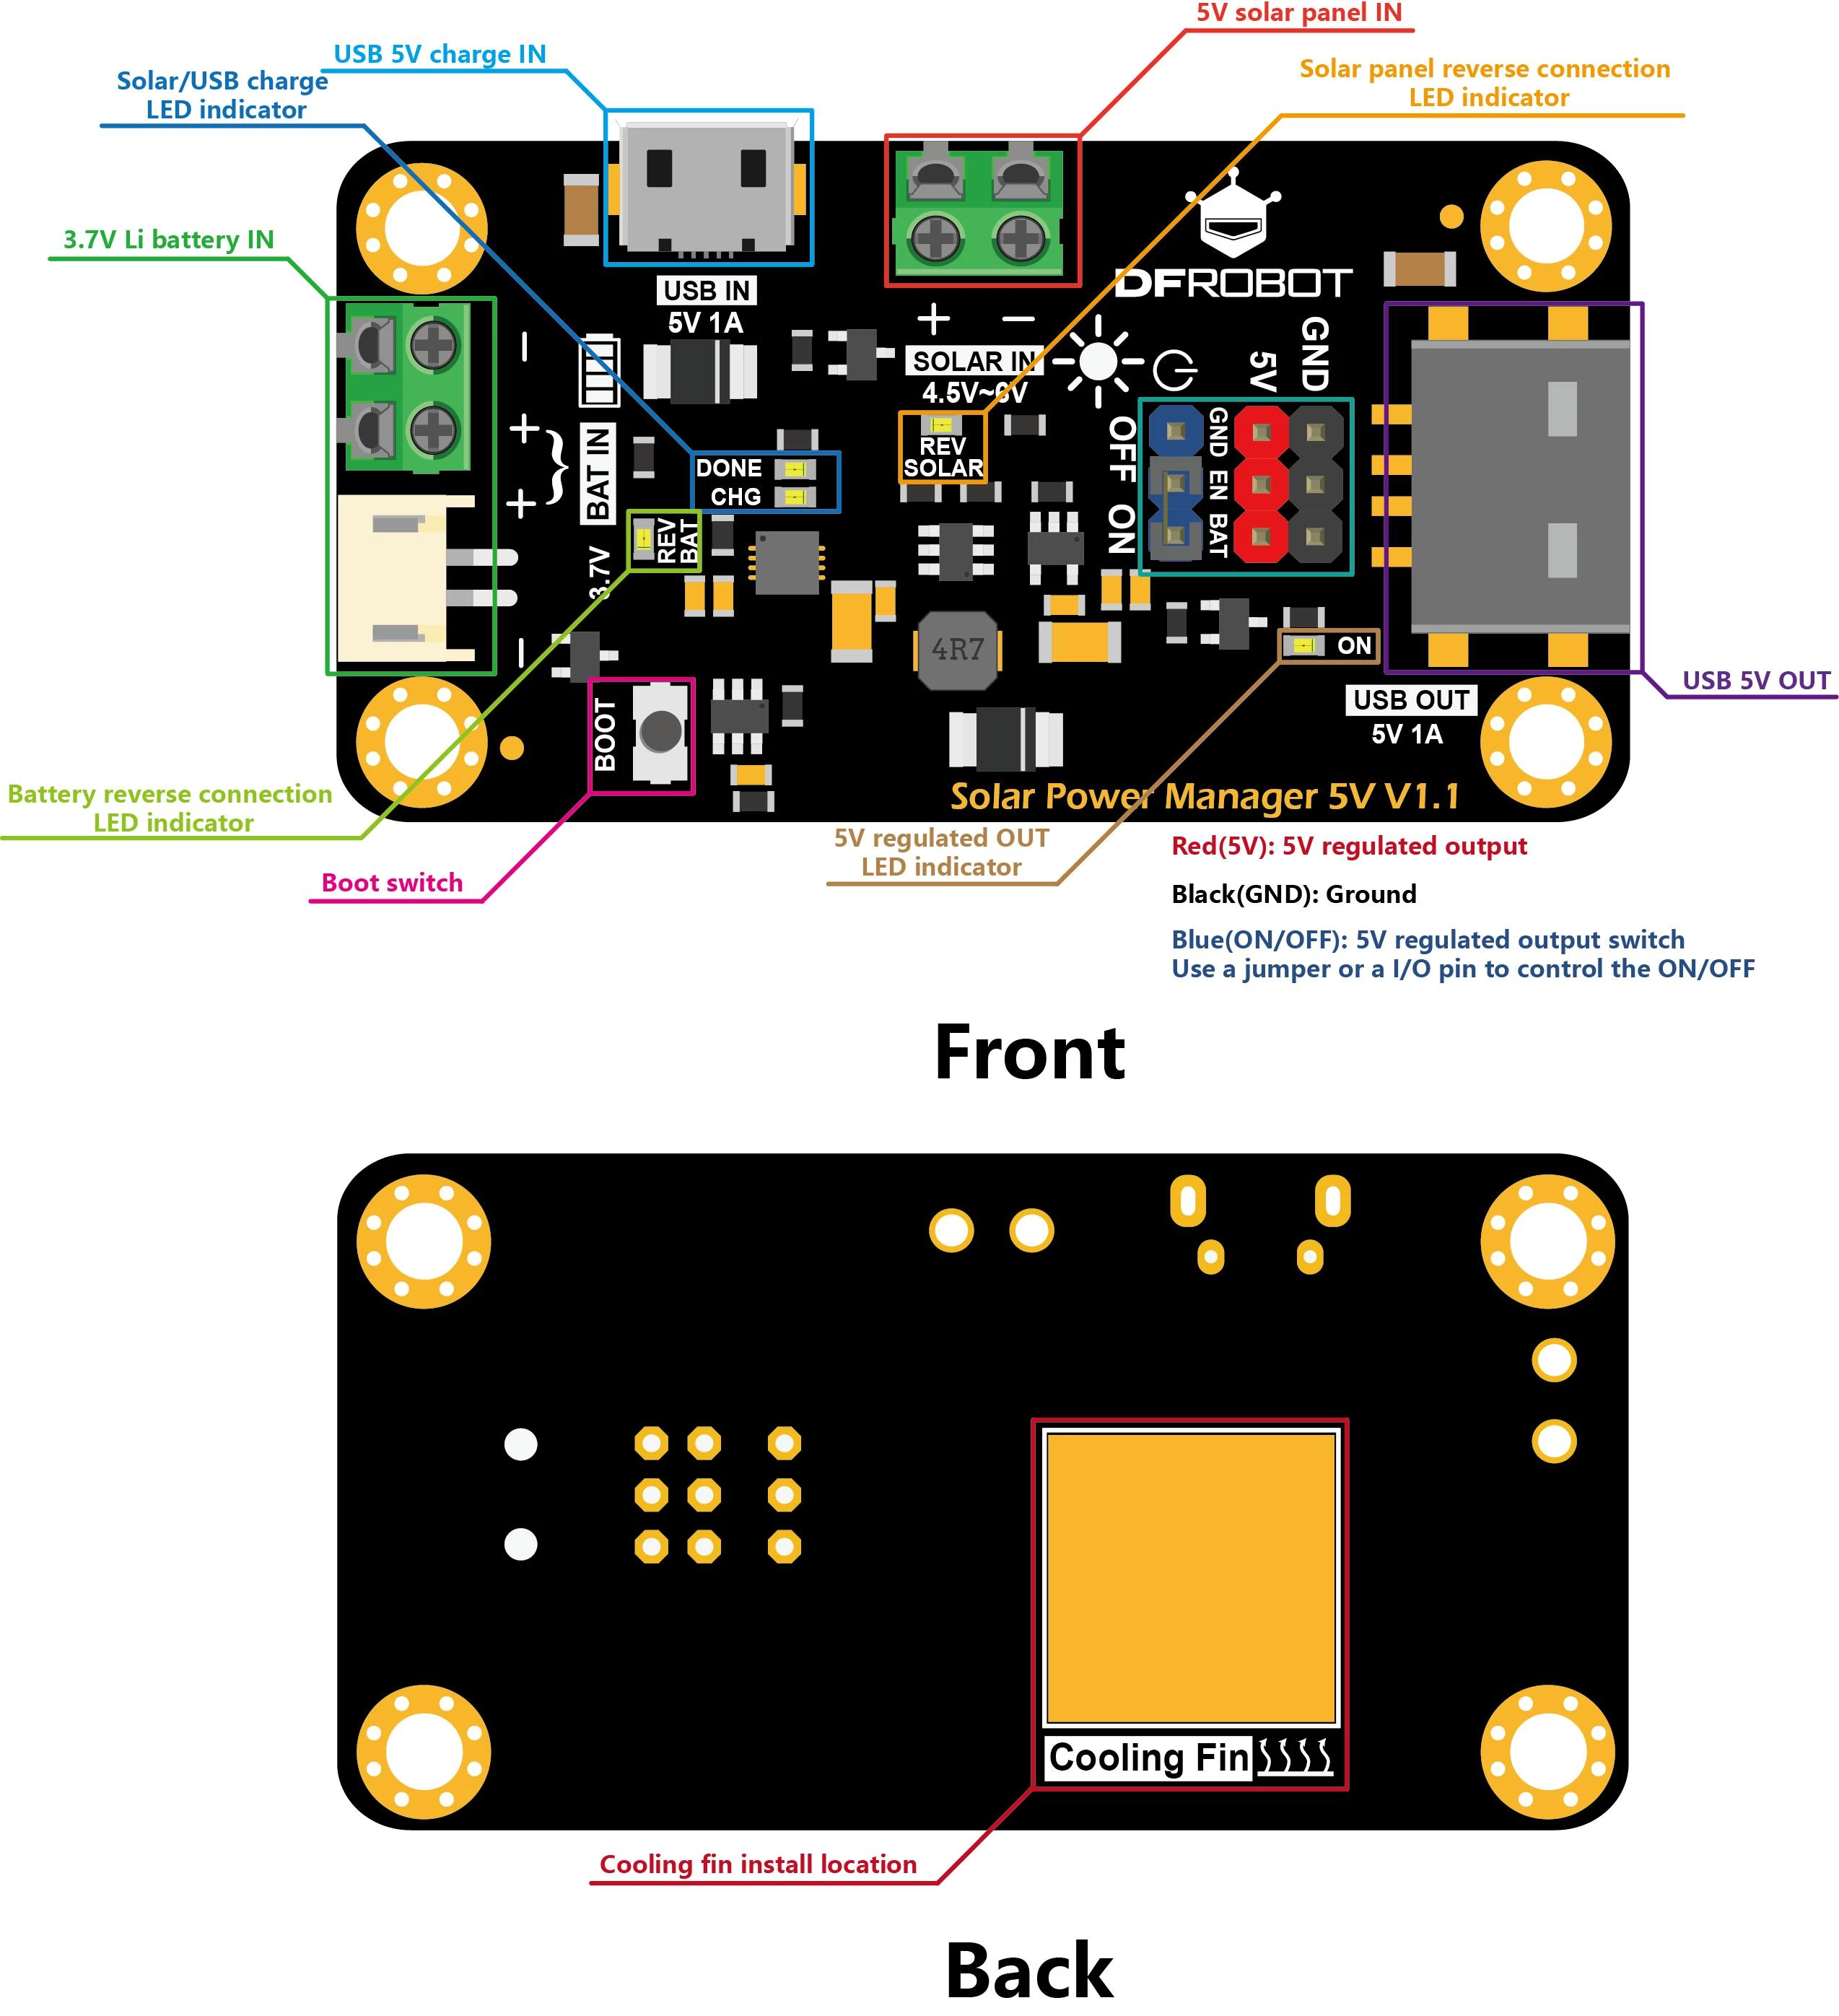
- DFRobot Solar Power Manager 5V
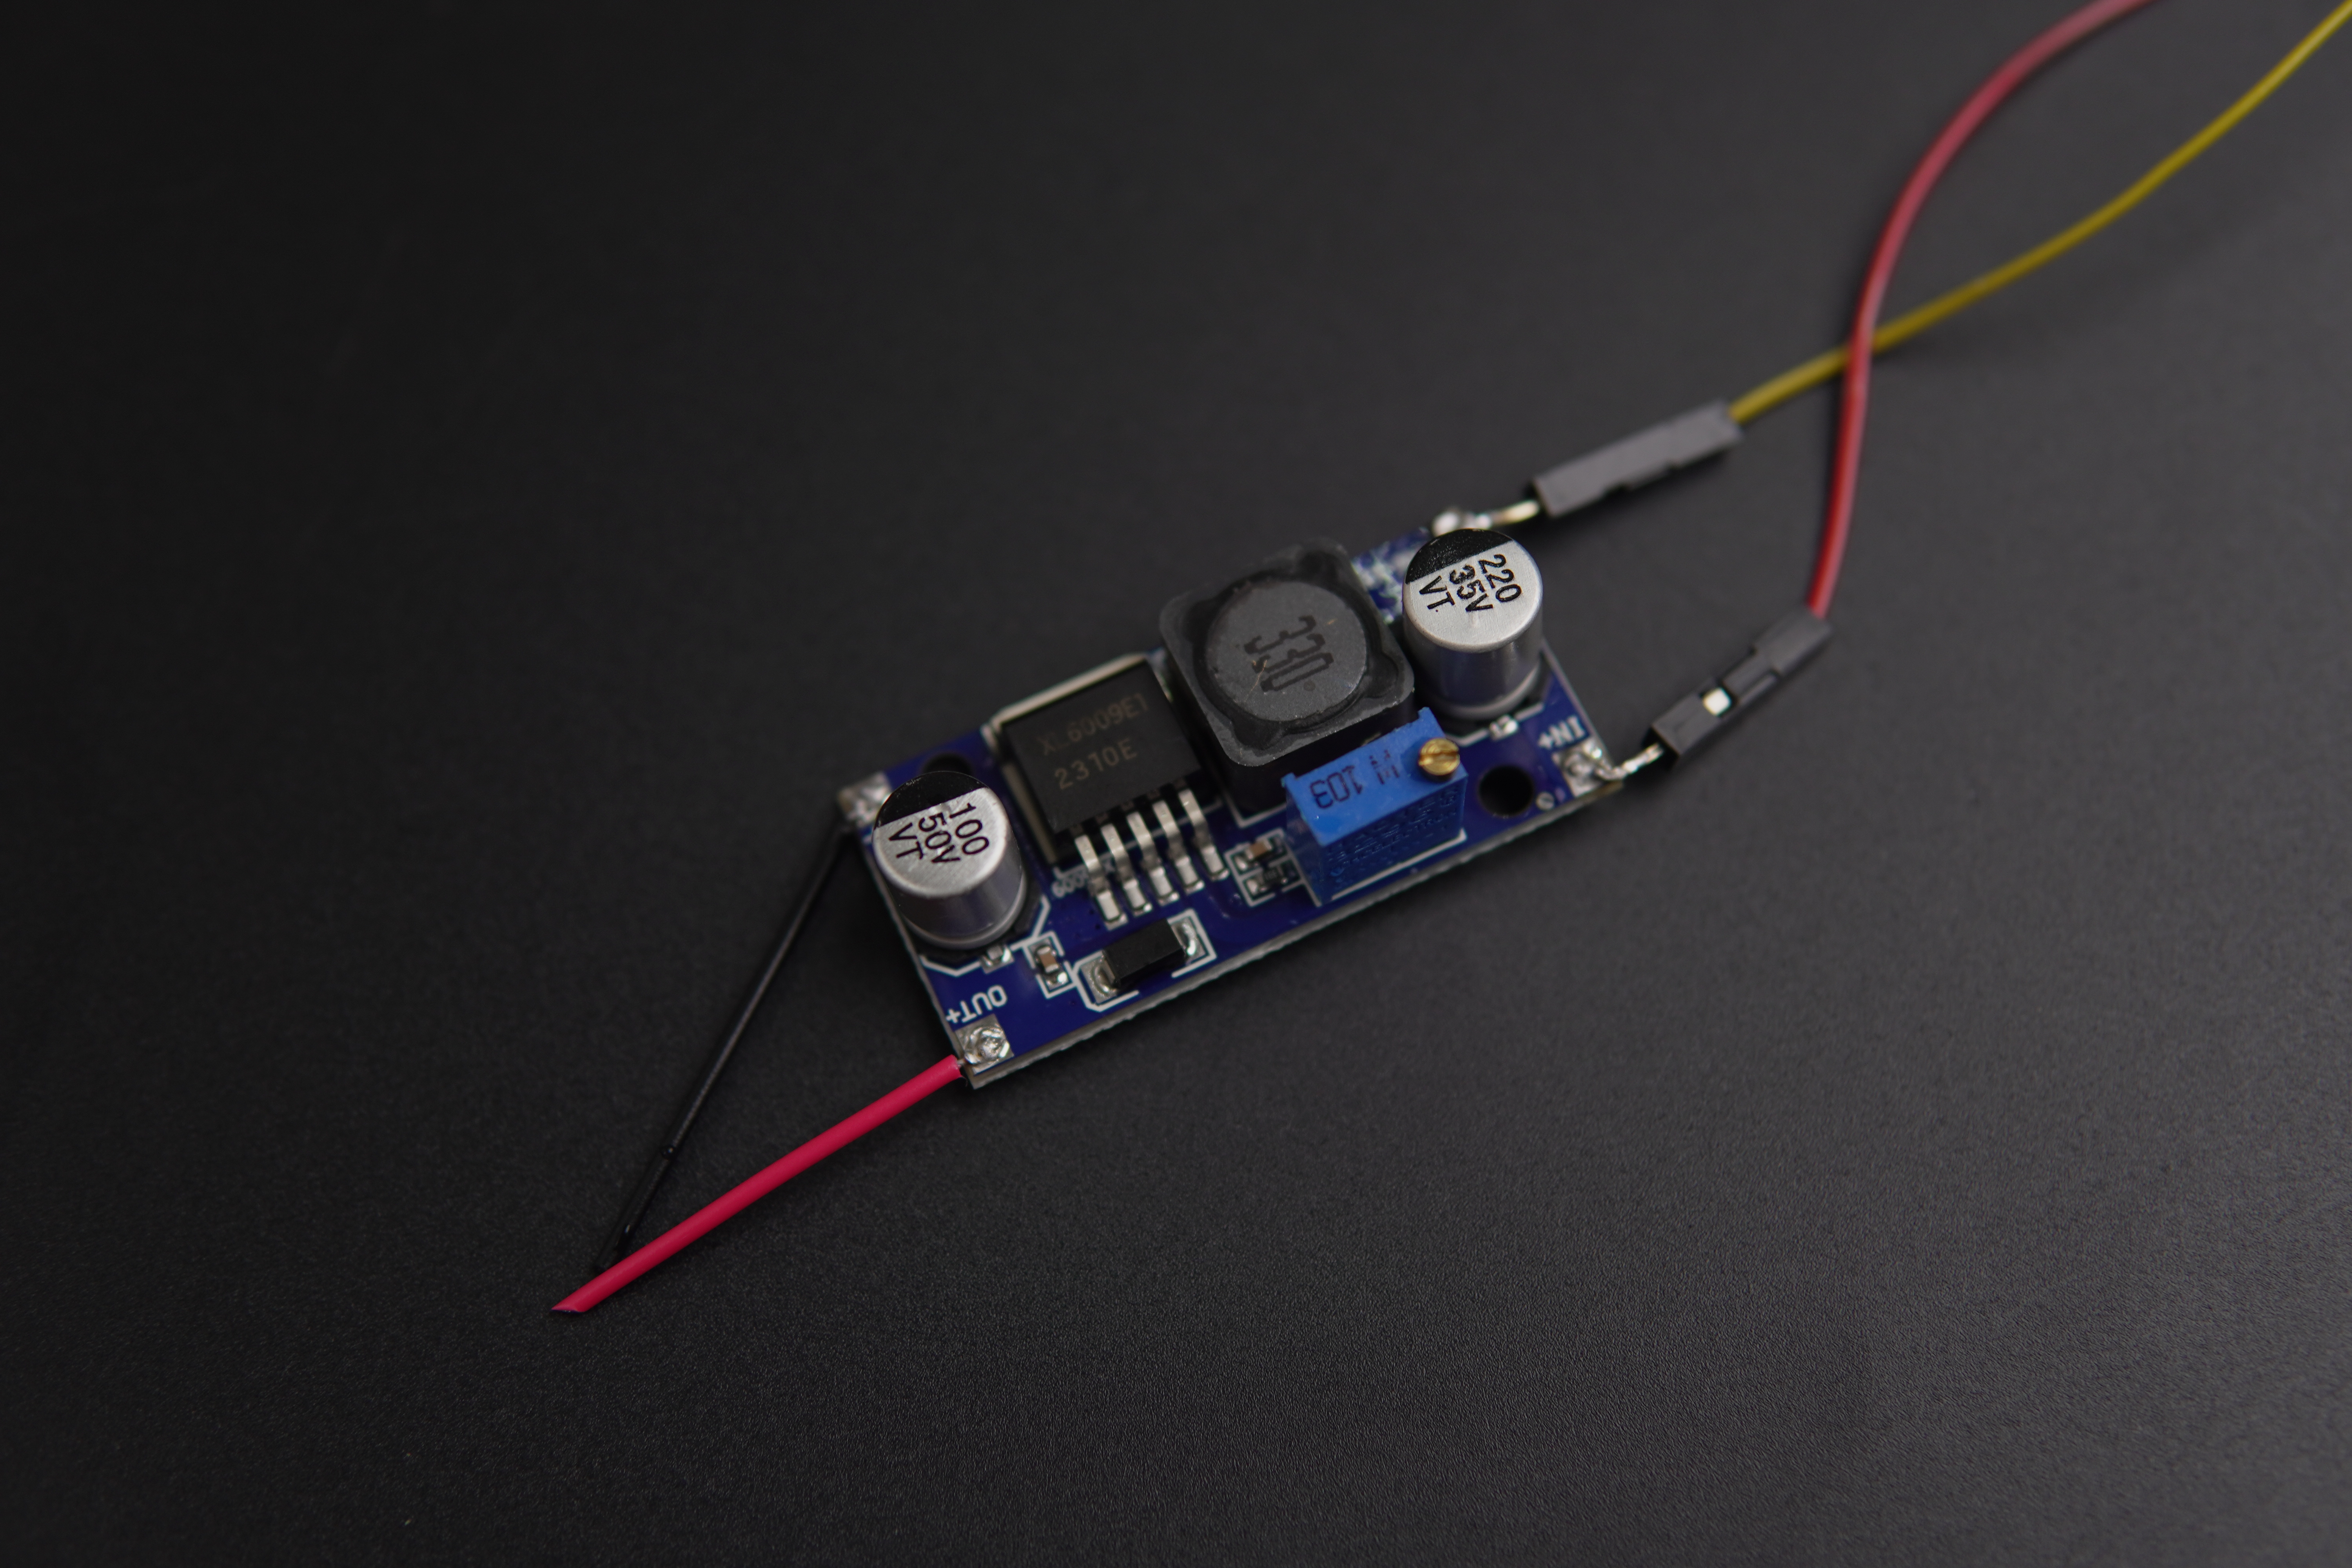
- LM2596S Buck Converter
- 698-960 MHz And 1710-2690 MHz / 5dBi Gain Dual Band 3G / 4G LTE Antenna
- LWC-CA-SMA-JACK-BH-ST-UFL-1.13mm RF Cable Assemblies-15cm
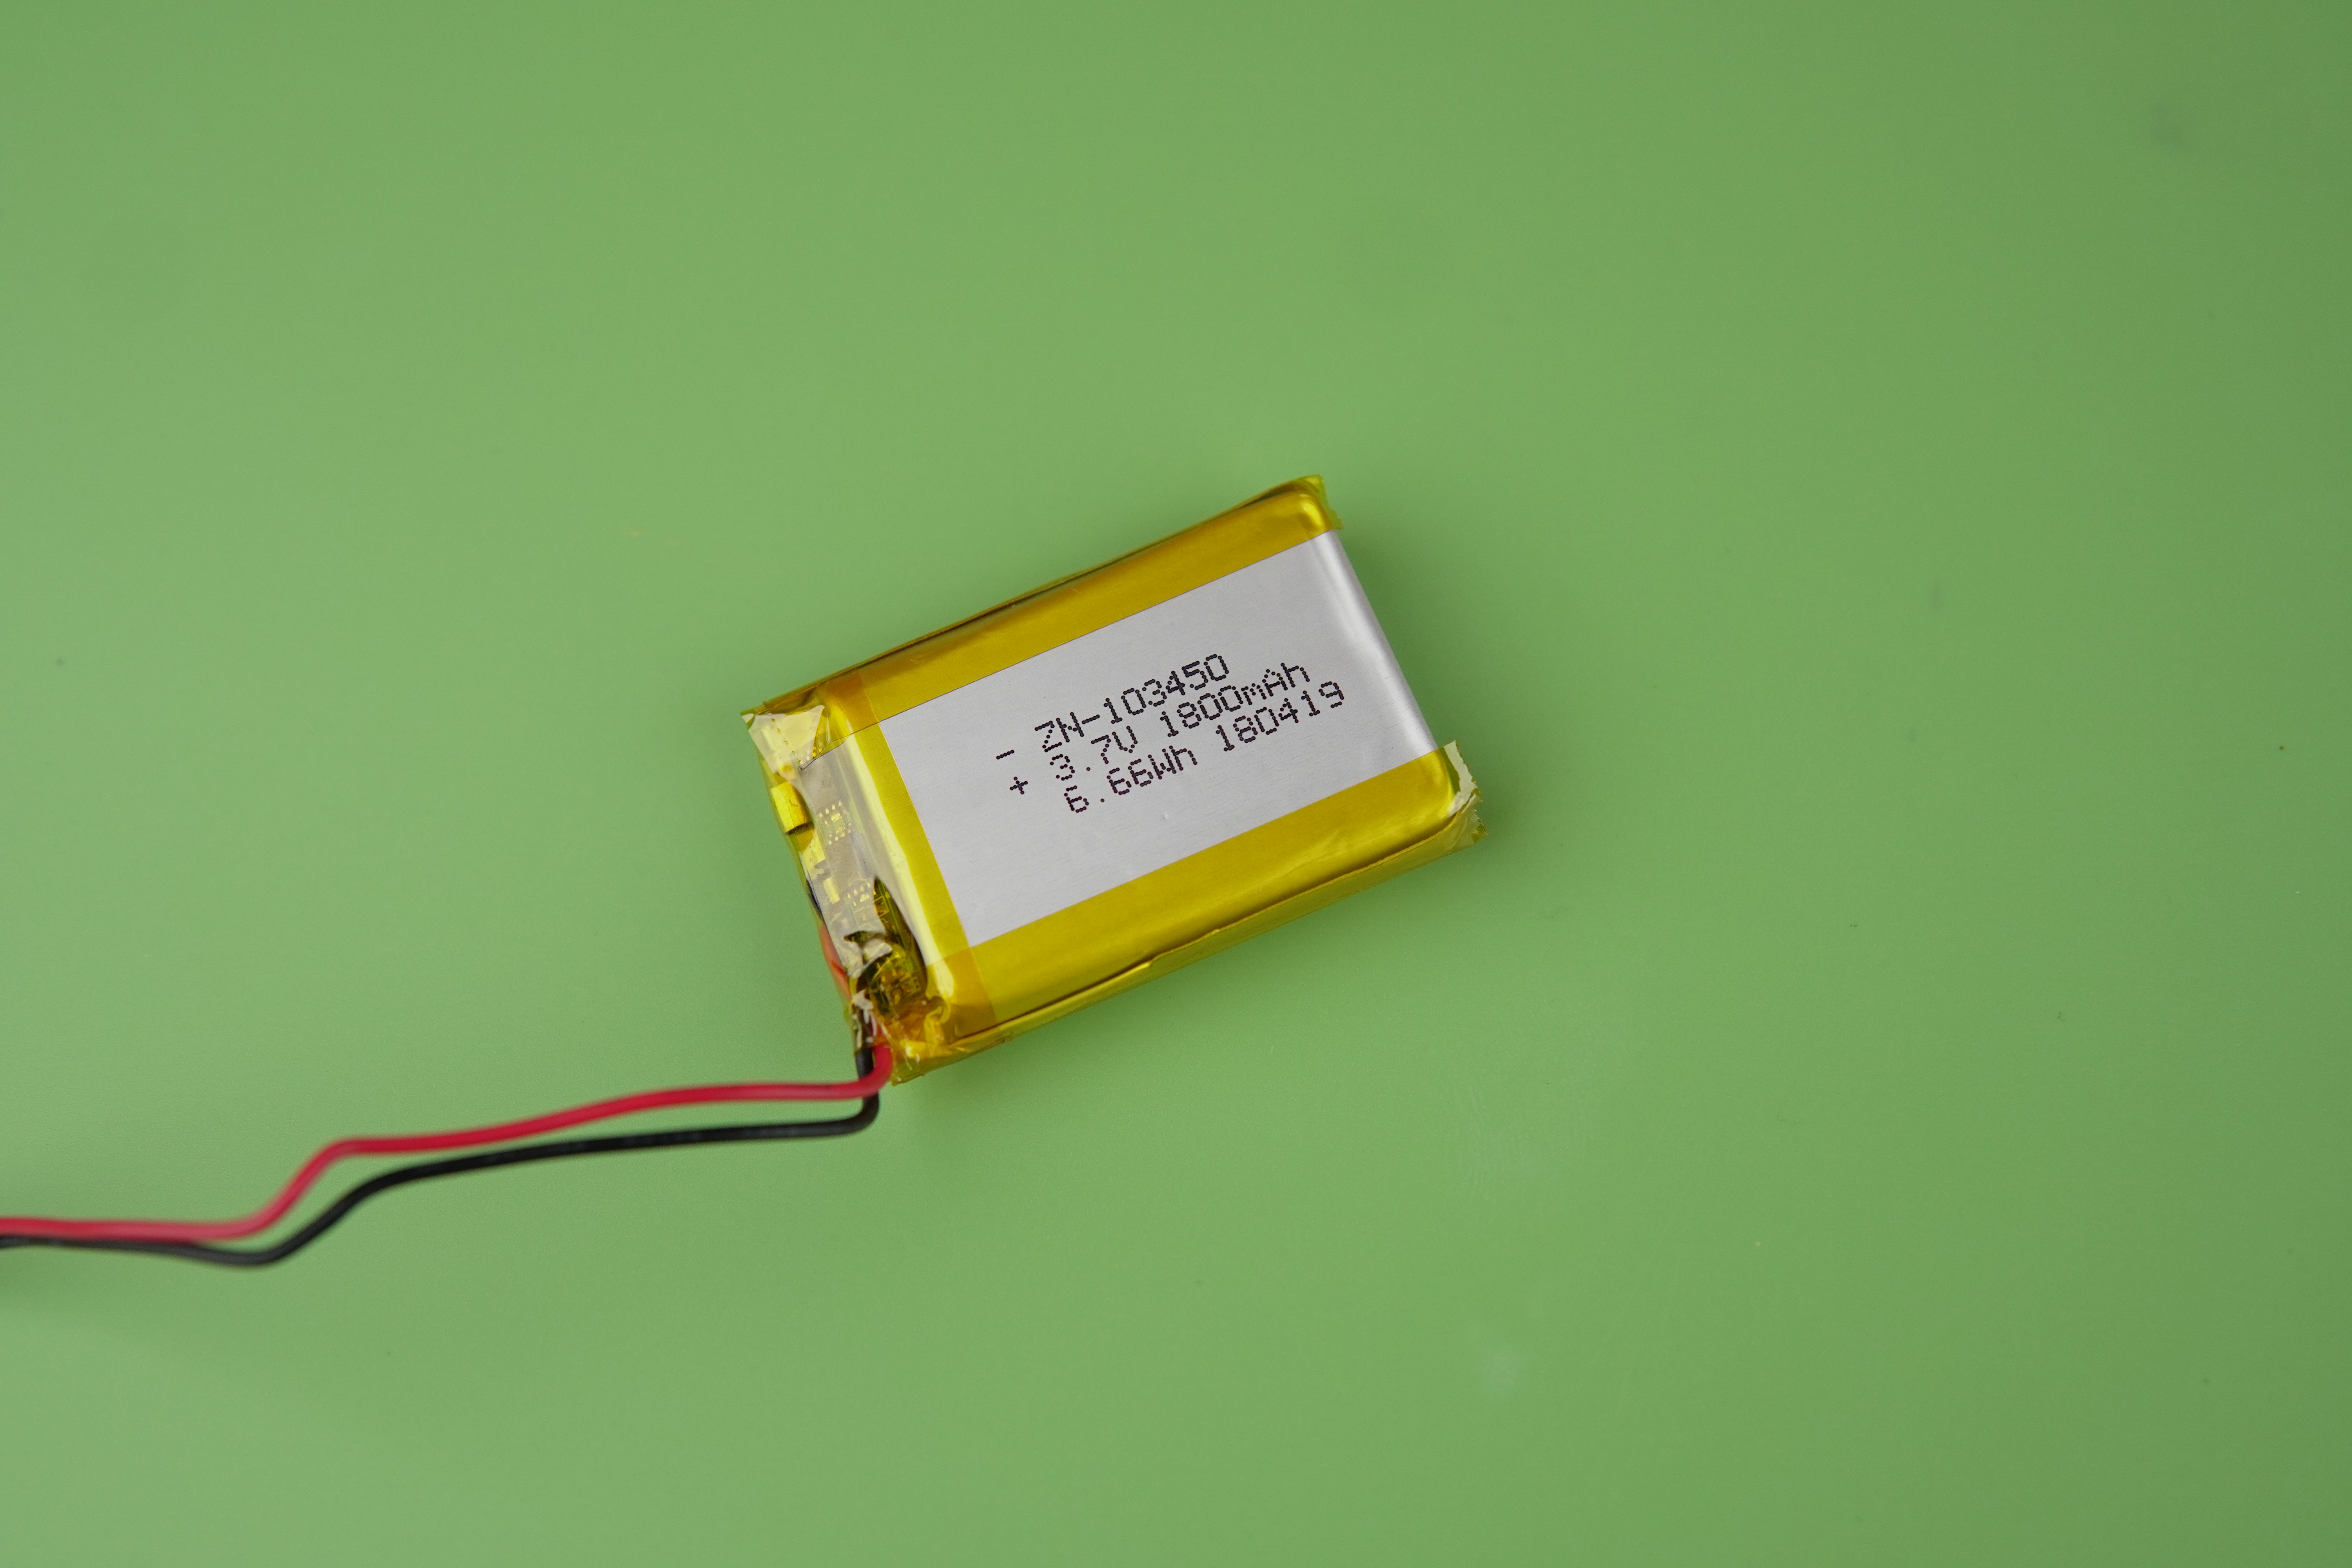
- LiPo Battery - 1800mAh
- Jumper wires
Software
Use Cases & Applications
1. Marine & Freshwater Conservation
- Endangered Species Monitoring: Helps researchers maintain suitable habitats for vulnerable species such as dolphins, seahorses, and freshwater turtles by continuously logging environmental trends.
- Coral Reef Protection: Reefs are sensitive to small changes in temperature, pH, and sedimentation. The buoy helps detect bleaching conditions early, improving conservation response.
- Seagrass and Mangrove Restoration: Post-restoration, the buoy ensures that environmental conditions remain optimal, helping NGOs and governments gauge the success of regeneration efforts.
- Protected Area Management: Deployed in marine sanctuaries or wildlife reserves to automate water health logging, freeing up human resources and enabling 24/7 monitoring.
2. Sustainable Aquaculture
While originally tested in shrimp ponds, this buoy is species-agnostic and suitable for:
- Fish farms (tilapia, trout, catfish, etc.)
- Shellfish cultivation (oysters, clams, mussels)
- Integrated Multi-Trophic Aquaculture (IMTA) systems
Key benefits:
- Reduces stress and mortality by maintaining stable water parameters.
- Enables smart dosing of oxygenation, buffering agents, and other treatments.
- Cuts operational costs and prevents overfeeding or unnecessary chemical usage.
- Increases productivity while ensuring environmentally safe discharge.
3. Community & Public Water Health Monitoring
In many regions, surface water bodies are the backbone of human survival. This buoy supports:
- Village ponds, tanks, and community reservoirs: Flags contamination from open defecation, dumping, or algae.
- Drinking water source validation: Alerts health officials or communities if conditions degrade beyond acceptable limits.
- Civic Monitoring: Citizens can use buoys to track the health of local lakes and rivers, enabling community-driven environmental stewardship.
4. Climate Change Impact Studies
Water ecosystems are among the first to show signs of climate change. With long-term data collected via this buoy, researchers can:
- Track temperature trends and their impact on oxygen availability and species diversity.
- Monitor acidification (pH drop) caused by increased atmospheric CO₂.
- Study how salinity levels change in estuaries due to rising sea levels and irregular rainfall.
5. Industrial & Agricultural Pollution Management
The buoy becomes an on-site watchdog at:
- Industrial discharge points, monitoring real-time pollutant levels.
- Agricultural runoff zones, where fertilizers and pesticides enter rivers and lakes, causing eutrophication or chemical contamination.
- Stormwater outlets, to check water quality after rainfall in urban environments.
6. Early Warning & Crisis Response
- Toxic Algae Blooms: Parameters like DO, pH, and turbidity shift before visible signs appear. Early detection saves ecosystems and prevents fish kills.
- Oil or Chemical Spills: A network of buoys can pinpoint the spread of a spill, informing containment strategies.
- Post-disaster Monitoring: After floods, tsunamis, or hurricanes, deployed buoys can quickly assess the water conditions to support relief and recovery efforts.
7. Research, Academia & Education
- Environmental science departments can deploy buoys in field labs, rivers, or near campuses to collect real-world data for student projects or research.
- School STEM programs can integrate low-cost kits to teach water chemistry, IoT, and sustainability.
- University researchers can gather longitudinal datasets with minimal manual intervention, enhancing studies on hydrology, aquatic biology, and pollution.
Particle B5 SoM
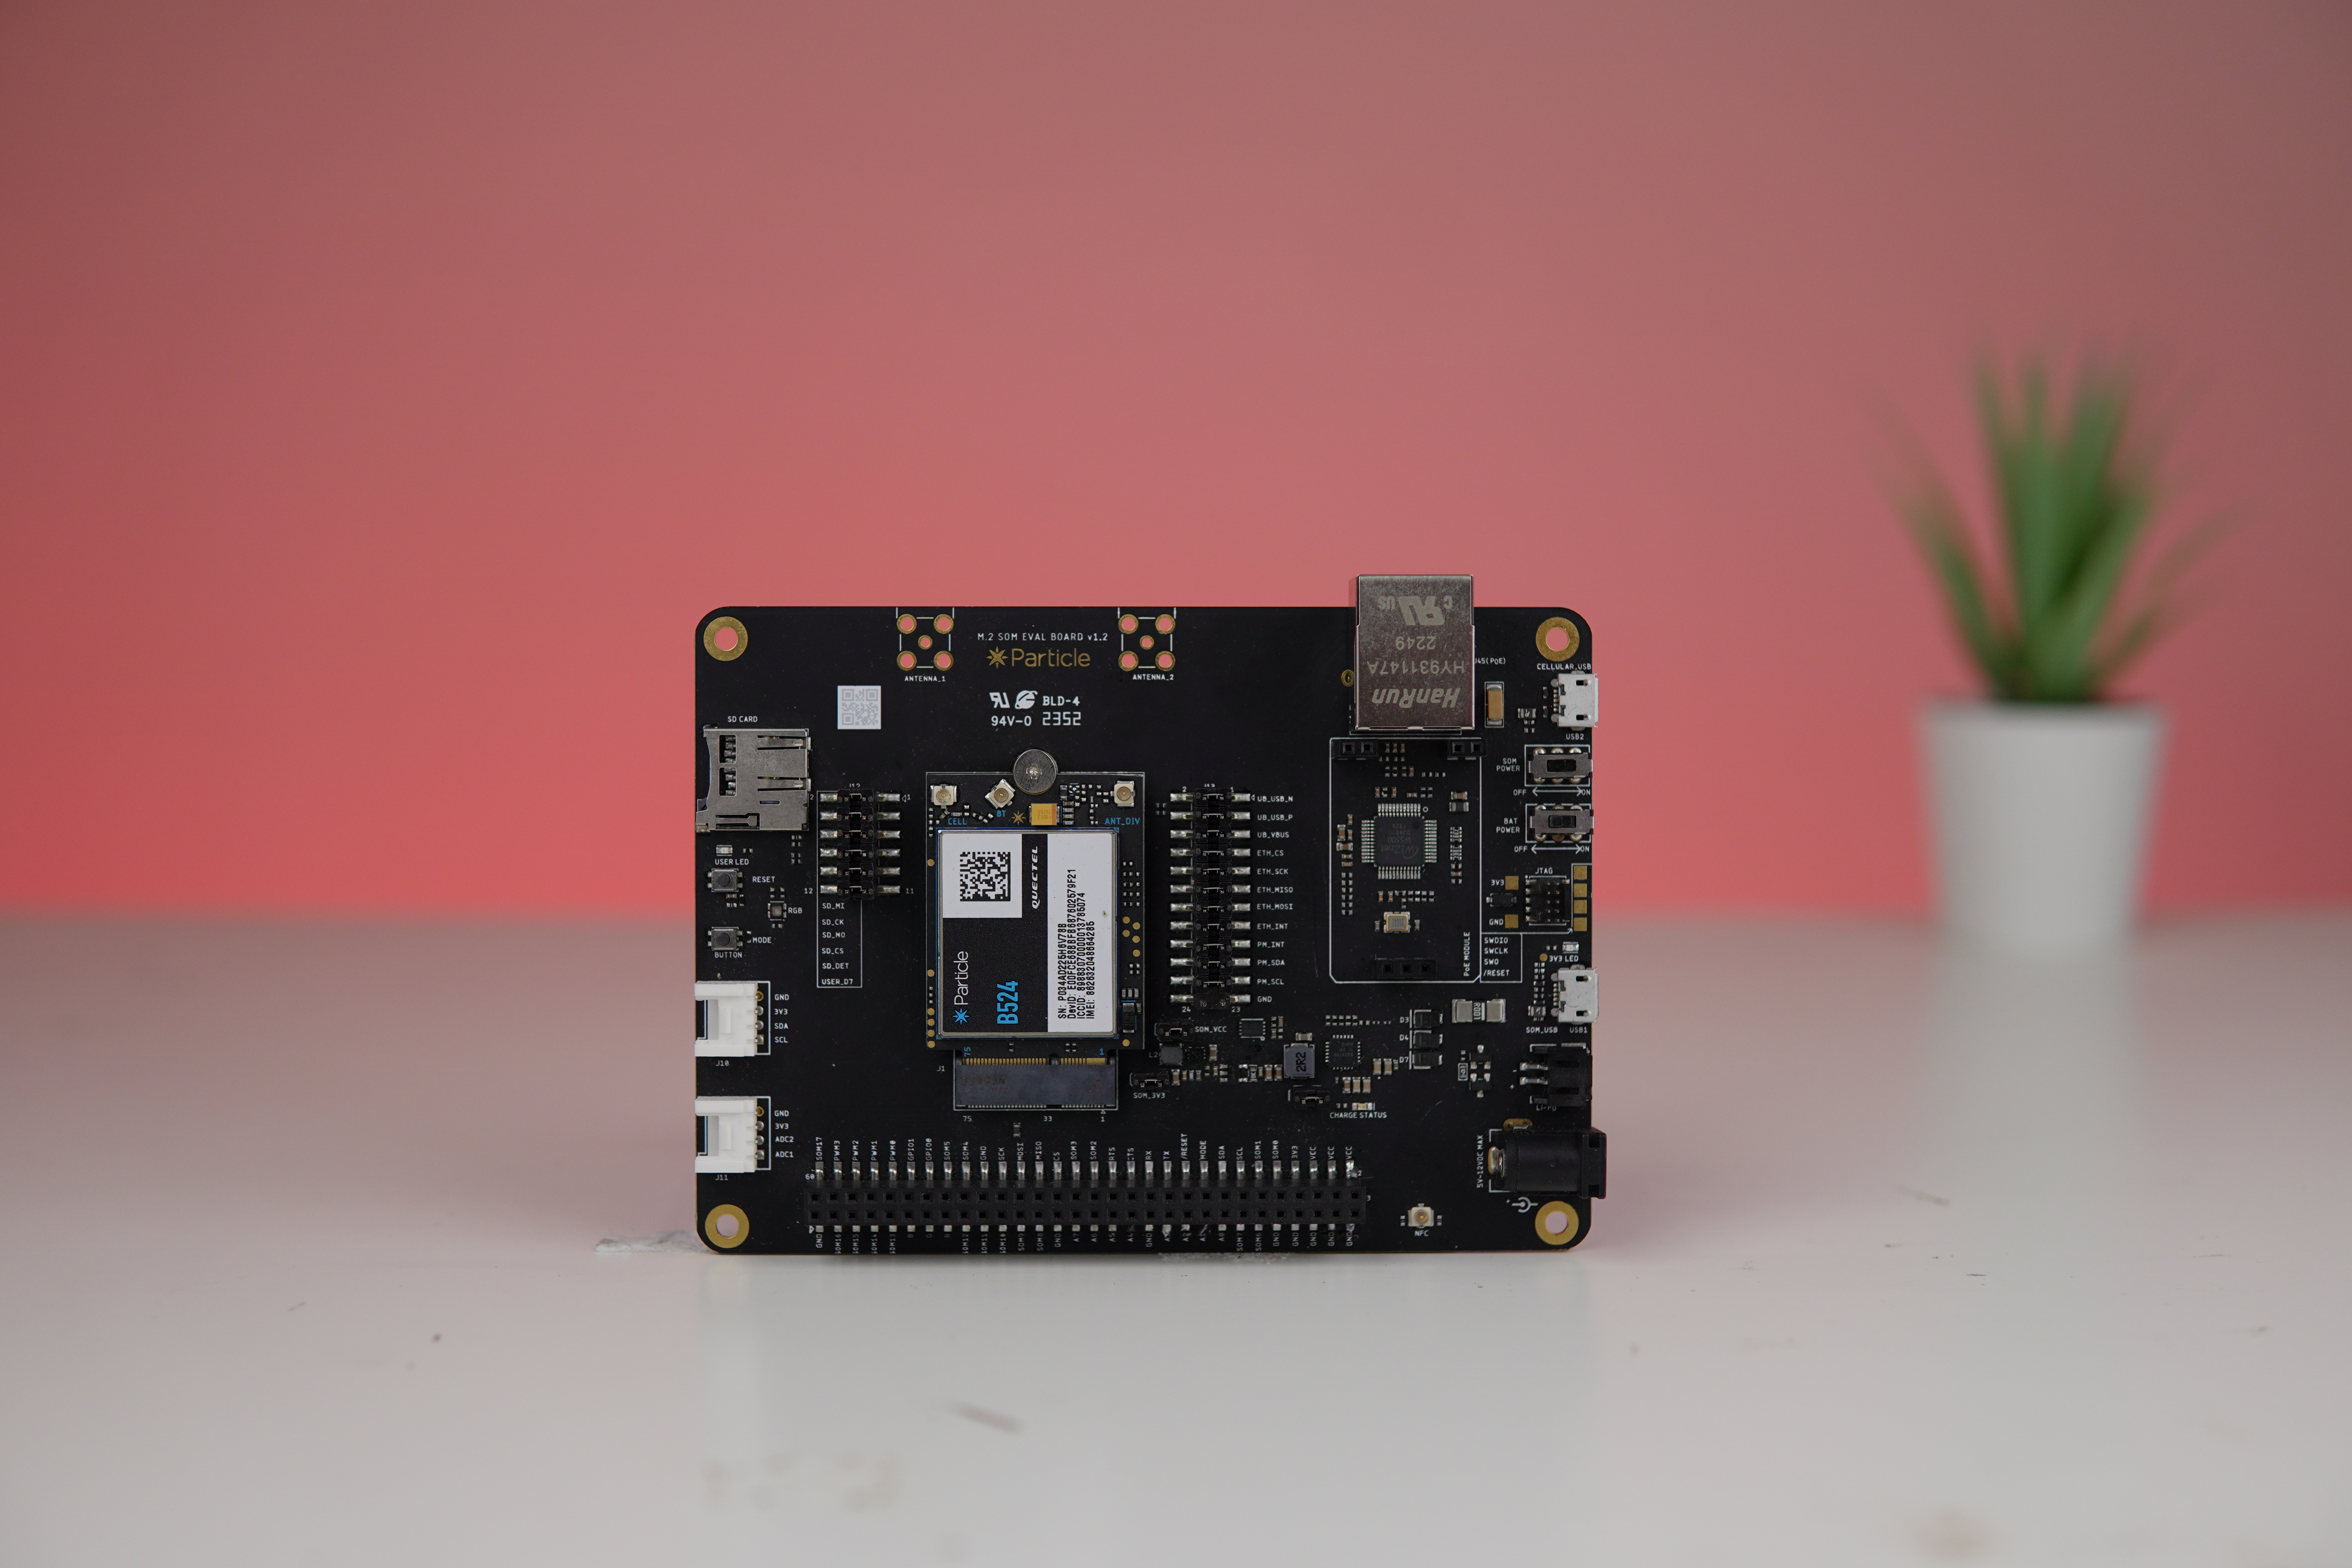
The B-SoM (Board System-on-Module) is the cornerstone of this project, functioning as a dependable IoT module for cellular connectivity. Built on the Particle IoT Platform-as-a-Service, it comes equipped with a free global embedded SIM card and data plan.
To interface with the module, we utilize the M.2 SoM Evaluation Board, a user-friendly breakout board that provides access to the B-SoM's essential pins and functionalities. This facilitates smooth development and deployment within our system. The evaluation board includes a variety of features, such as USB ports for both the nRF52840 MCU and the cellular modem, an SD card connector, an Ethernet connector, a barrel jack power connector, buttons, an RGB LED, a charge status LED, and a connector for a LiPo battery. These components collectively enhance the board's versatility and ease of use in the project.
For a quick start with the BSoM read this tutorial.
To utilize the full capabilities of the B524 SoM with the Particle platform, you’ll need to set up your Particle.io account and configure your device. Follow the steps here to getting started with the particle.
LM35 Temperature Sensor
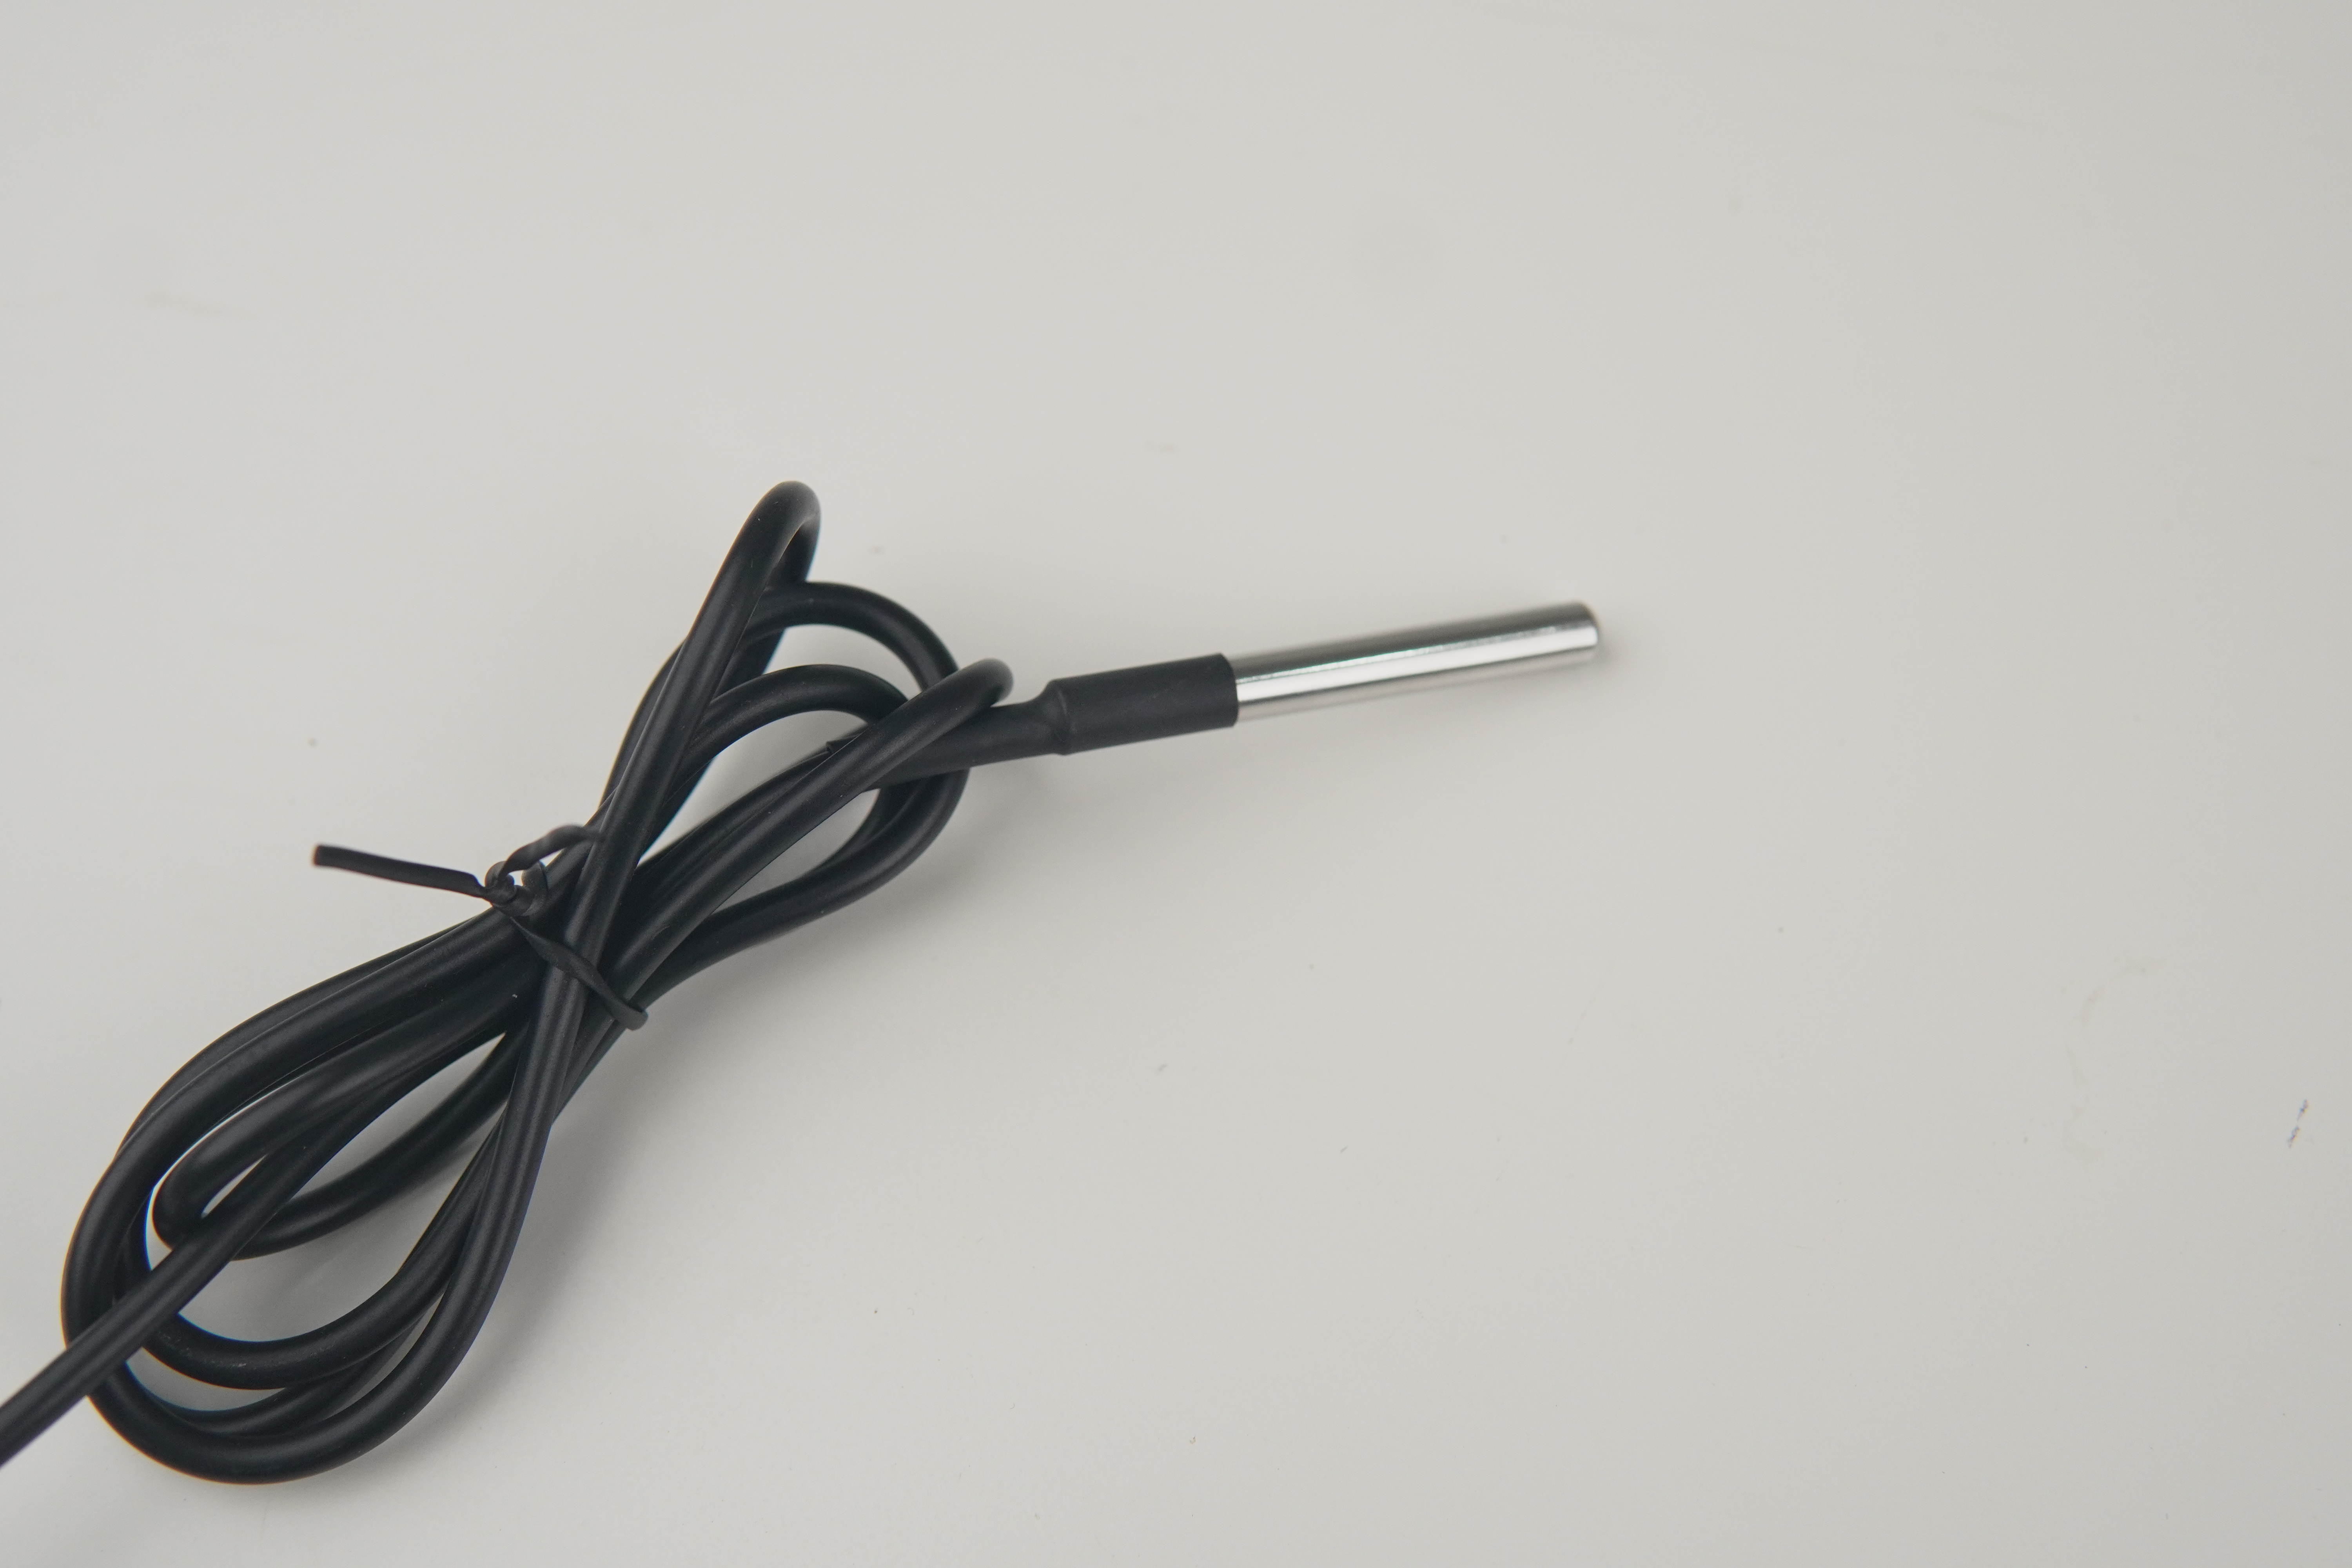
The LM35 sensor is used to measure water temperature, a critical parameter for sustaining healthy aquatic ecosystems. Many aquatic species are highly sensitive to temperature fluctuations, which can affect their metabolism, behavior, and overall survival. Accurate and continuous monitoring enables better management of environmental conditions, supporting conservation efforts and the health of aquatic life. In this system, a waterproof version of the sensor is used to ensure reliable performance in submerged conditions.
The sensor operates by generating an analog voltage proportional to temperature, providing a simple and accurate method for temperature measurement.
Here is the sample code for getting temperature from lm35 and will print in the Serial monitor.
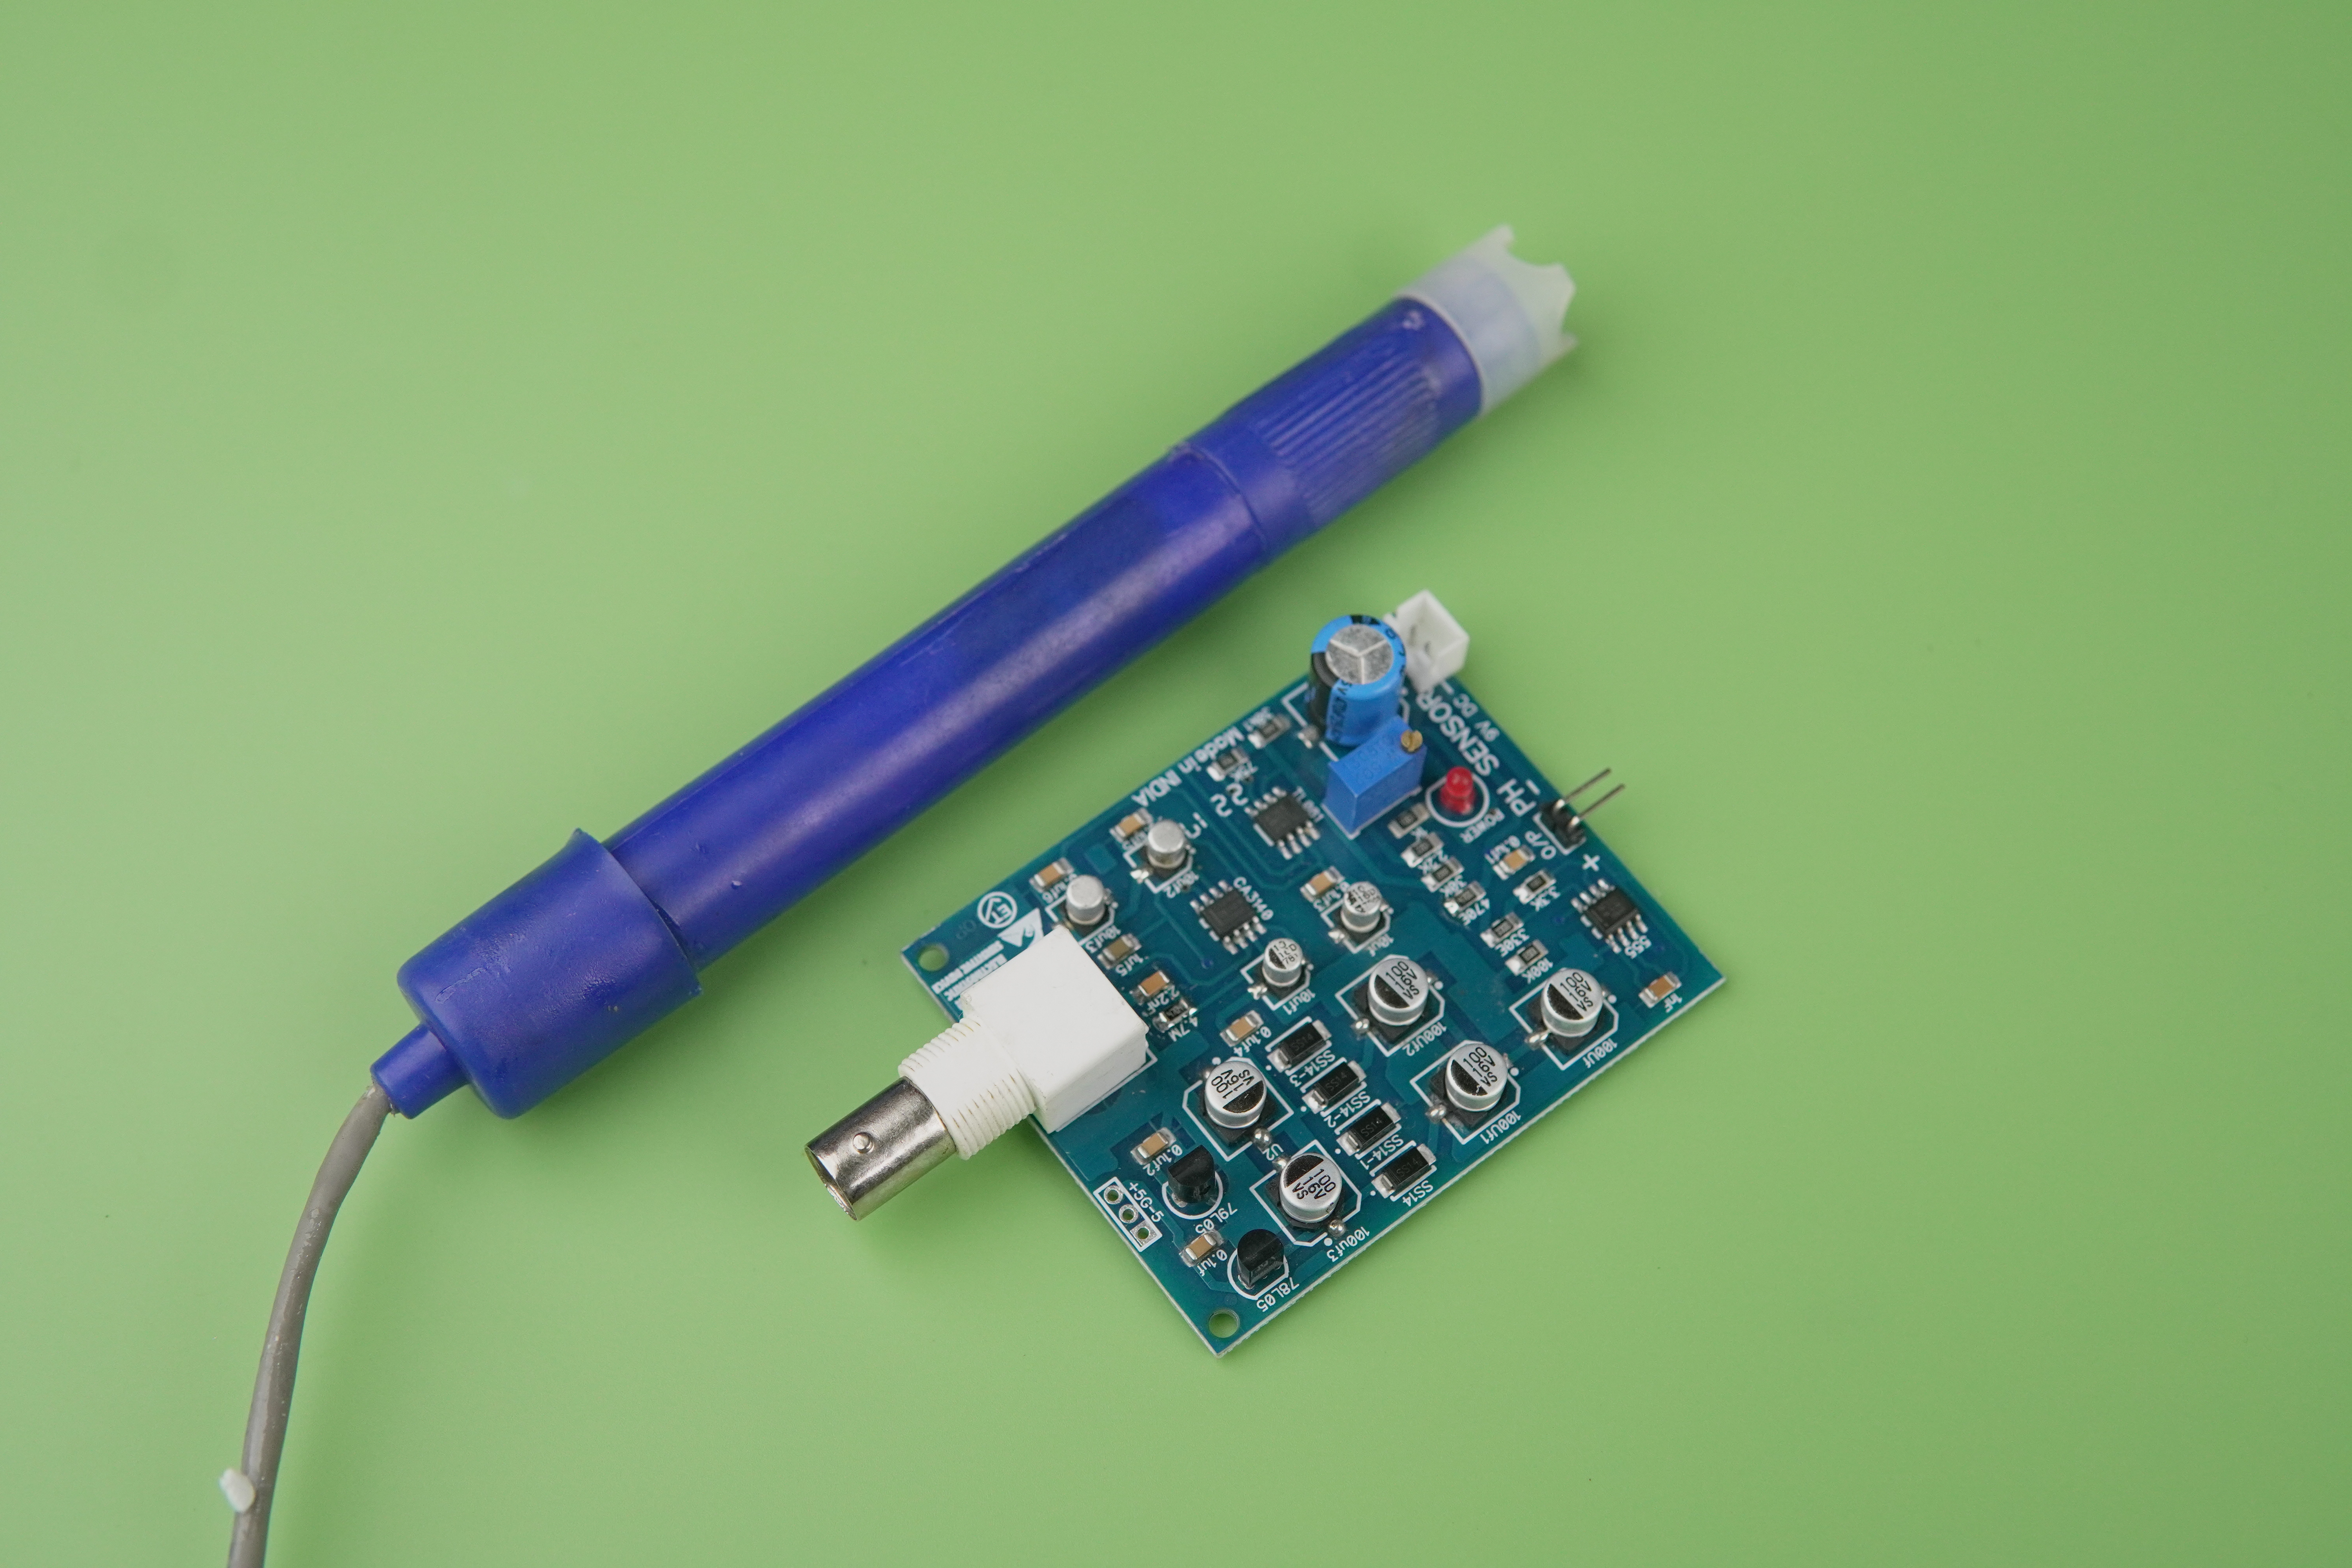
PH Sensor
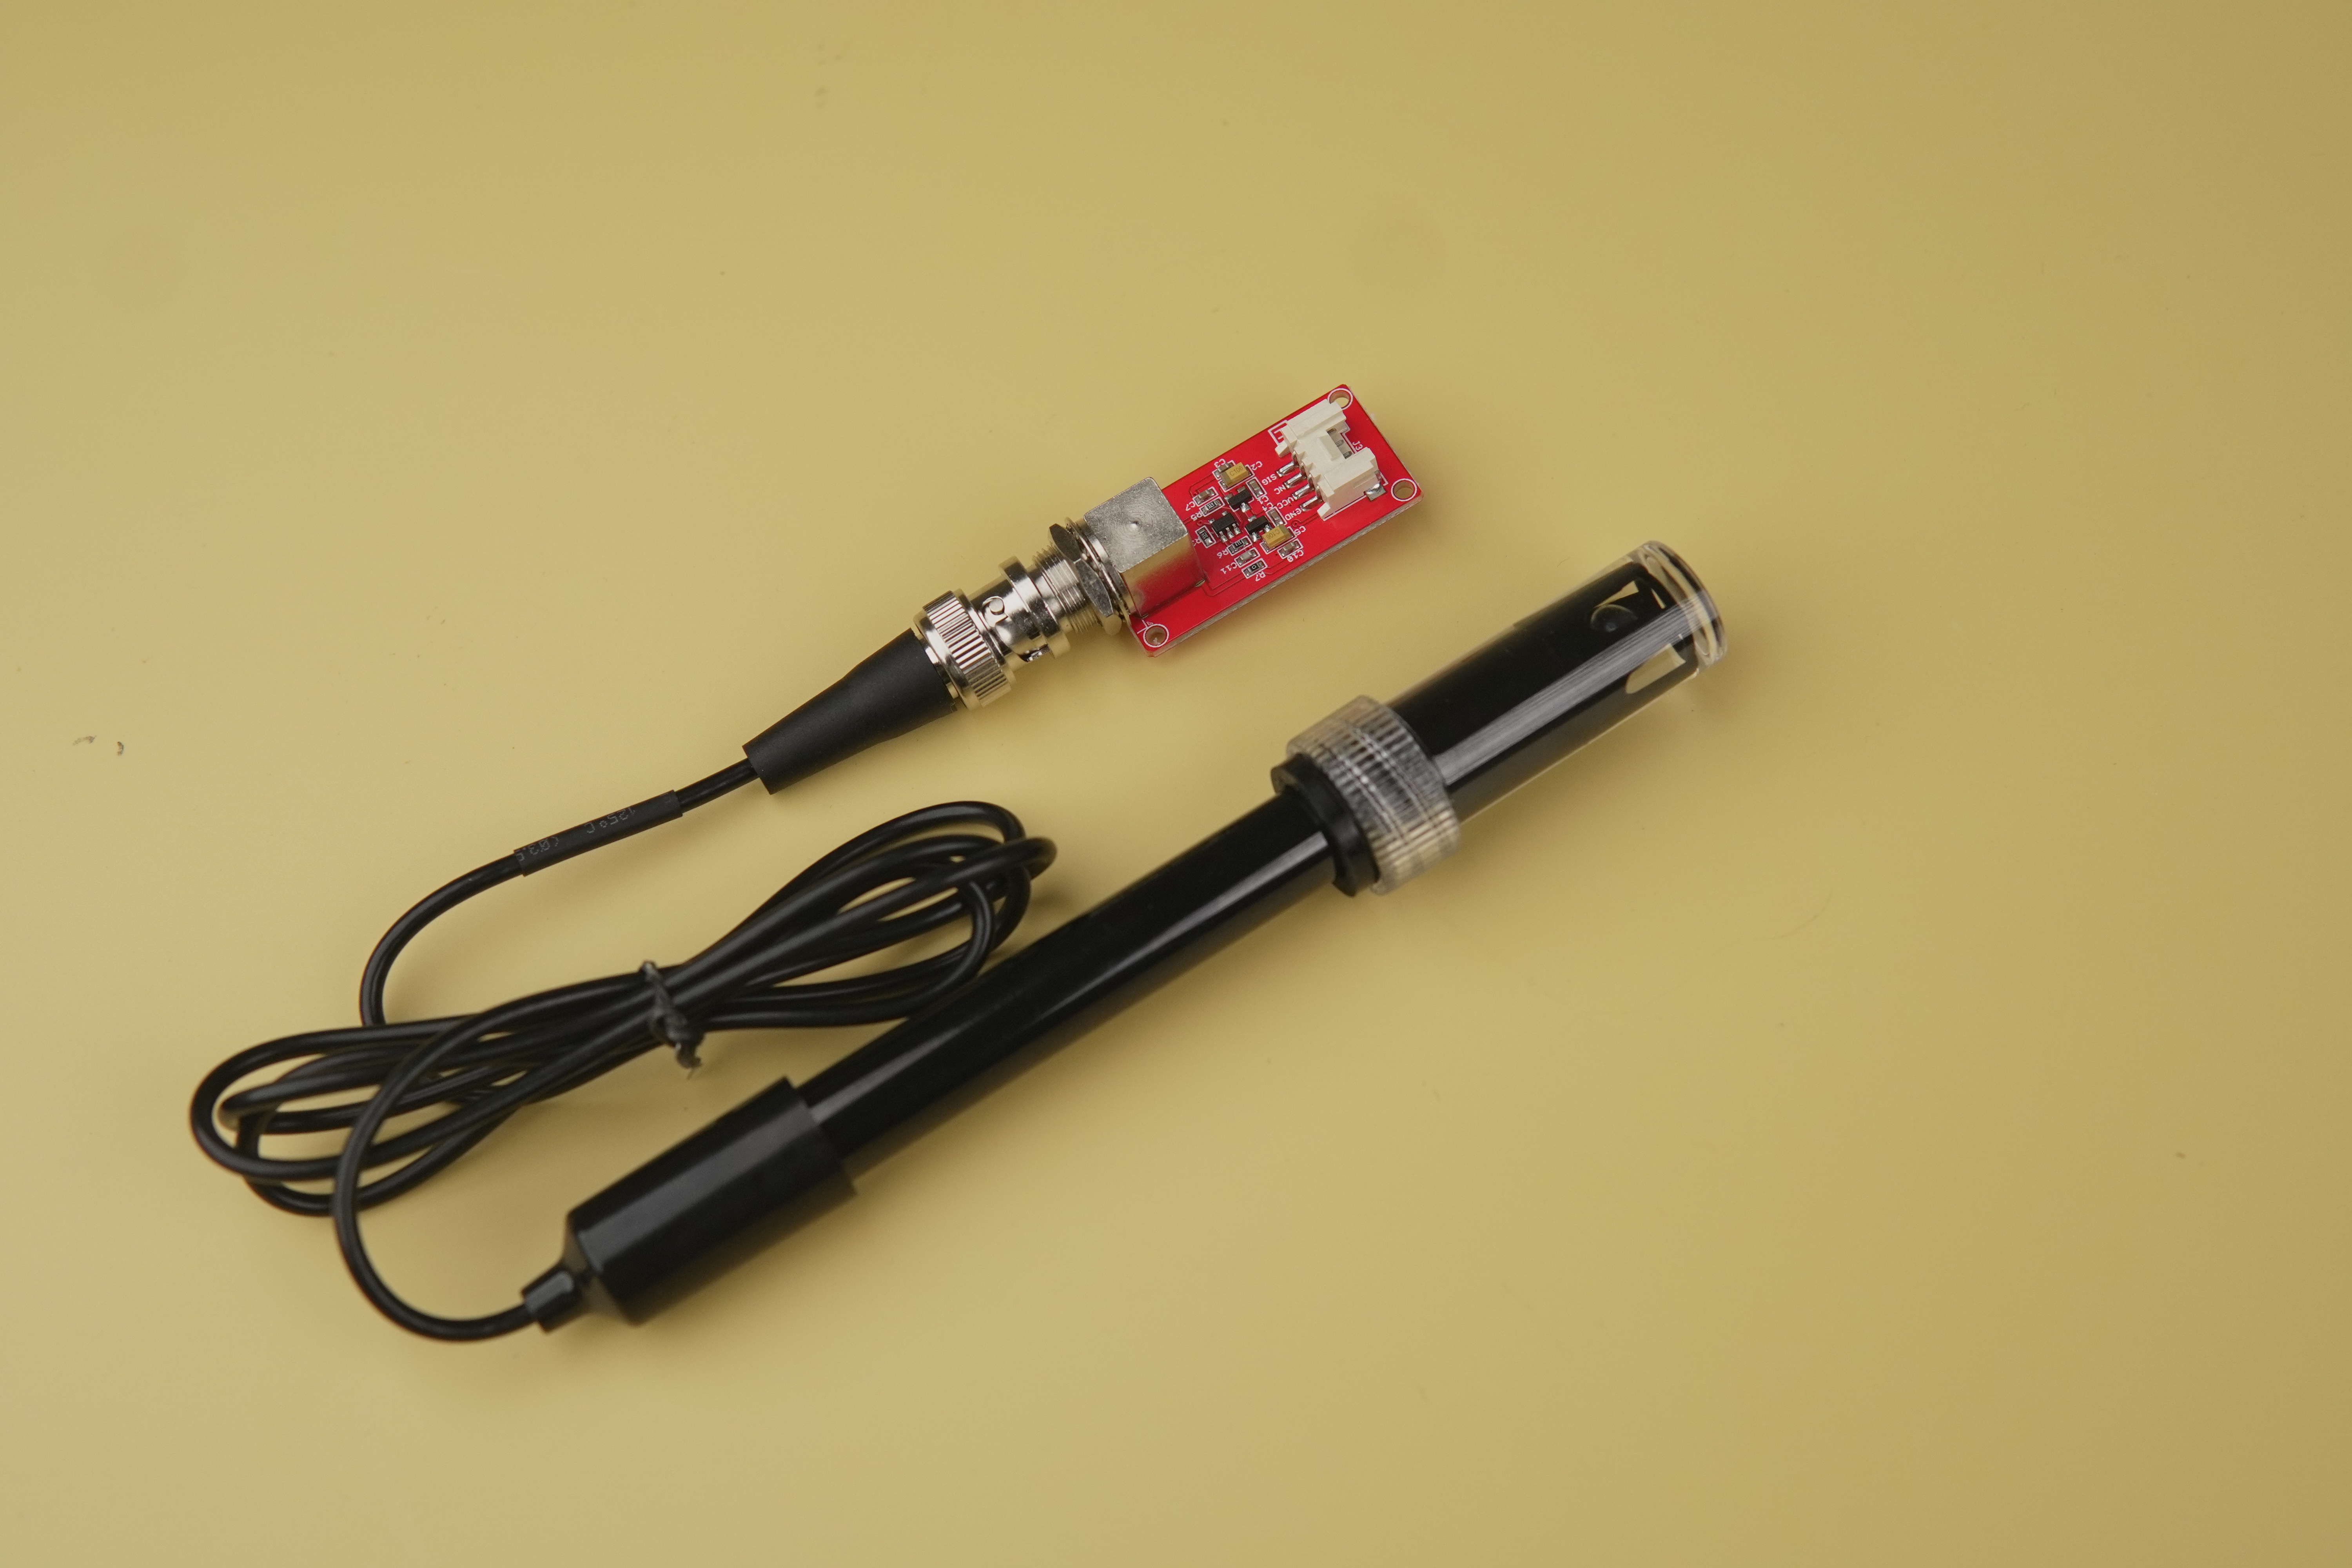
The pH sensor is employed to measure the acidity or alkalinity of water, a fundamental indicator of water quality across various aquatic environments. It functions by detecting voltage changes resulting from hydrogen ion concentration in the solution.
In most aquatic habitats, maintaining a pH level between 6.5 and 8.5 is essential for promoting growth, ensuring proper oxygen availability, and minimizing ammonia toxicity. Its plug-and-play design and compatibility with micro-controllers make it user-friendly for both beginners and professionals. Additionally, the use of the DFRobot pH library simplifies data processing, ensuring accurate and reliable pH readings for the project.
Turbidity Sensor
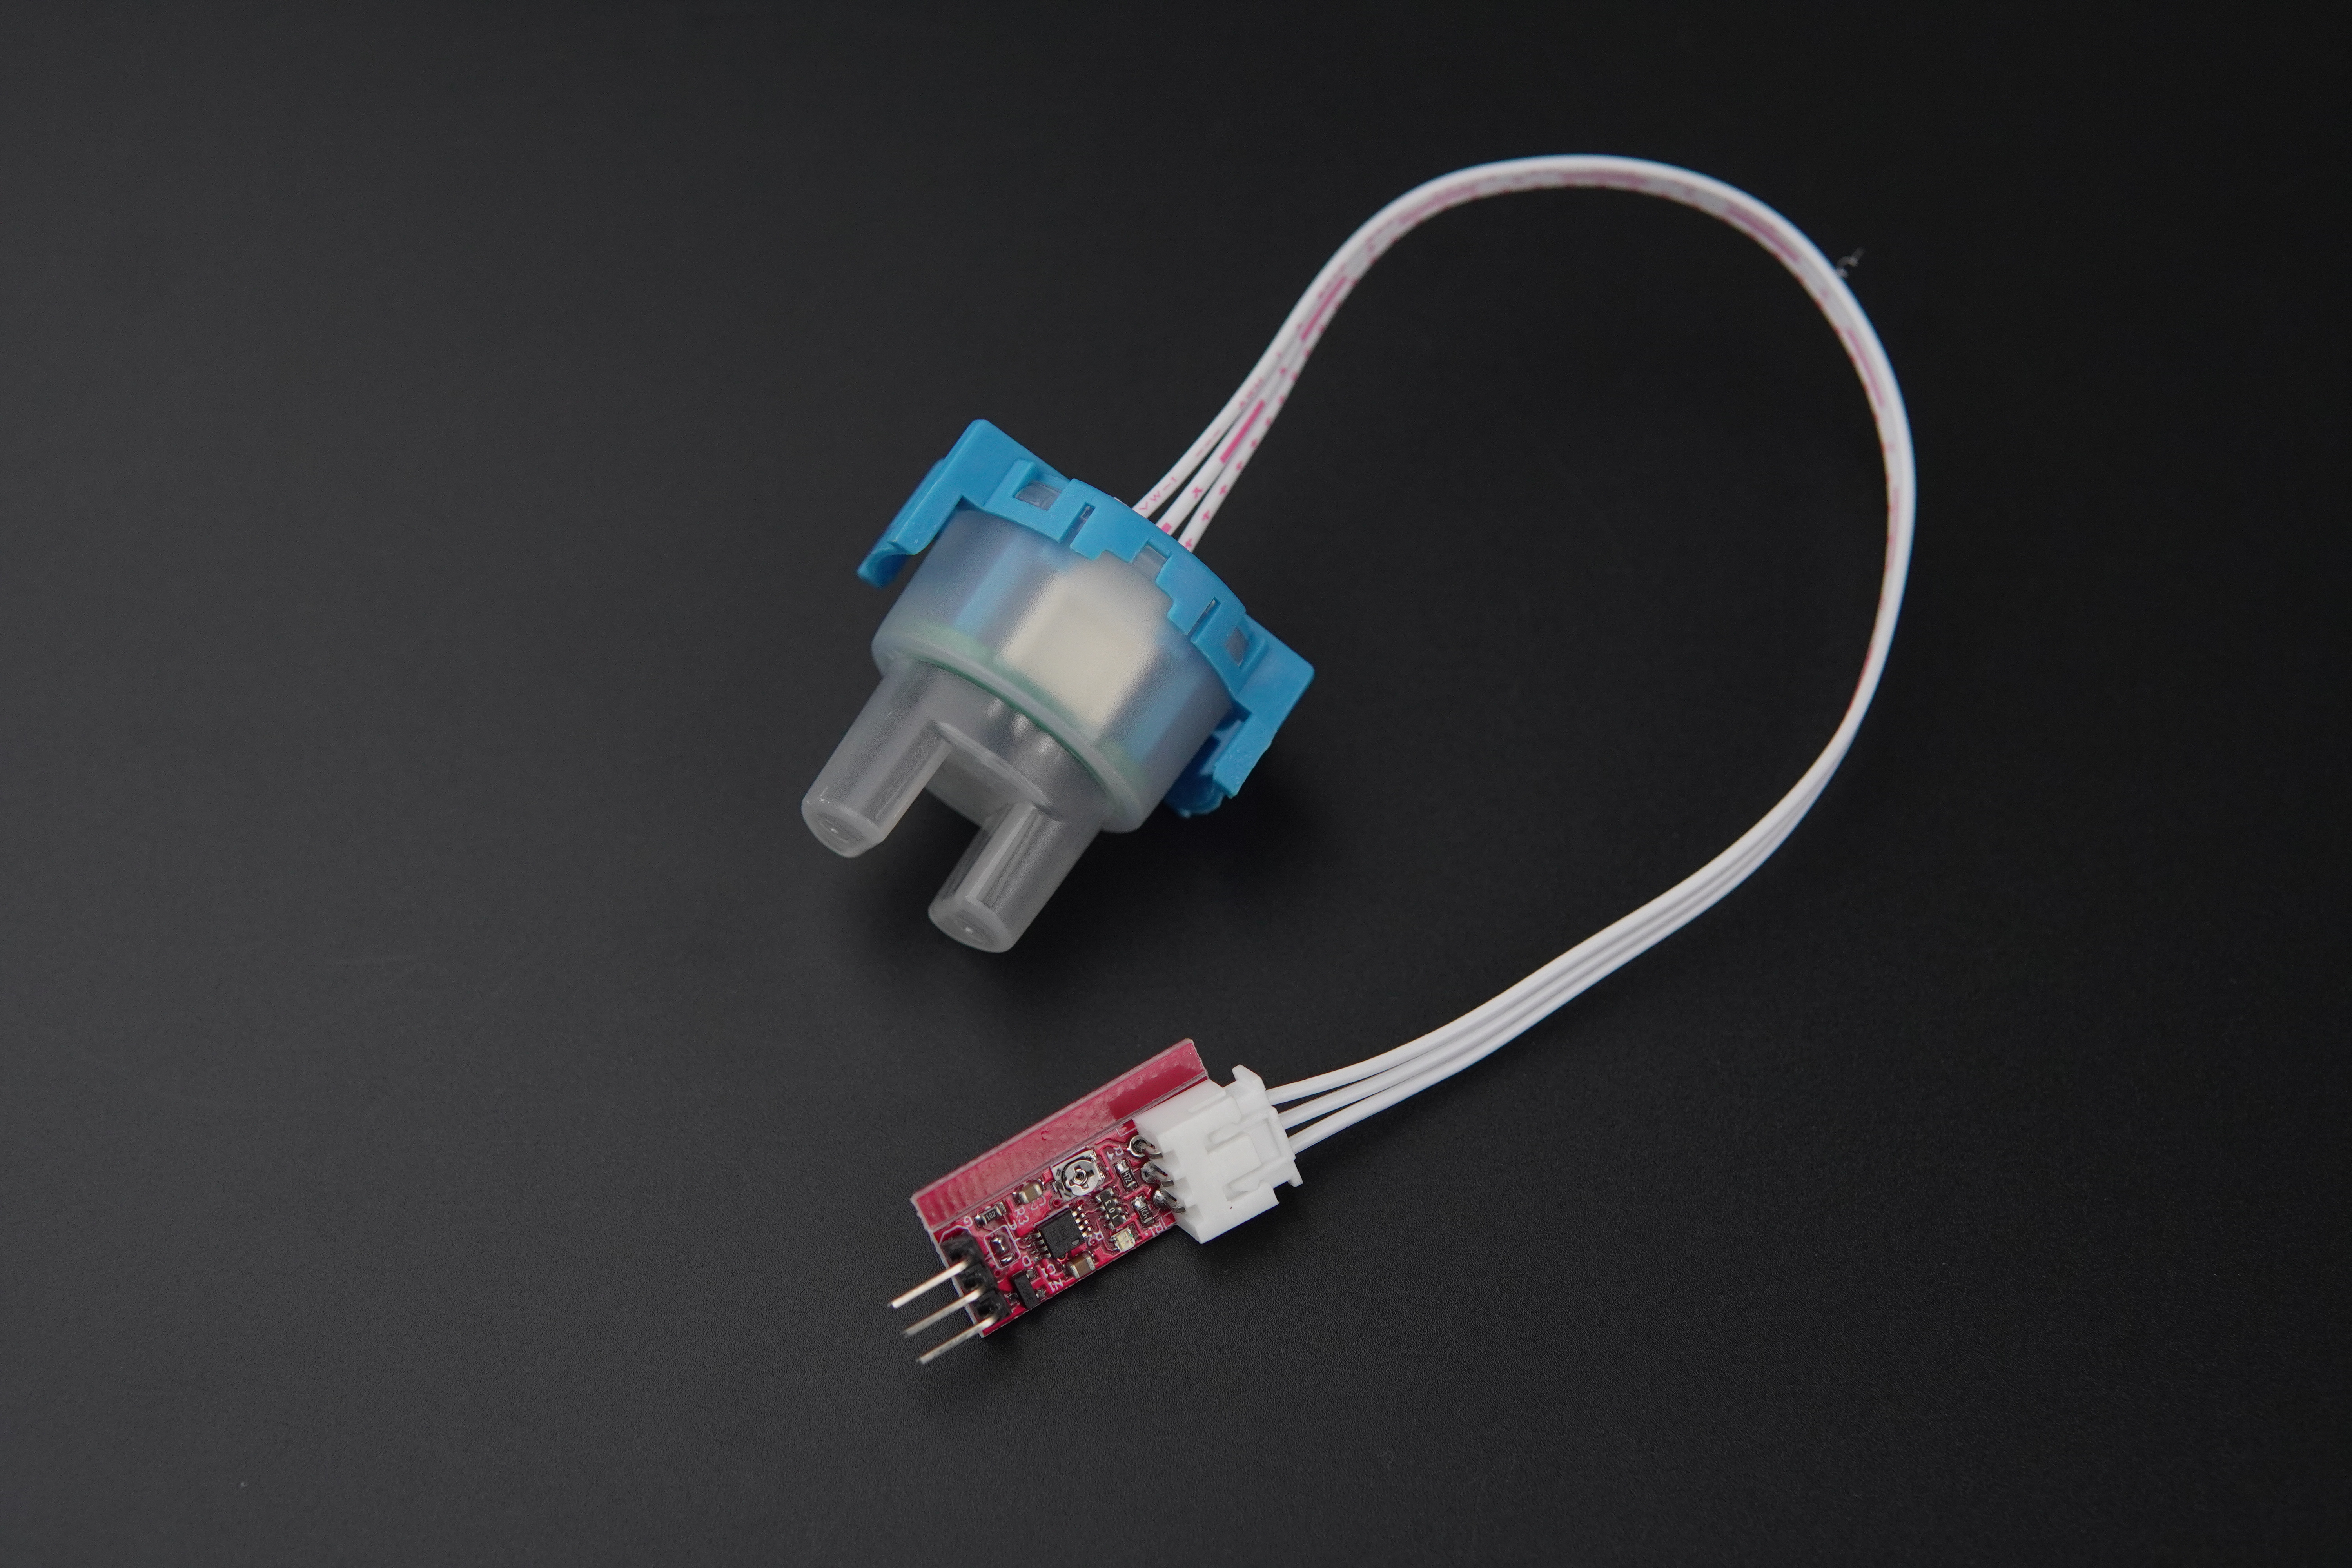
The turbidity sensor measures water clarity by detecting the amount of light scattered by suspended particles in the water. High turbidity reduces light penetration, limiting photosynthesis in aquatic plants and decreasing oxygen production.
Excessive suspended particles in water can negatively impact aquatic organisms by interfering with respiration, reducing light penetration, and increasing stress levels. High turbidity not only limits visibility—affecting behaviors such as feeding and navigation—but also often signals the accumulation of organic matter, which may promote harmful bacterial growth and degrade overall water quality. Regular monitoring of turbidity levels enables timely interventions, such as improving filtration or adjusting aeration, to ensure a stable and healthy aquatic environment for diverse species and ecosystems.
The code reads analog voltage from the turbidity sensor 800 times and converts it into a calibrated voltage value. This voltage is then used in a formula to calculate turbidity (NTU), ensuring values stay within the 0–2000 range. Finally, the voltage and NTU values are displayed on the Serial Monitor to help monitor water clarity.
TDS Sensor
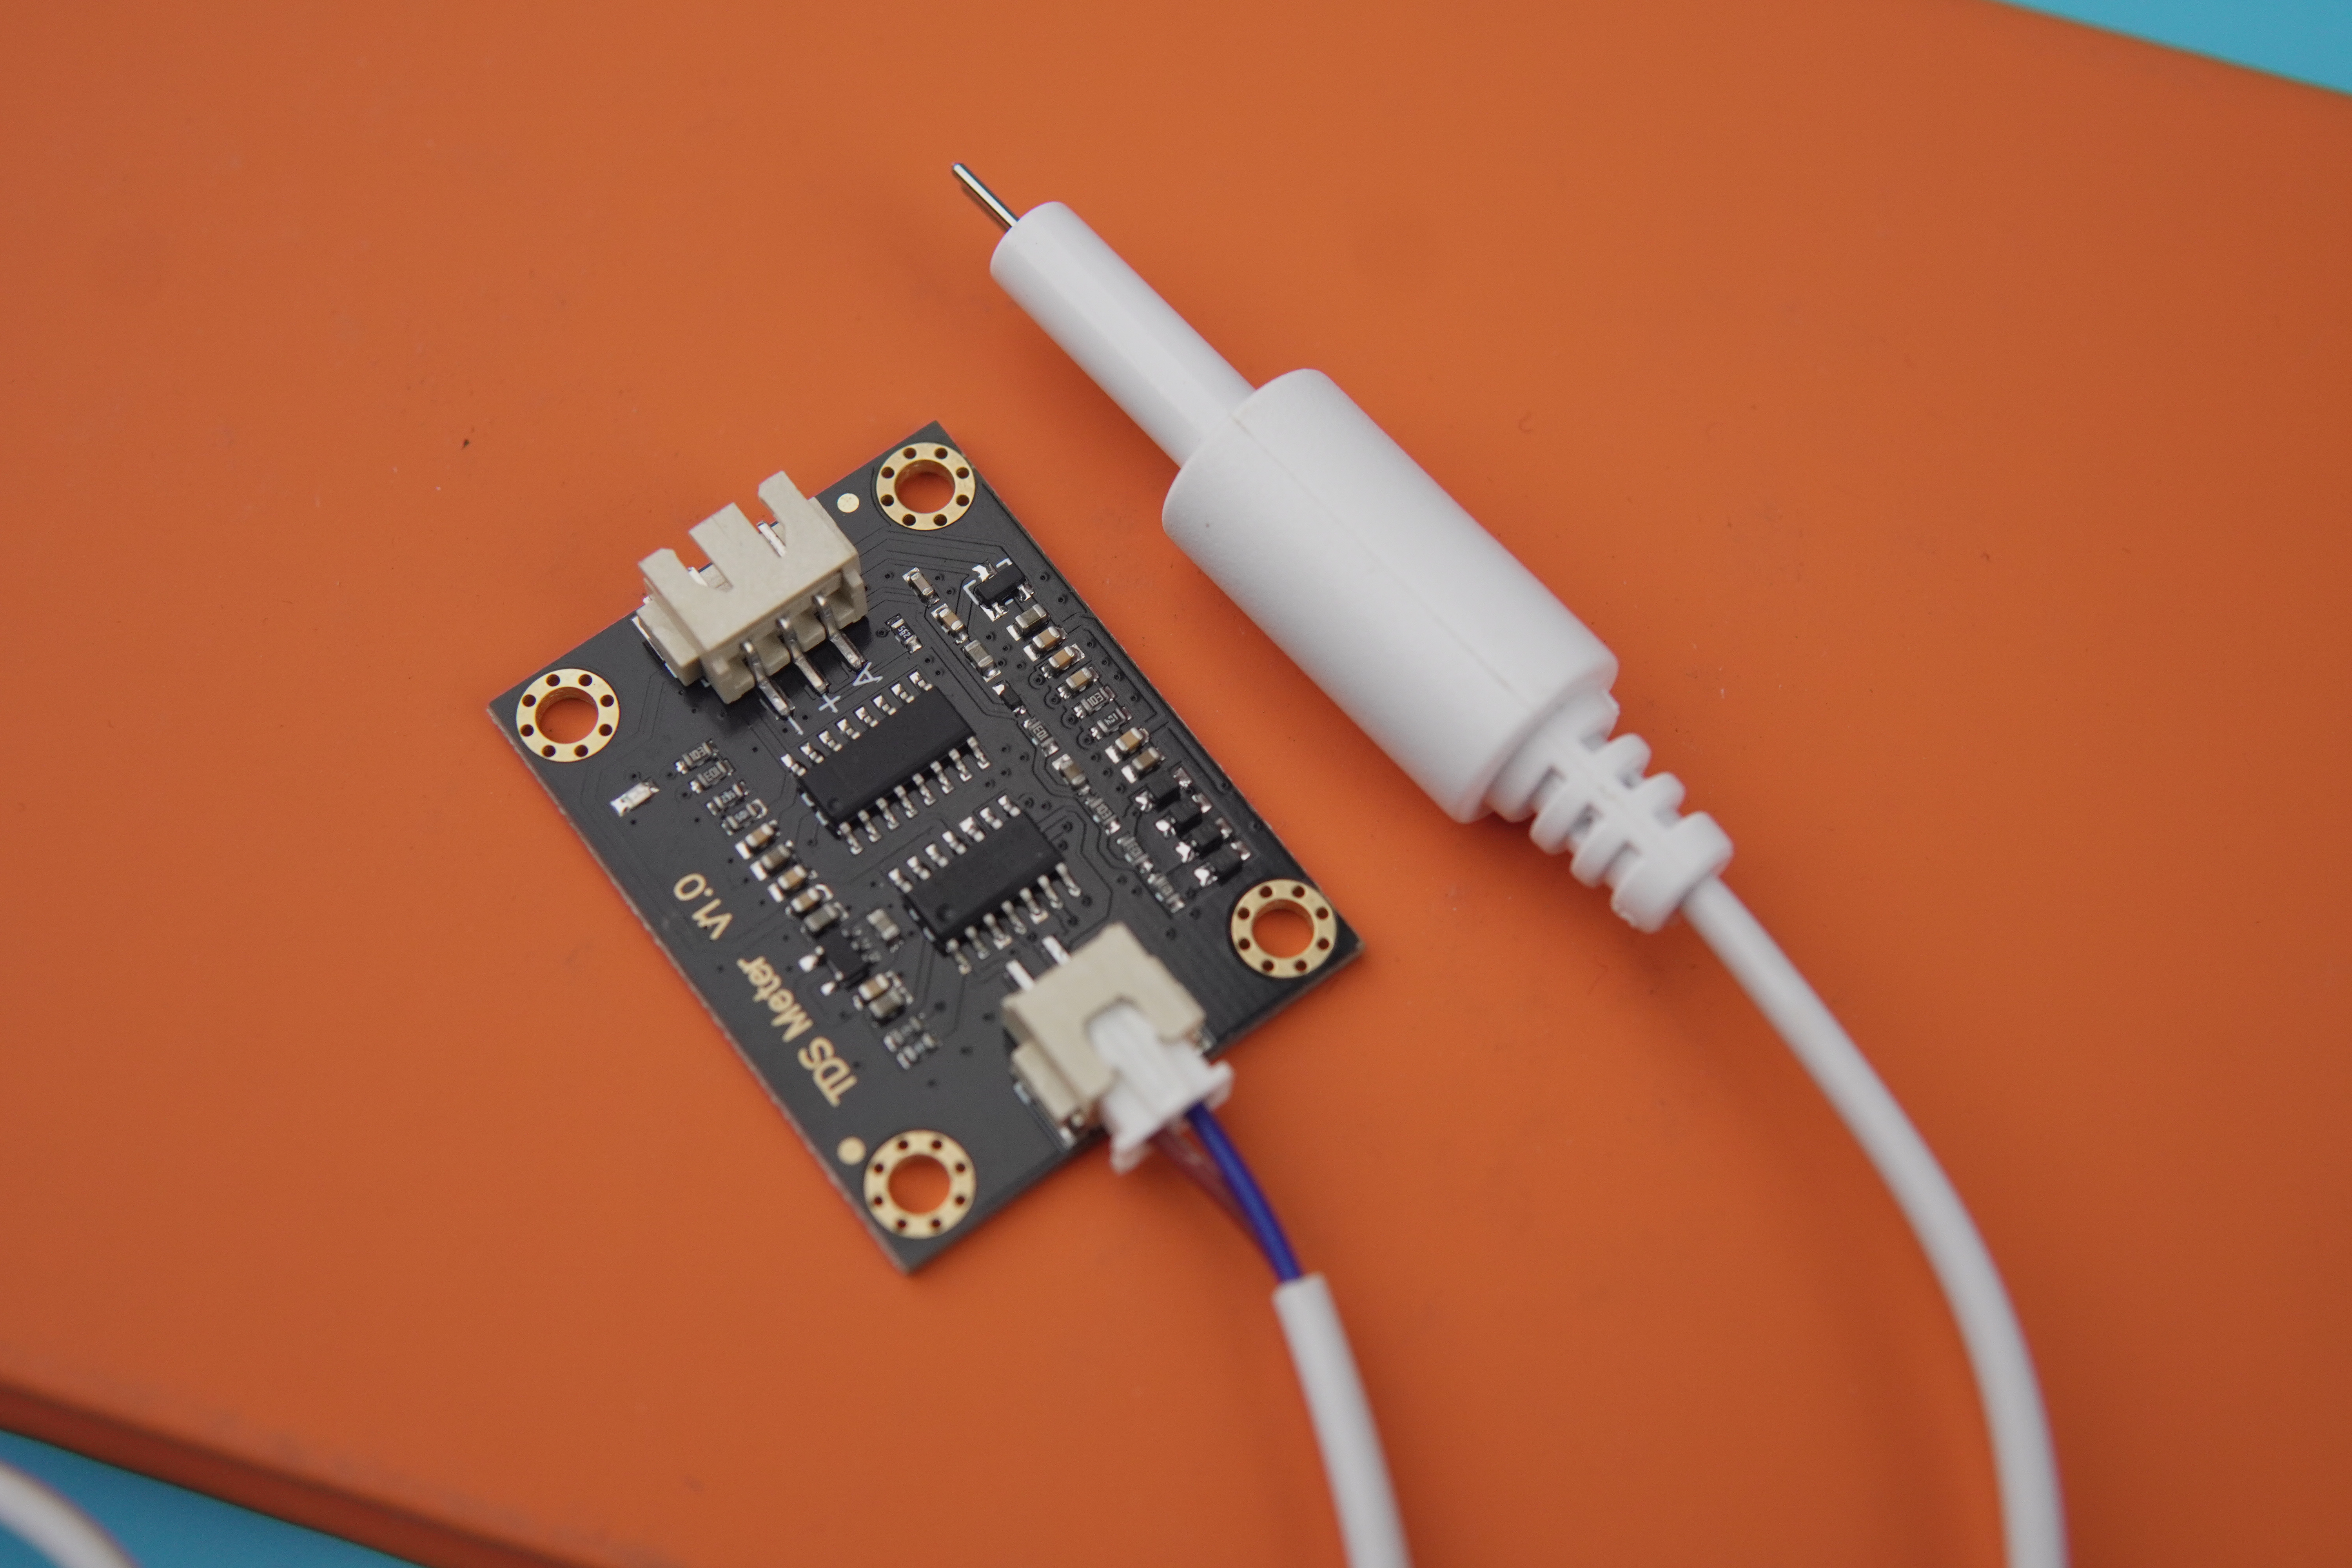
The TDS (Total Dissolved Solids) sensor measures the concentration of dissolved substances in water by detecting its electrical conductivity. Higher conductivity typically indicates increased levels of minerals, salts, and organic matter. These parameters are critical in aquatic environments, as they influence water chemistry and can impact the physiological balance of aquatic organisms. Elevated TDS can disrupt osmoregulation—the process by which aquatic species manage internal salt and water levels—potentially leading to stress and impaired biological functions.
Poor water quality due to excessive dissolved solids may also cause gill irritation, hinder oxygen absorption, and increase the risk of infections. On the other hand, very low TDS readings can suggest a shortage of essential nutrients and minerals needed for growth and metabolic processes. Regular monitoring of TDS levels allows timely intervention and helps maintain stable, healthy water conditions that support the well-being of a wide variety of aquatic life, from fish to invertebrates.
Dissolved Oxygen Sensor
Dissolved oxygen refers to the extent of free, non-compound oxygen present in water or other liquids. It’s one of the most important parameters when assessing water quality due to its influence on the organisms living within a body of water. A DO level that’s too high or too low can harm aquatic life and affect water quality. The dissolved oxygen sensor measures the concentration of oxygen in water using an electrochemical or optical method. It helps ensure sufficient oxygen levels for respiration.
There are three types of dissolved oxygen sensor measurements: galvanic, polarographic, and optical. We are using the galvanic dissolved oxygen sensor for this project due to its reliability and simplicity.
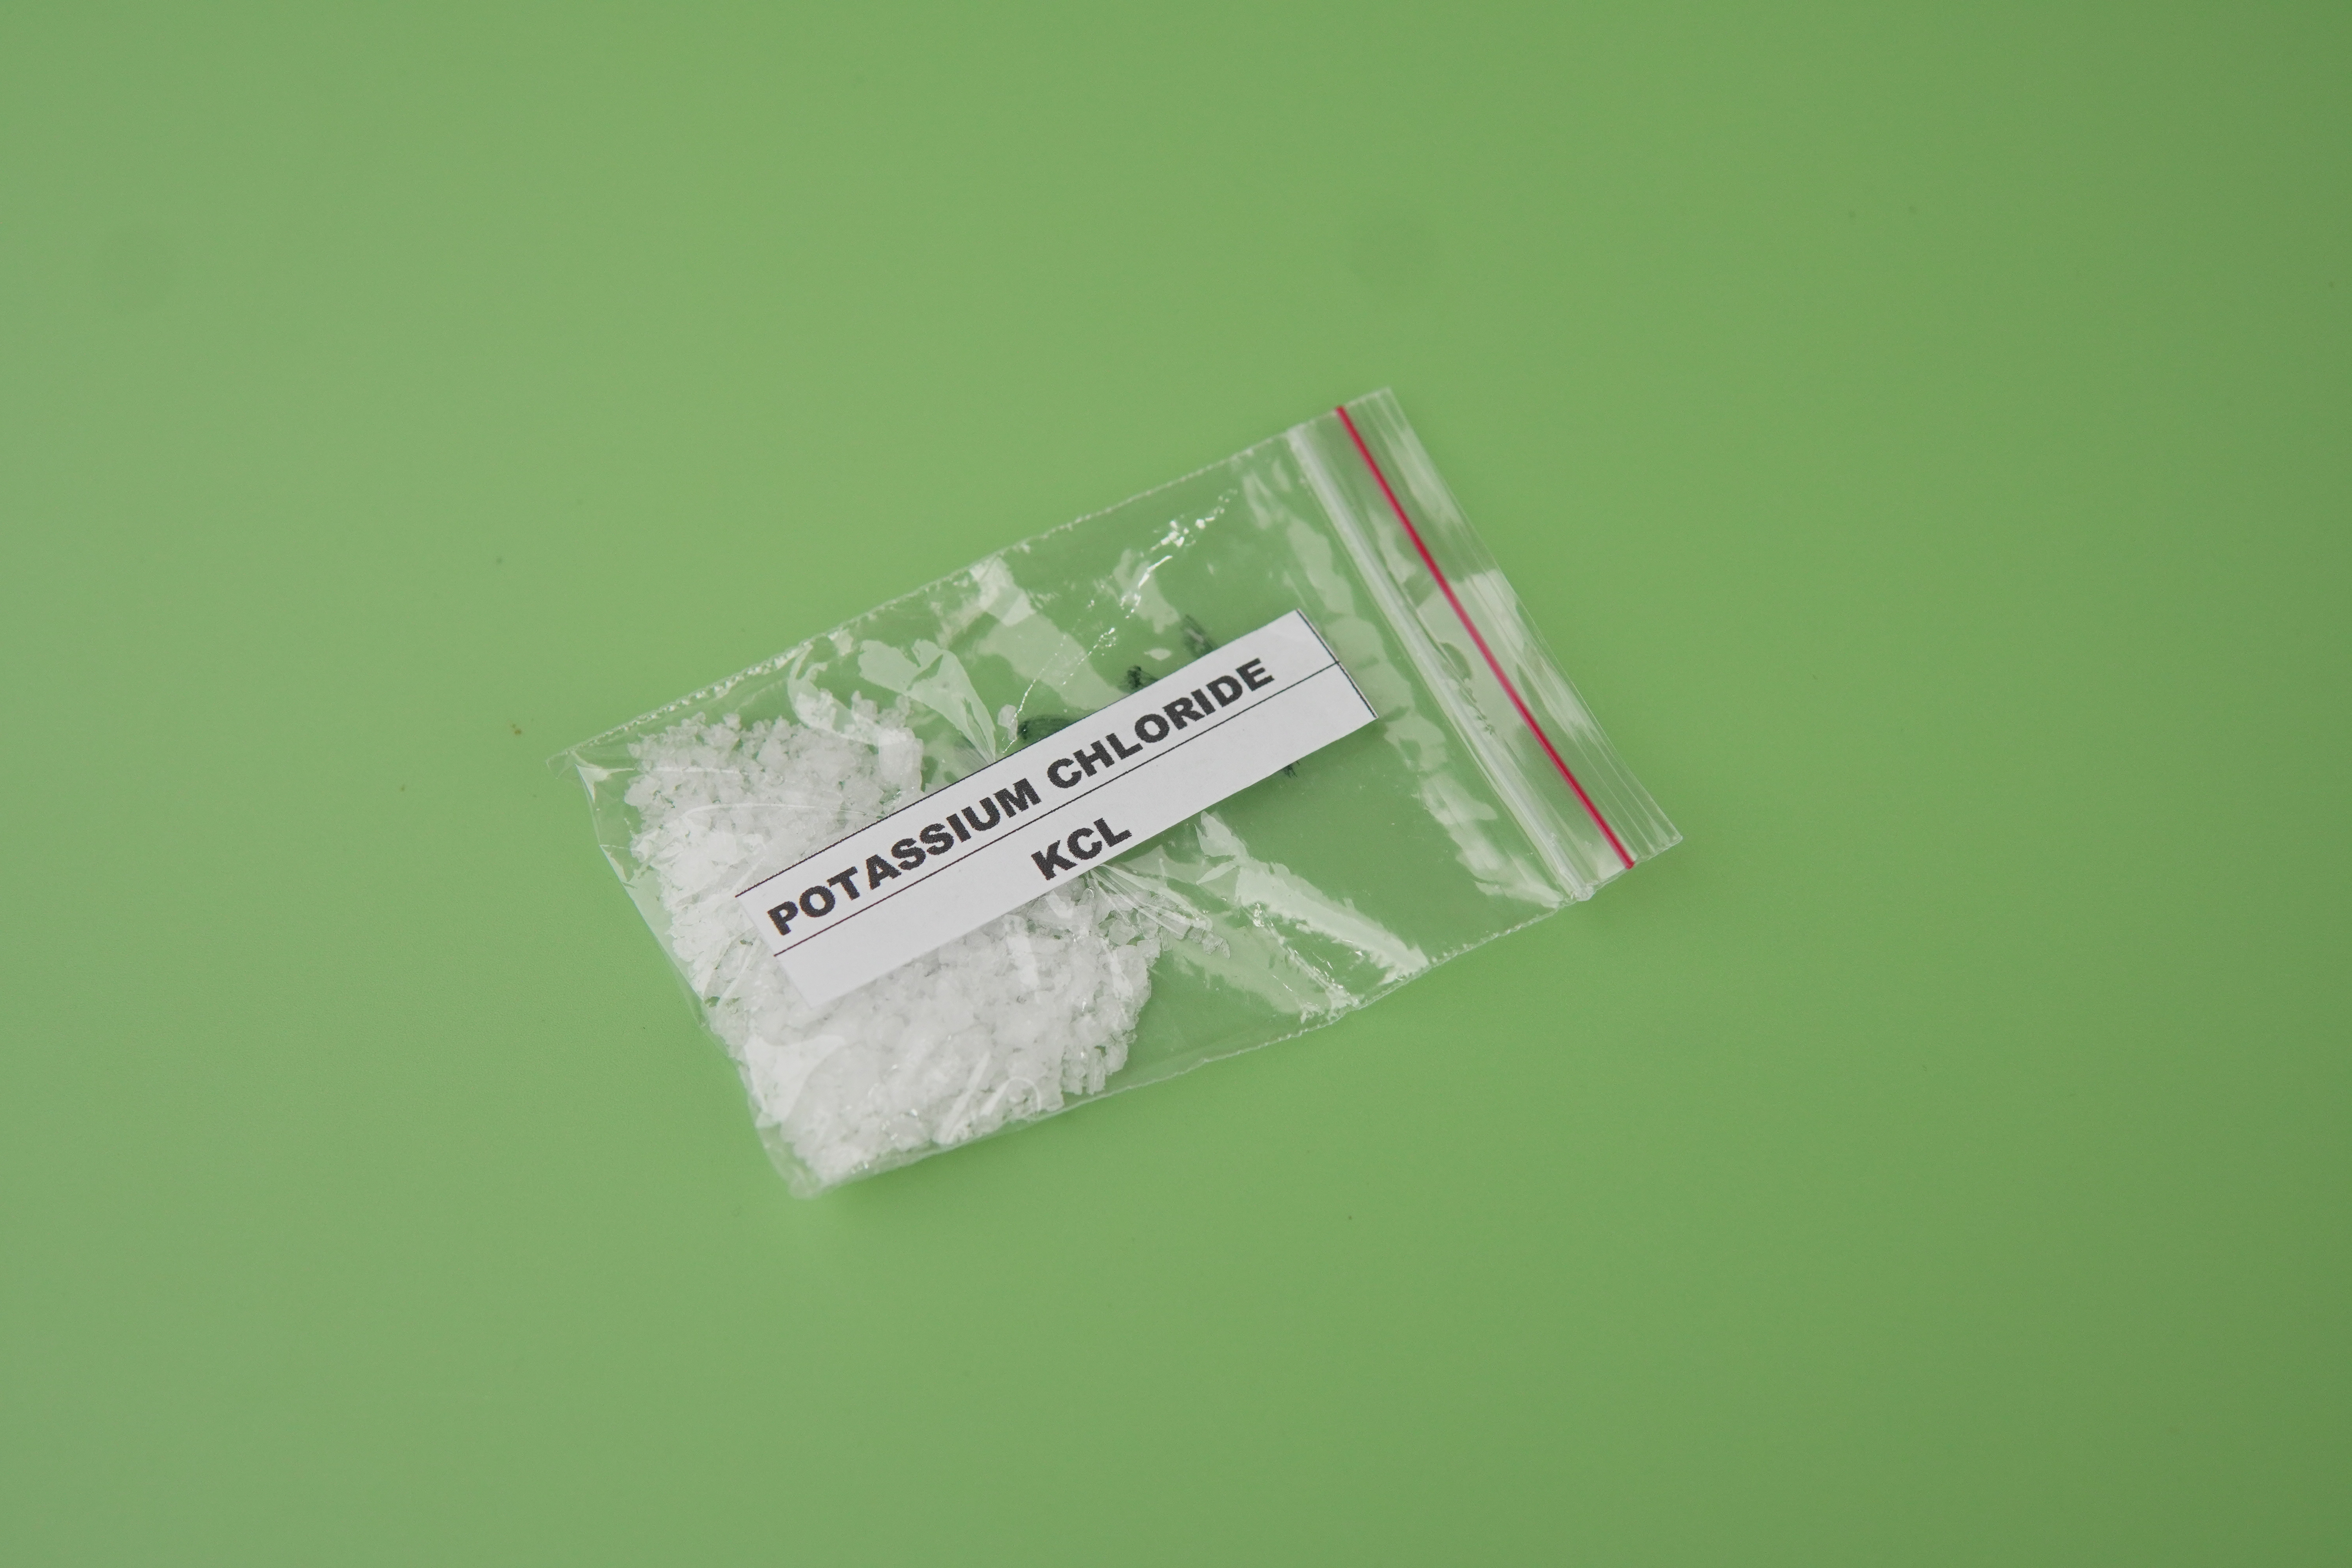
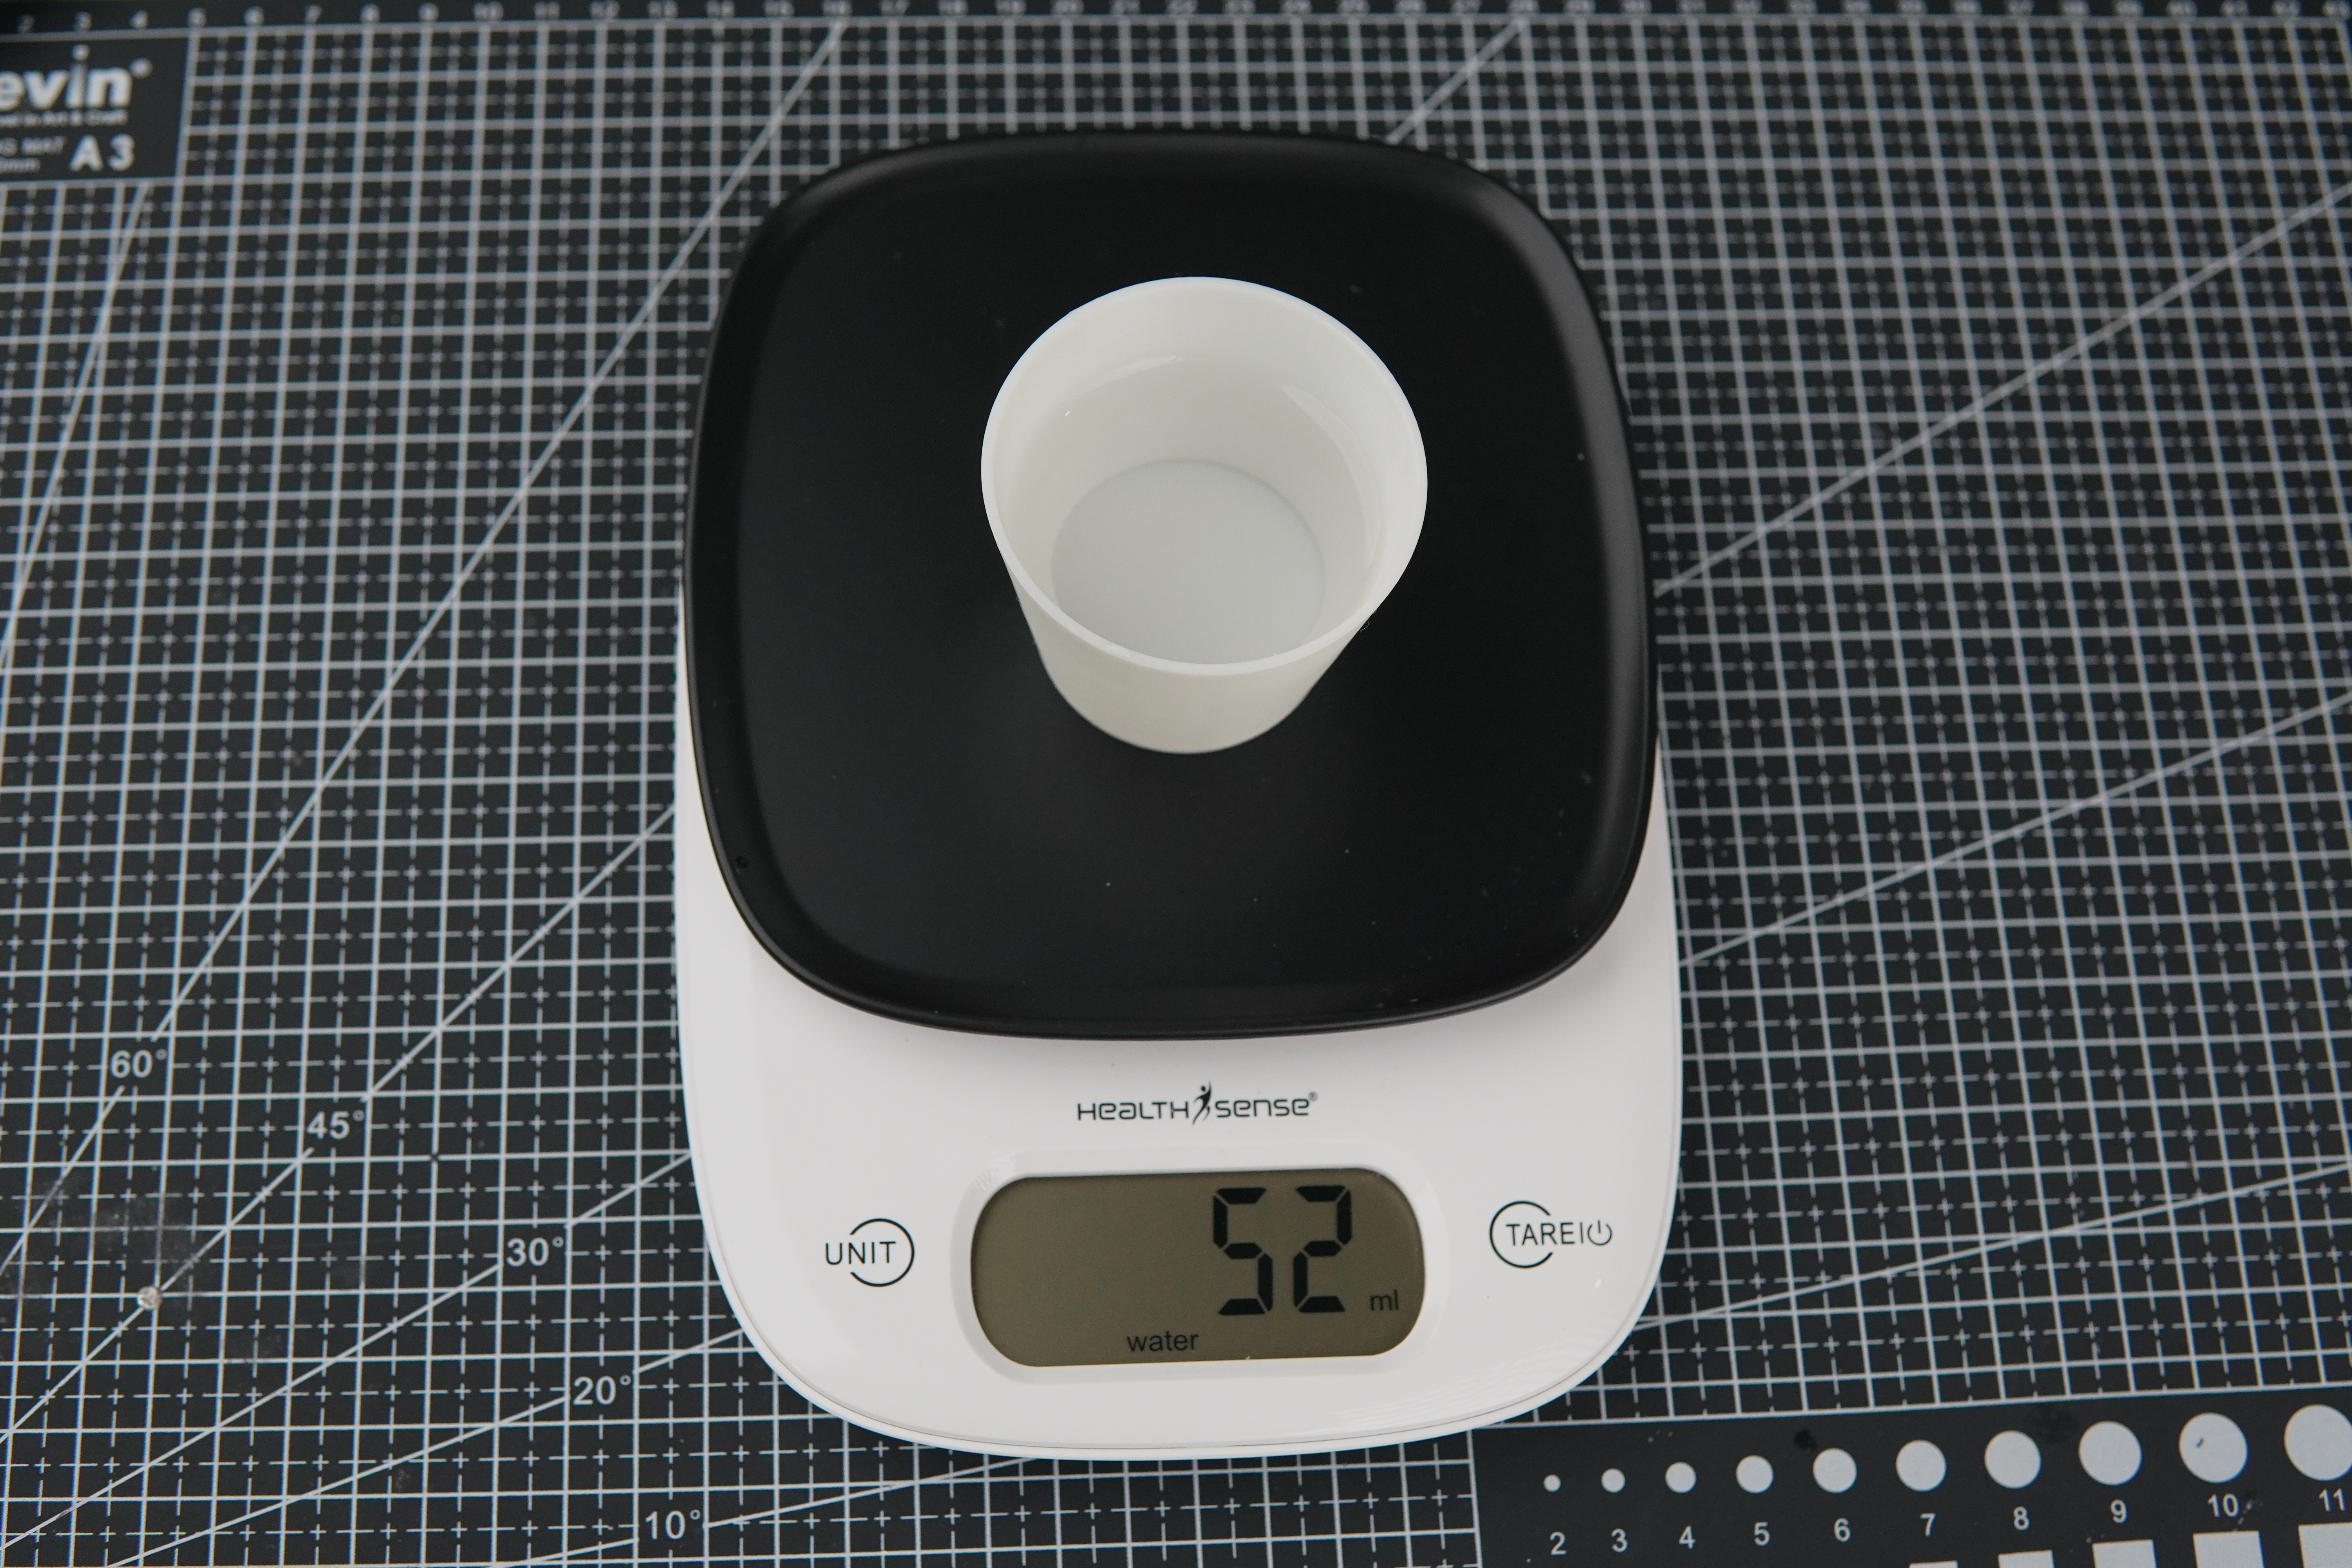
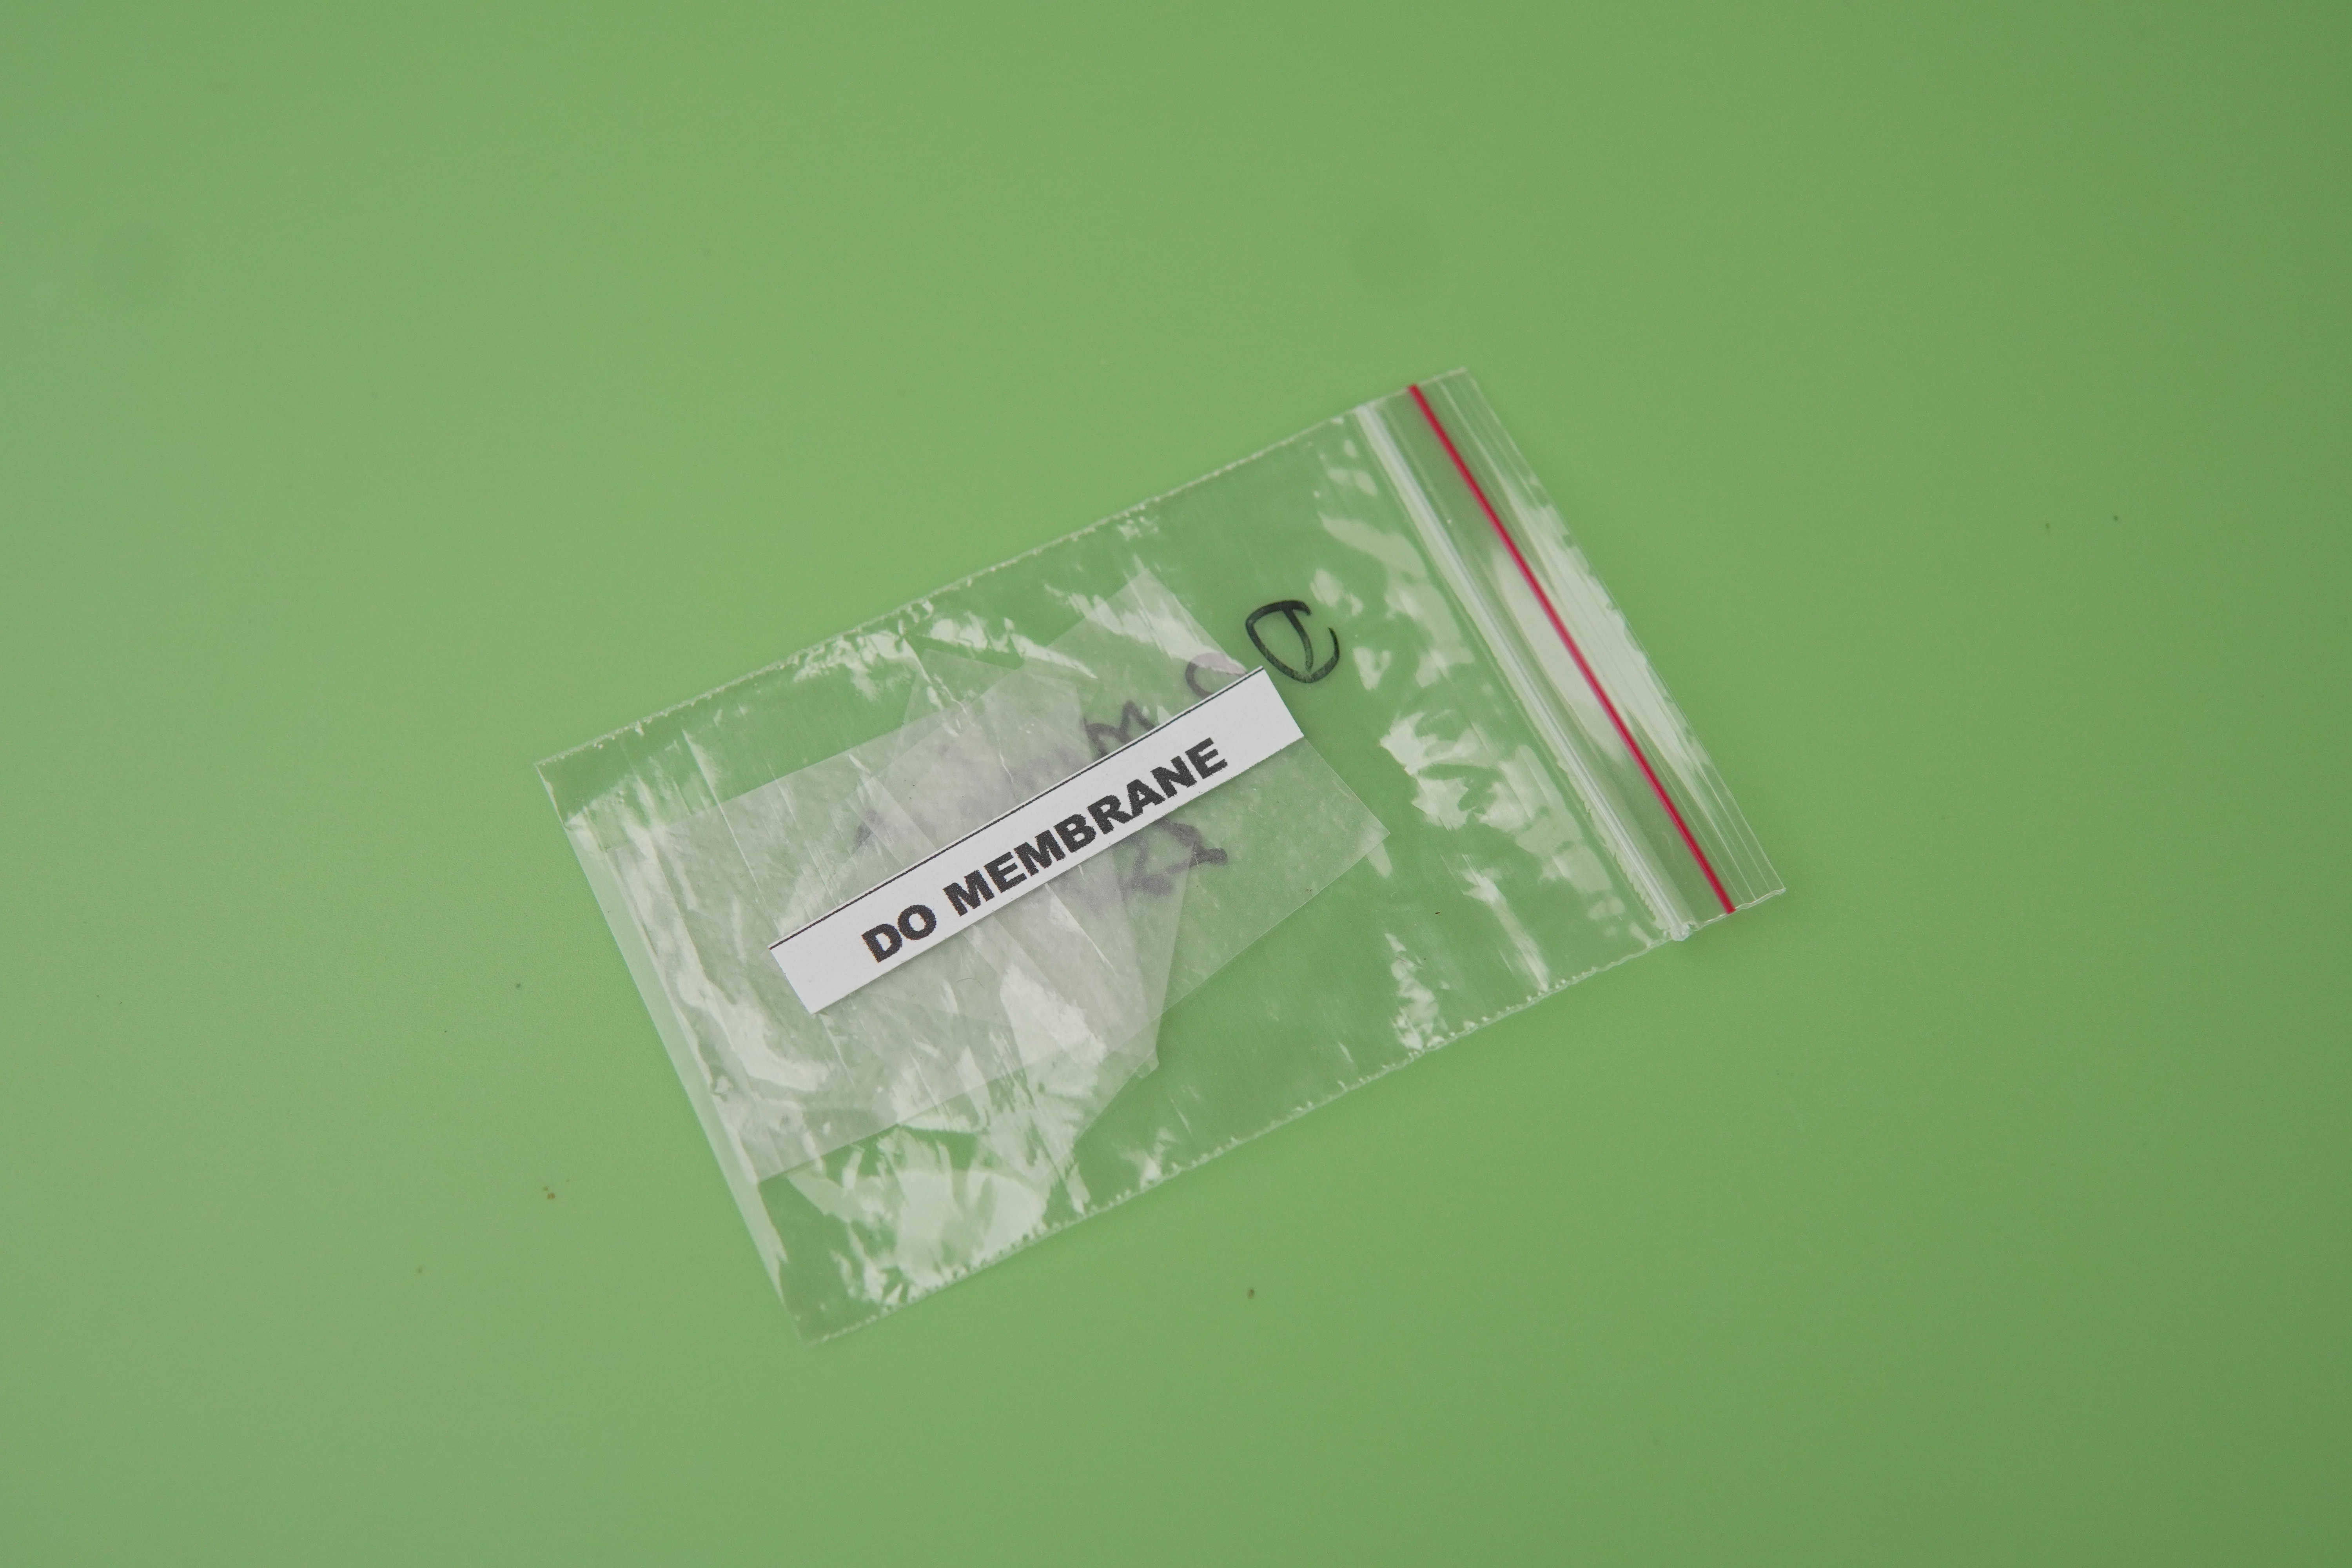
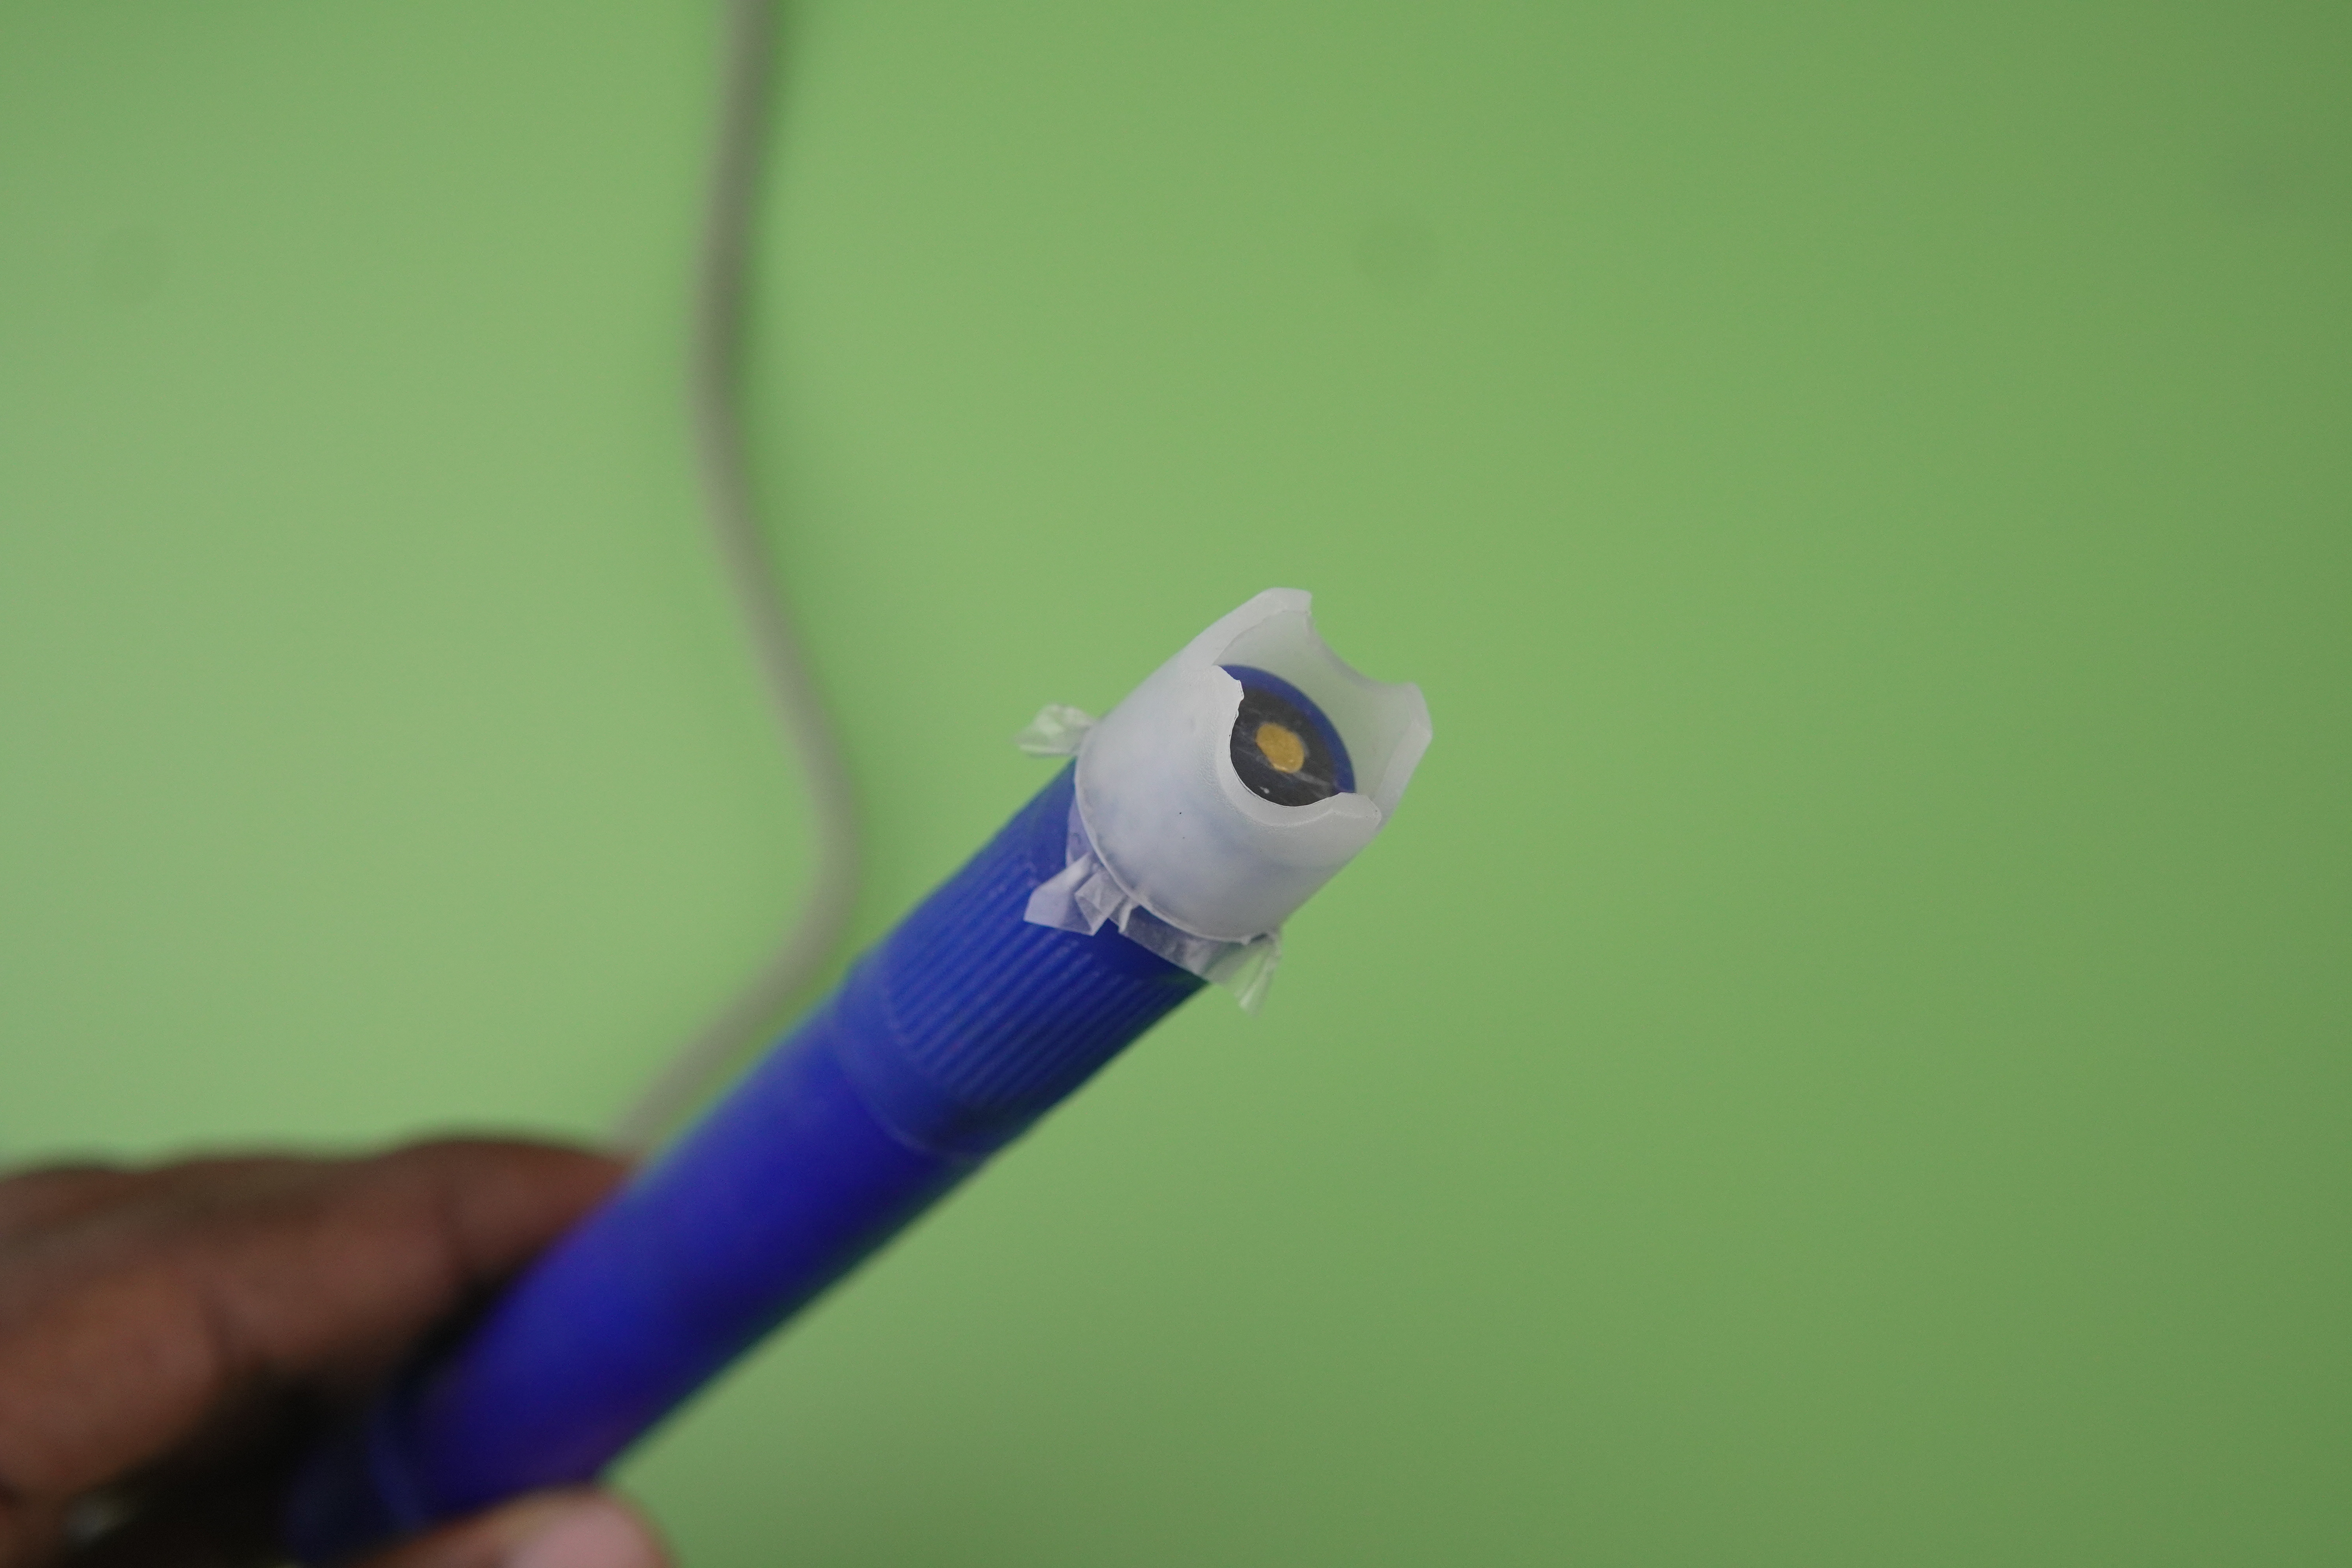
Before getting the Dissolved Oxygen Sensor probe to work, we need to prepare the probe. To prepare the probe, you need to dissolve approximately 4 grams of KCL crystals in 52 grams of water to create a 7.5% KCL solution.
Preparation includes adding 7.5% KCL solution into the membrane cap, ensuring the membrane is wrinkle-free, filling 2/3 of the cap with KCL, and securing the cap to eliminate air bubbles. The electrode tube should be free of air bubbles to prevent reading fluctuations. For detailed instructions, visit Dissolved Oxygen Probe Preparation.
We are using single-point calibration, which involves calibrating the saturated dissolved oxygen at a fixed temperature, suitable for stable temperature environments.
Use a LM35 temperature sensor to measure the temperature of the liquid and note down the value in °C. Next, wet the DO probe in the same liquid and gently shake off any excess water droplets to ensure the probe membrane is clean and hydrated. Then, expose the probe to air while maintaining natural airflow around it (avoid using a fan or artificial airflow). Wait for the output voltage from the DO probe to stabilize, and once stable, record the voltage. This voltage represents the saturated dissolved oxygen voltage at the current temperature. Use this recorded voltage value in your final code for calibration, as it corresponds to 100% dissolved oxygen saturation at the measured temperature.
Rain Sensor
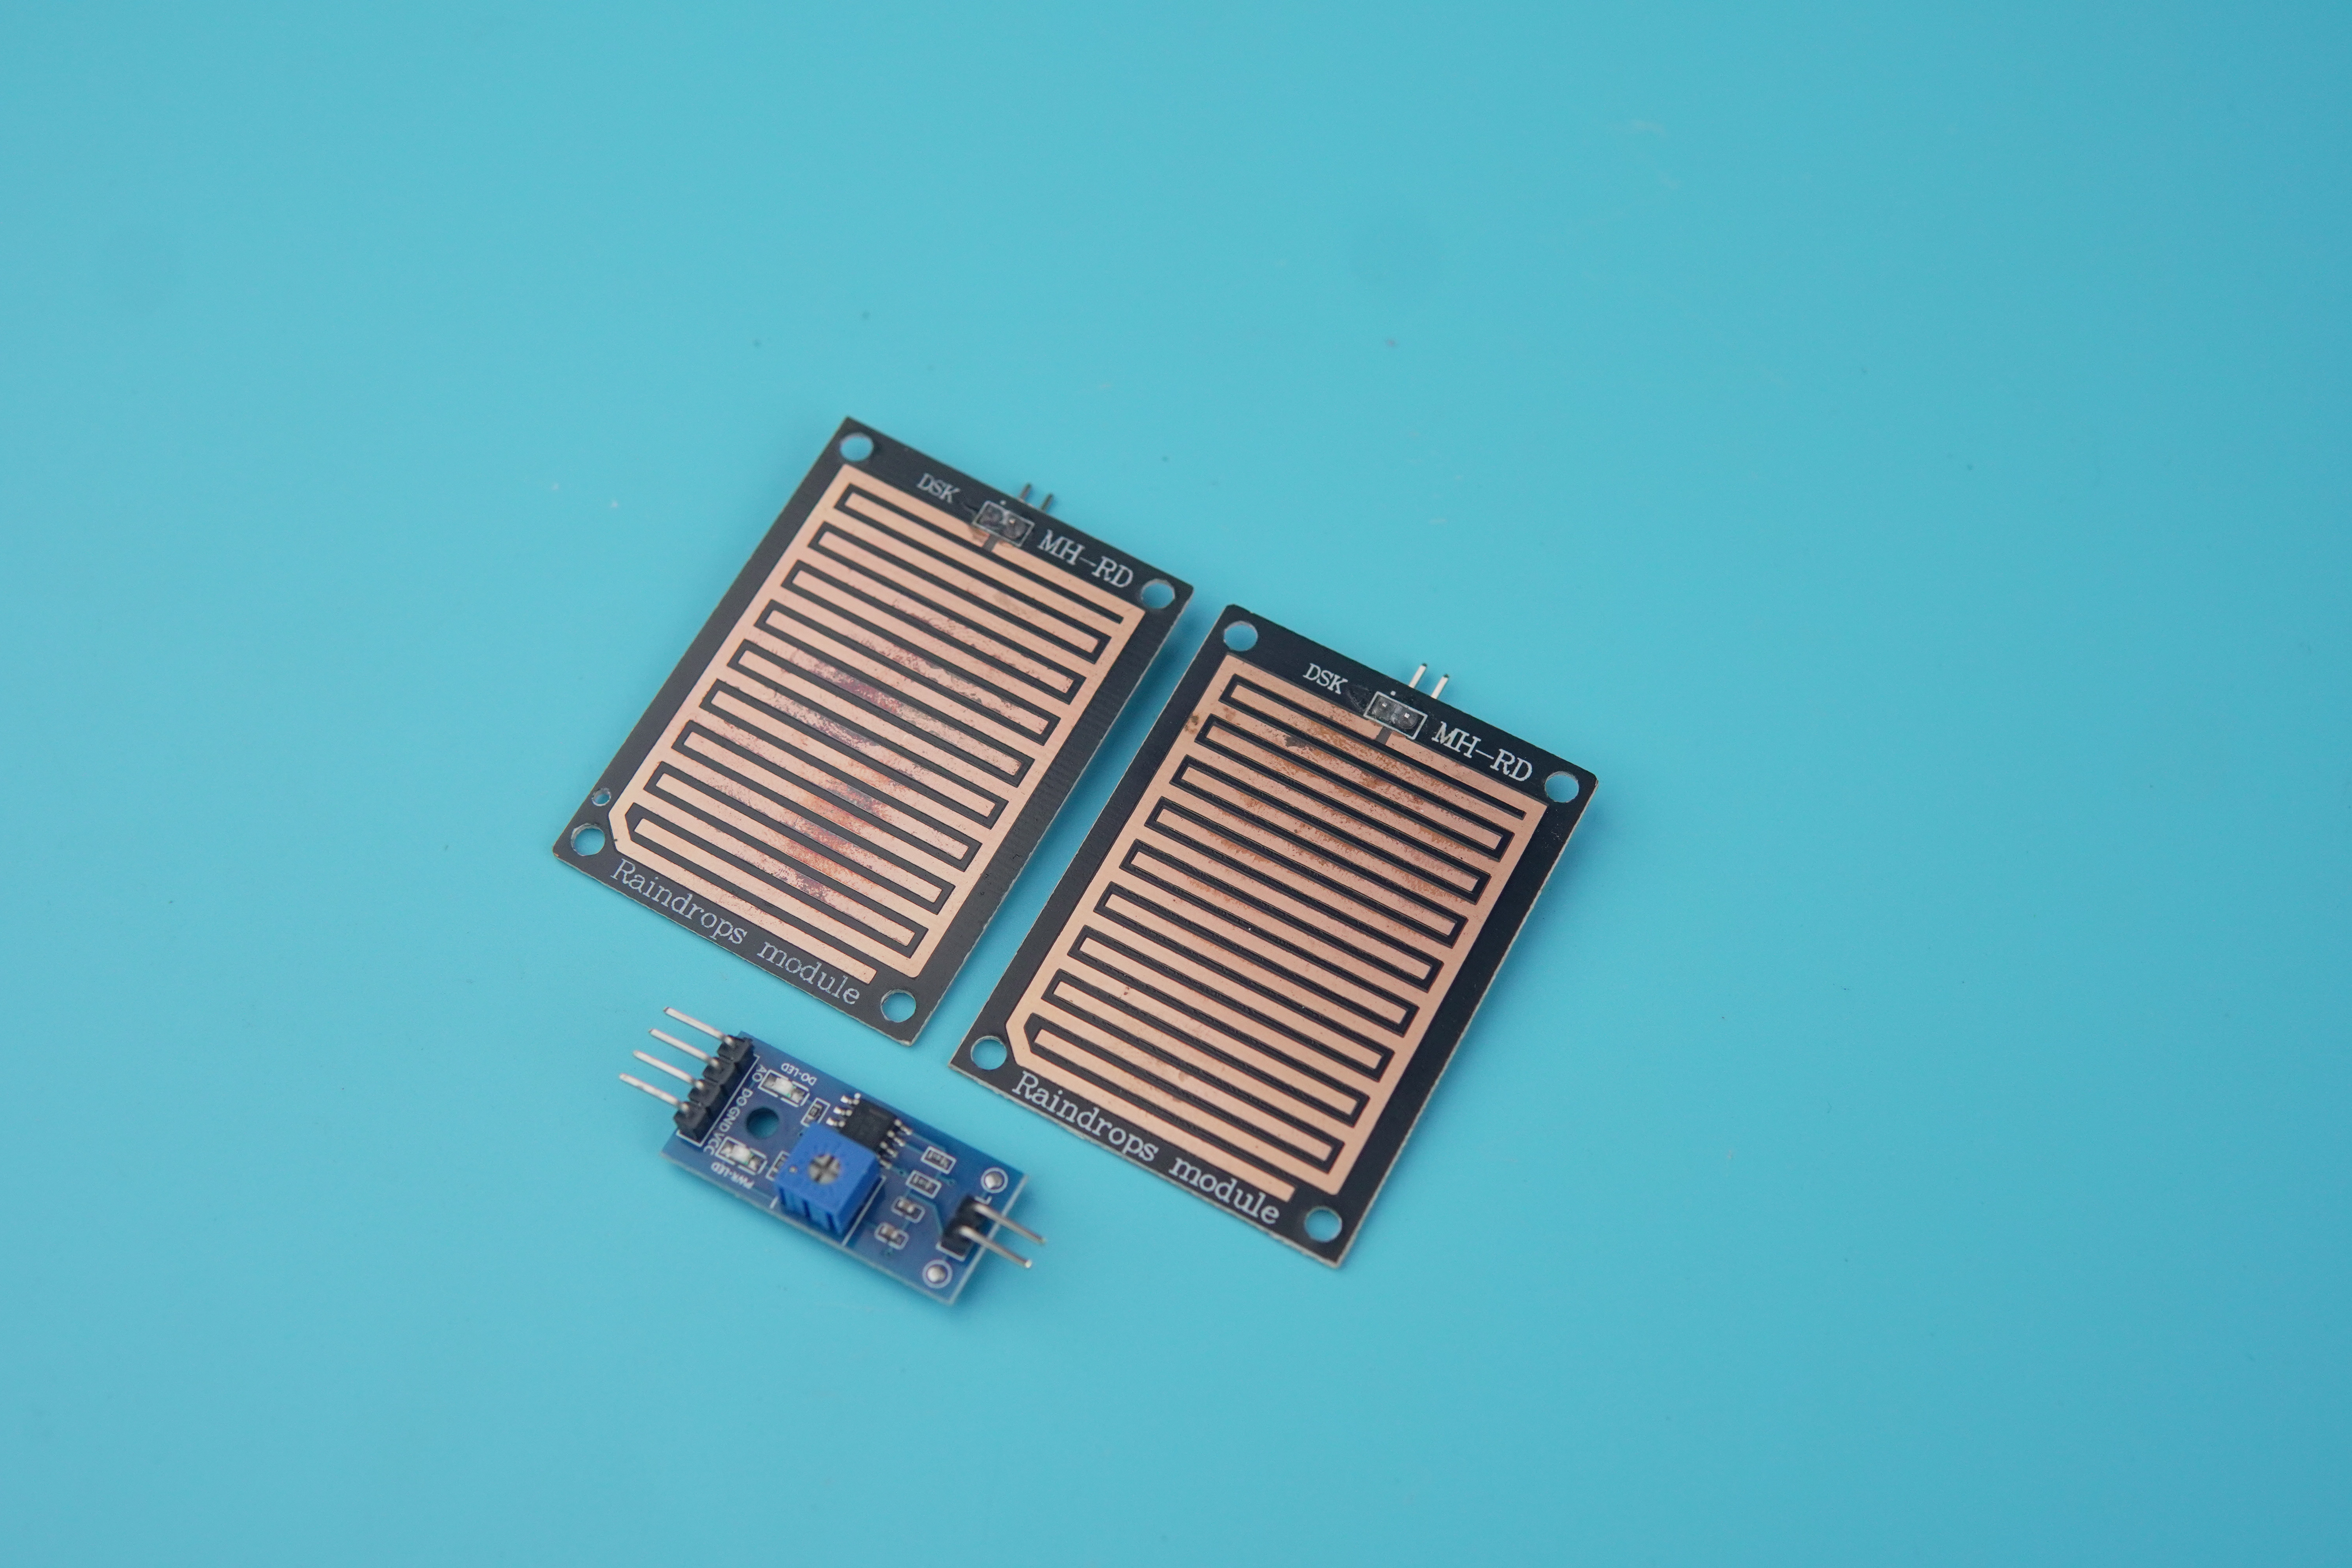
The rain sensor detects precipitation by measuring changes in electrical resistance across its conductive surface when water droplets make contact. This allows real-time monitoring of rainfall intensity and frequency, which is crucial in managing outdoor aquatic systems such as ponds, lakes, or aquaculture setups. Rainfall can lead to rapid shifts in environmental conditions—such as sudden drops in temperature, dilution of dissolved minerals, and reductions in salinity—that may disrupt the delicate balance required for aquatic life to thrive.
Heavy precipitation also contributes to increased turbidity by introducing sediment, organic debris, and pollutants into the water, which can degrade overall water quality. This in turn can reduce oxygen availability and elevate stress levels in aquatic organisms. By integrating a rain sensor into a monitoring system, users can receive timely data and alerts, enabling them to take proactive steps—such as adjusting filtration, aeration, or buffering strategies—to preserve a stable and healthy aquatic environment.
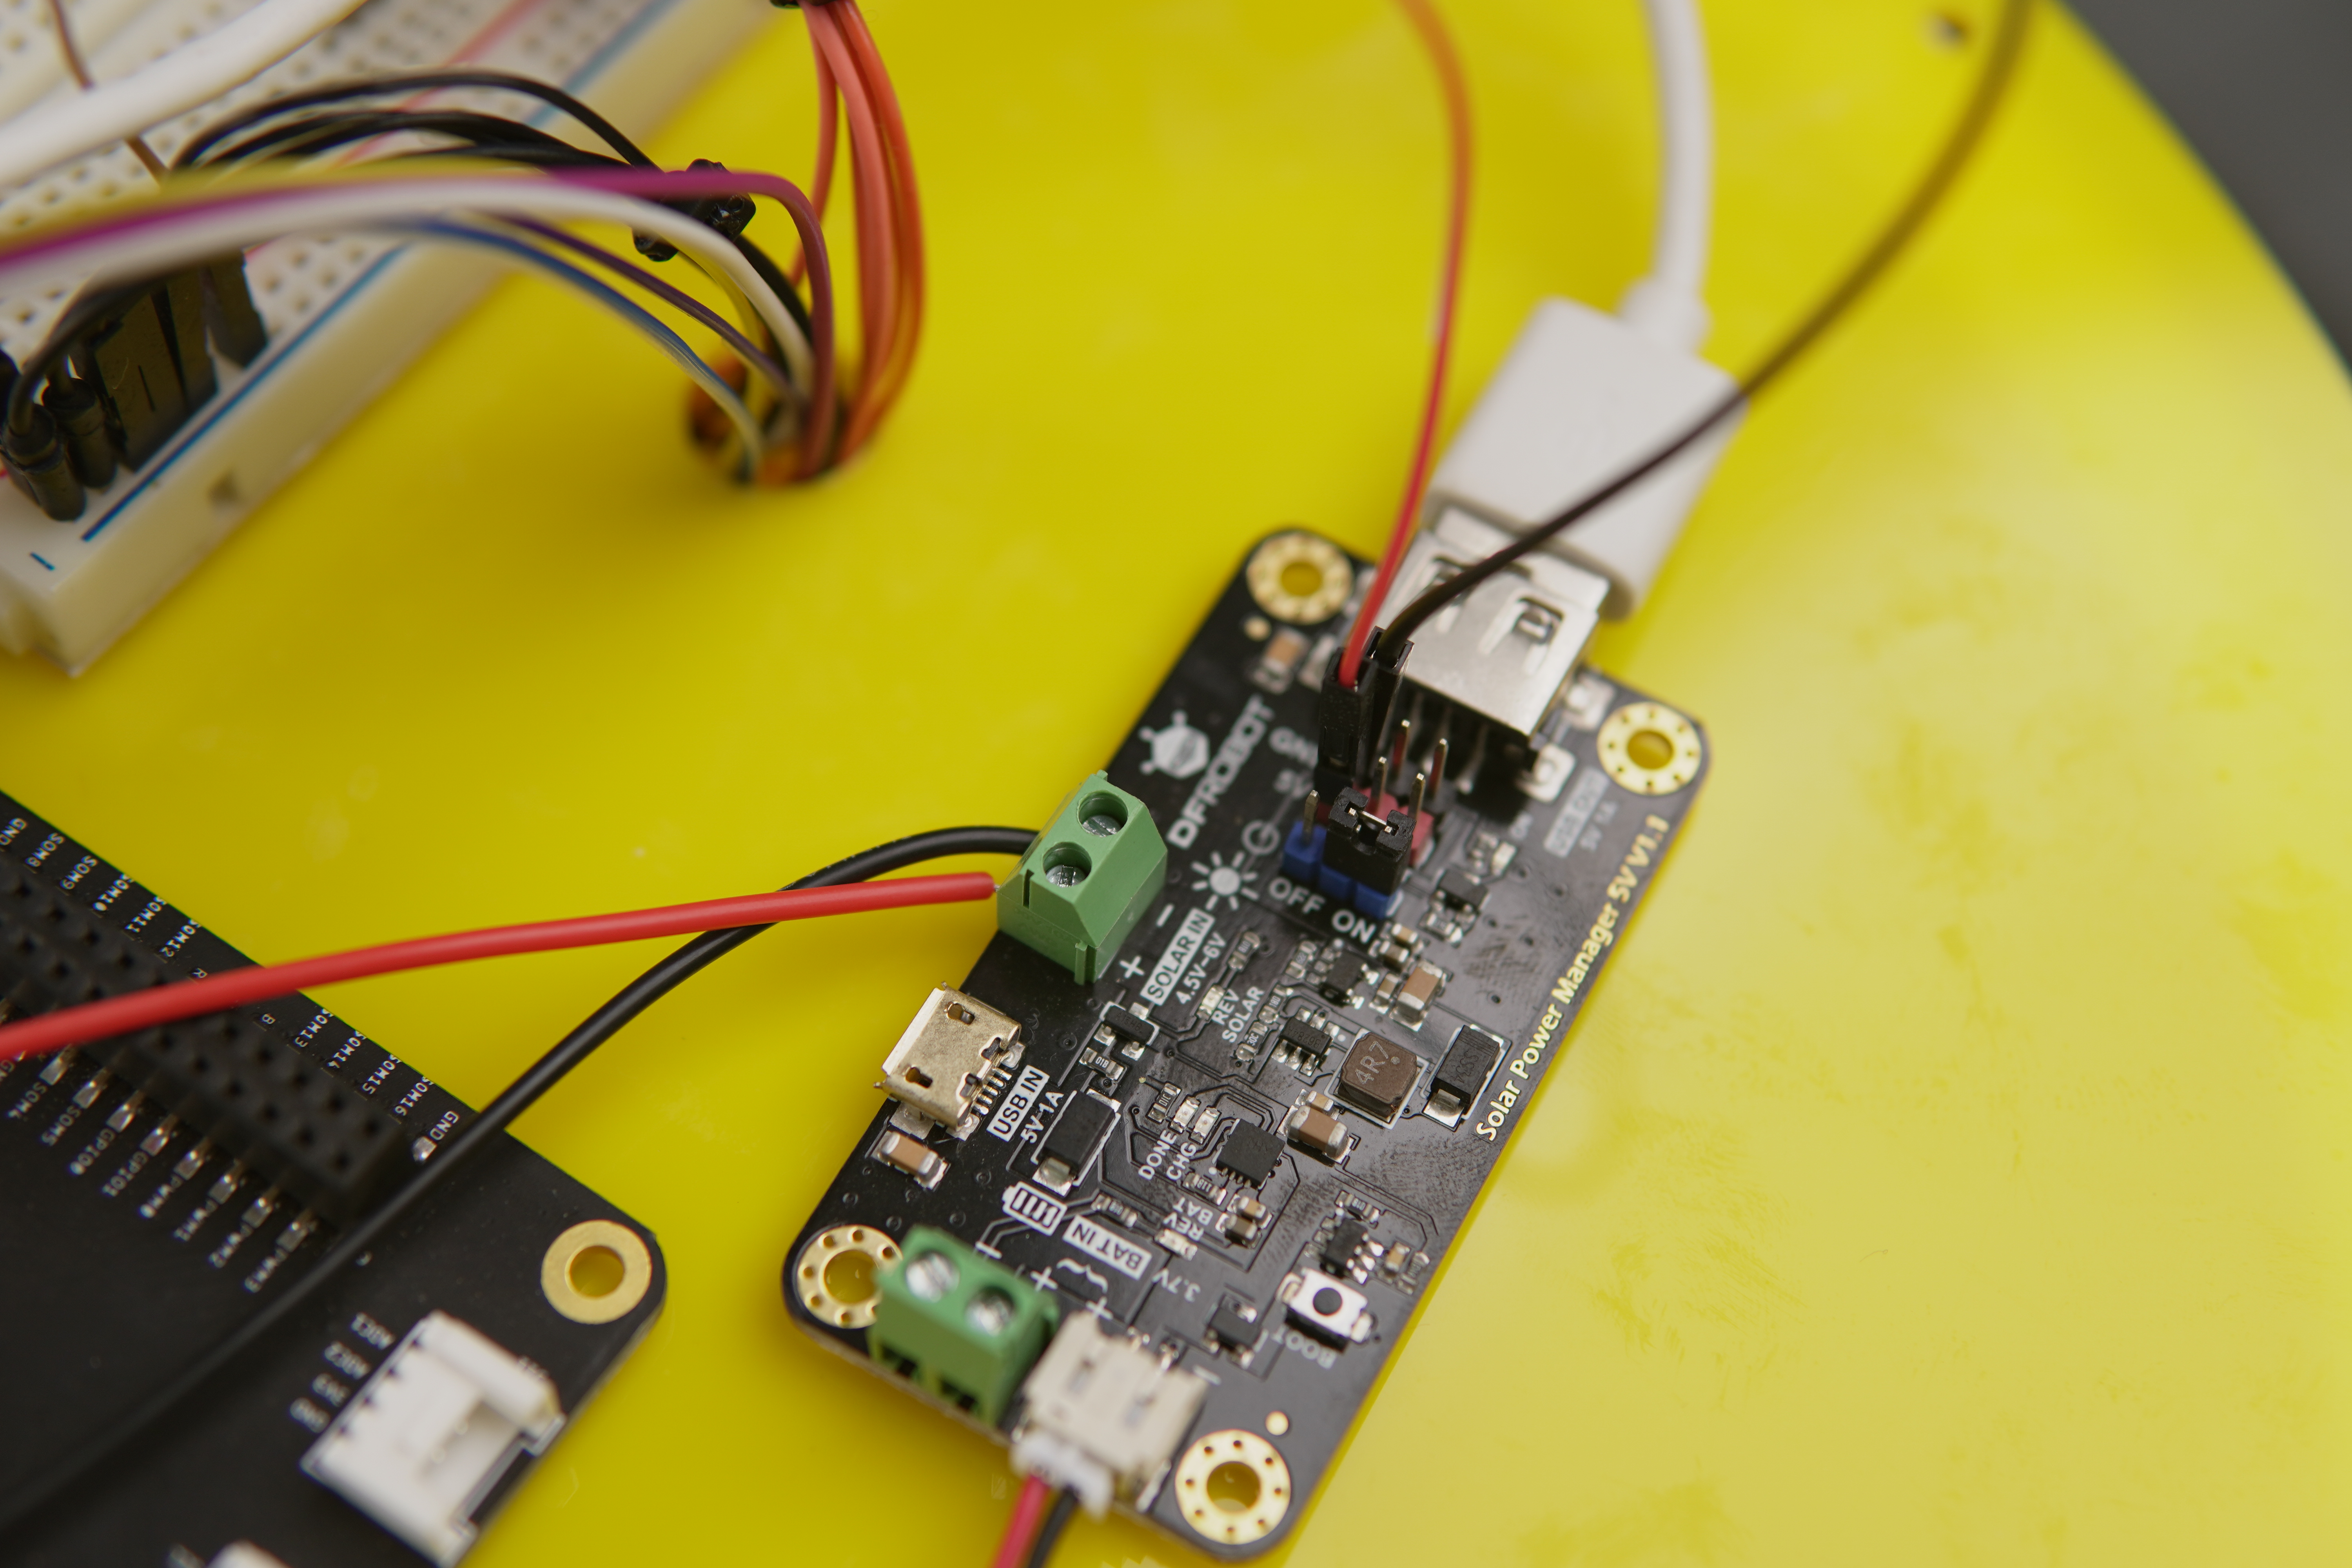
Power Management
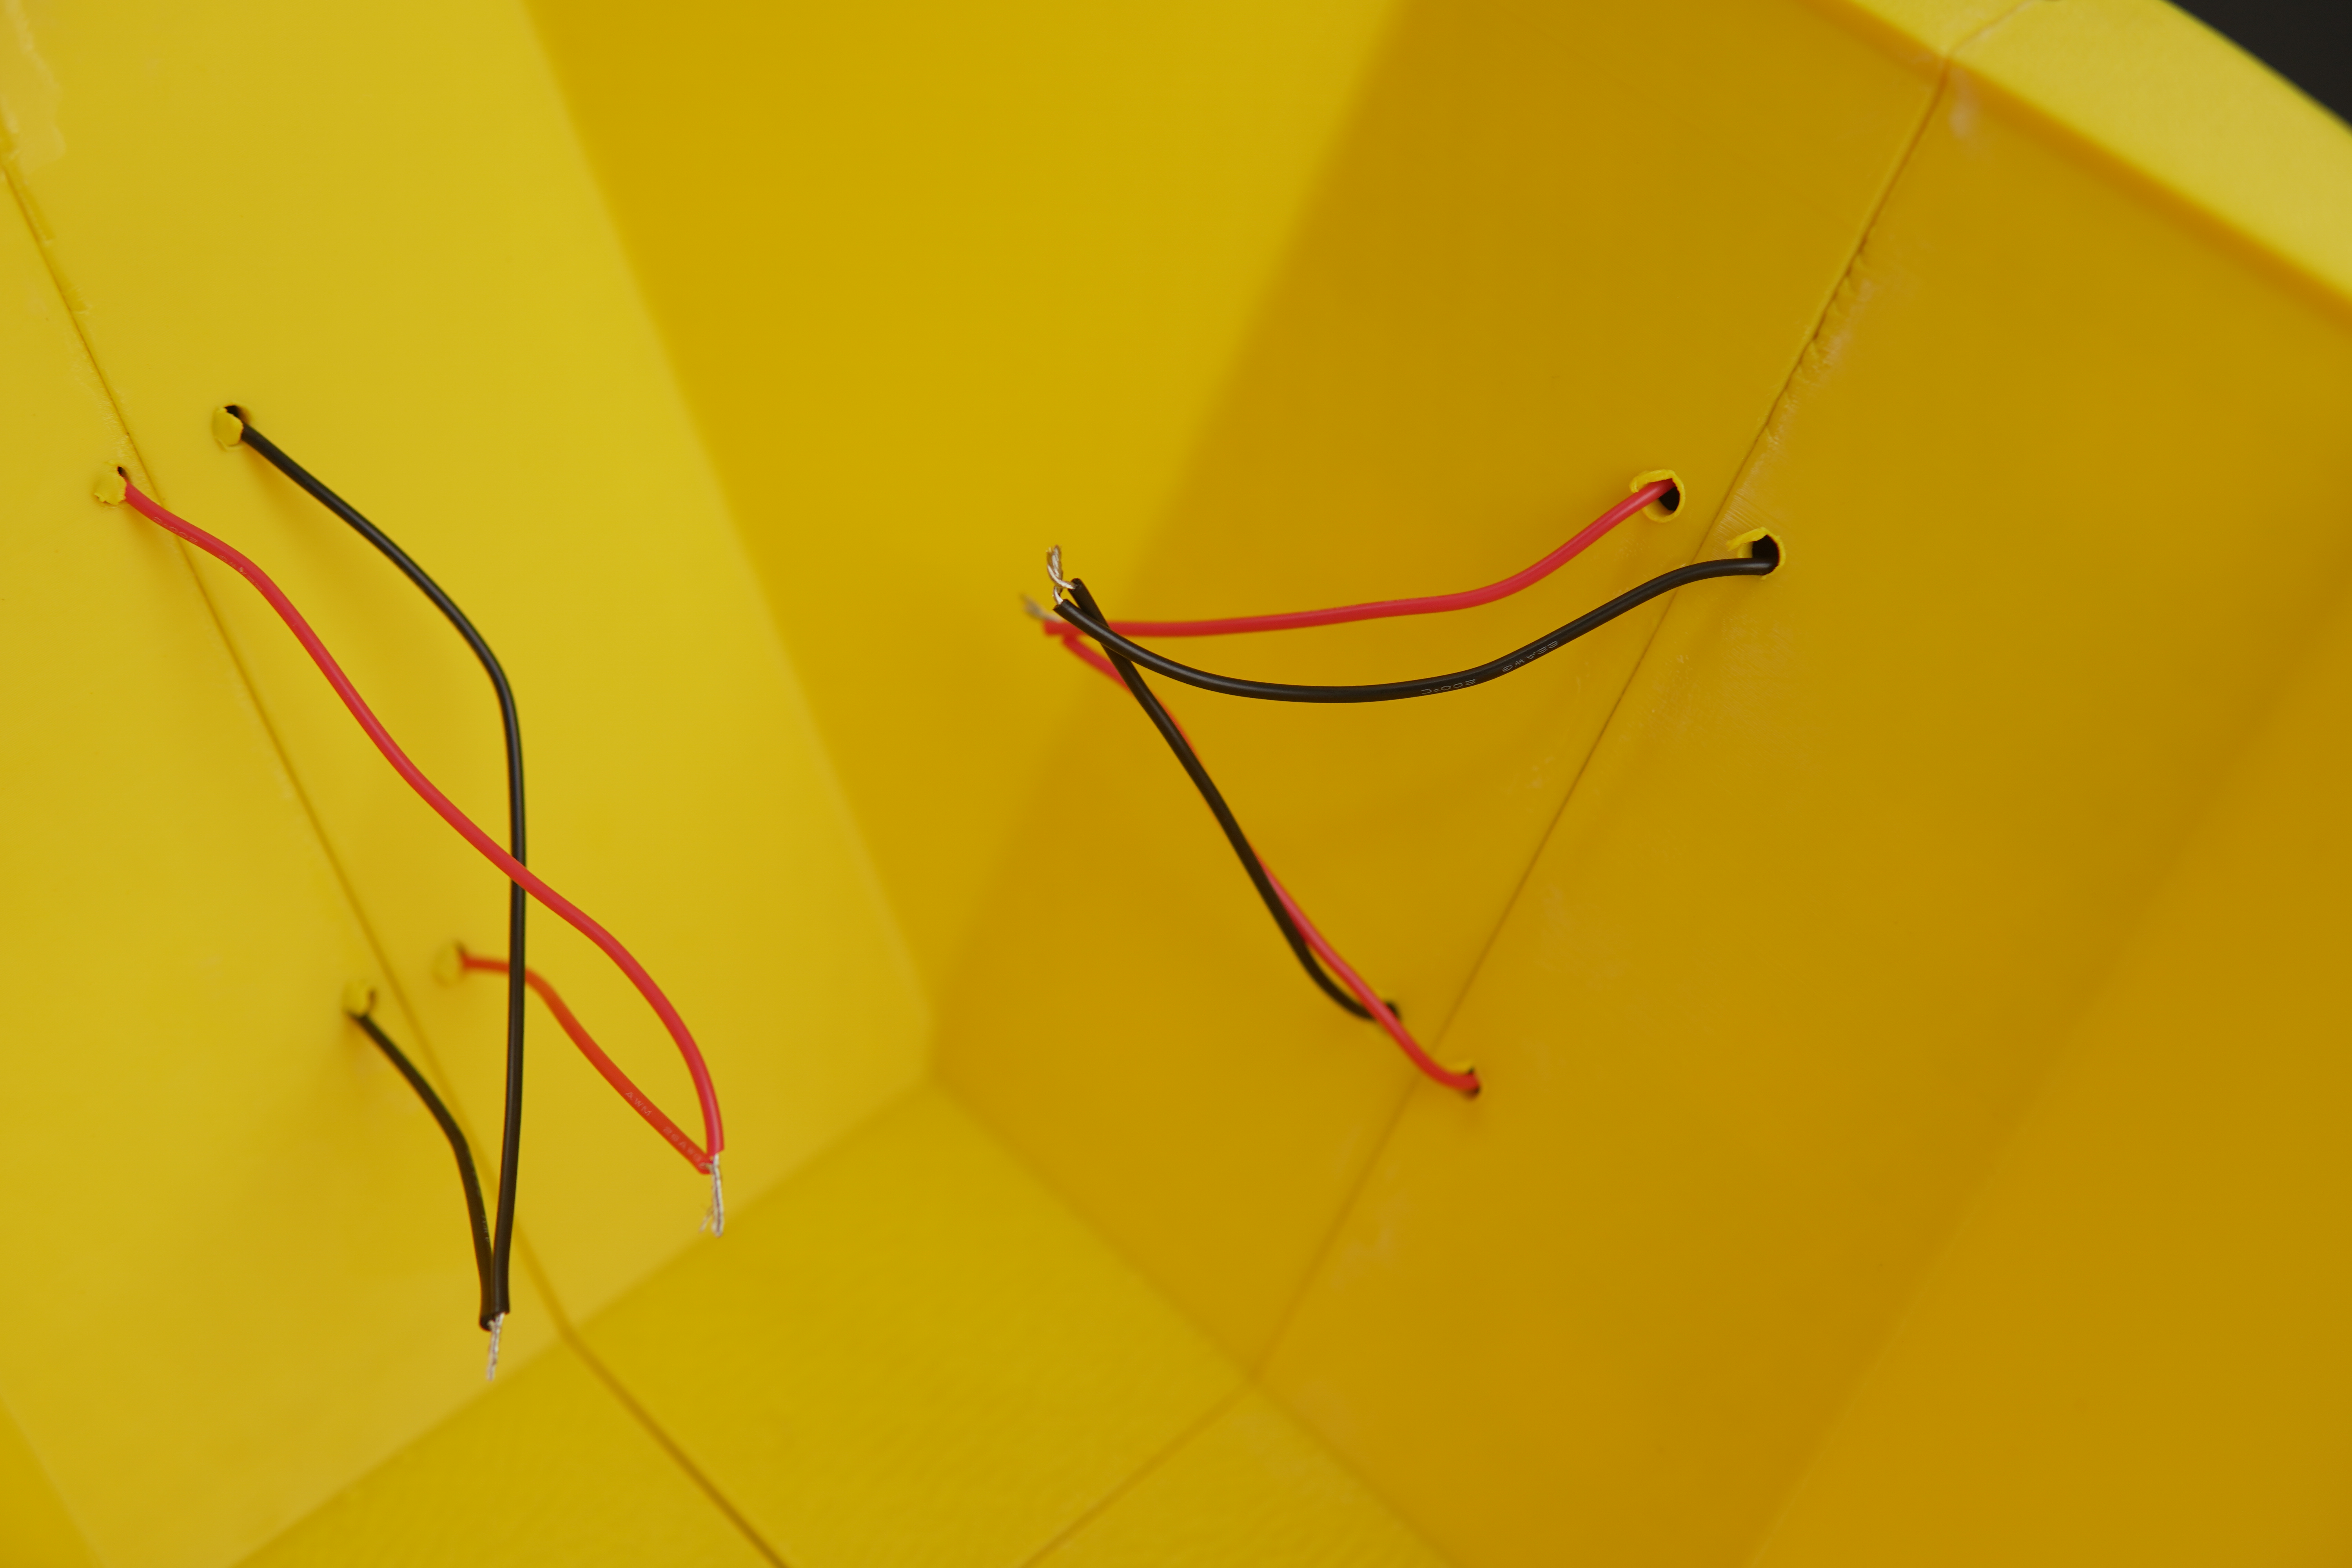
The system is powered by 6 solar panels (6V each) connected in parallel to increase current. The panels are wired to the 5V Solar Power Manager, which regulates the power flow to the 1800mAh battery. This battery stores energy and provides stable power for night time or cloudy conditions.
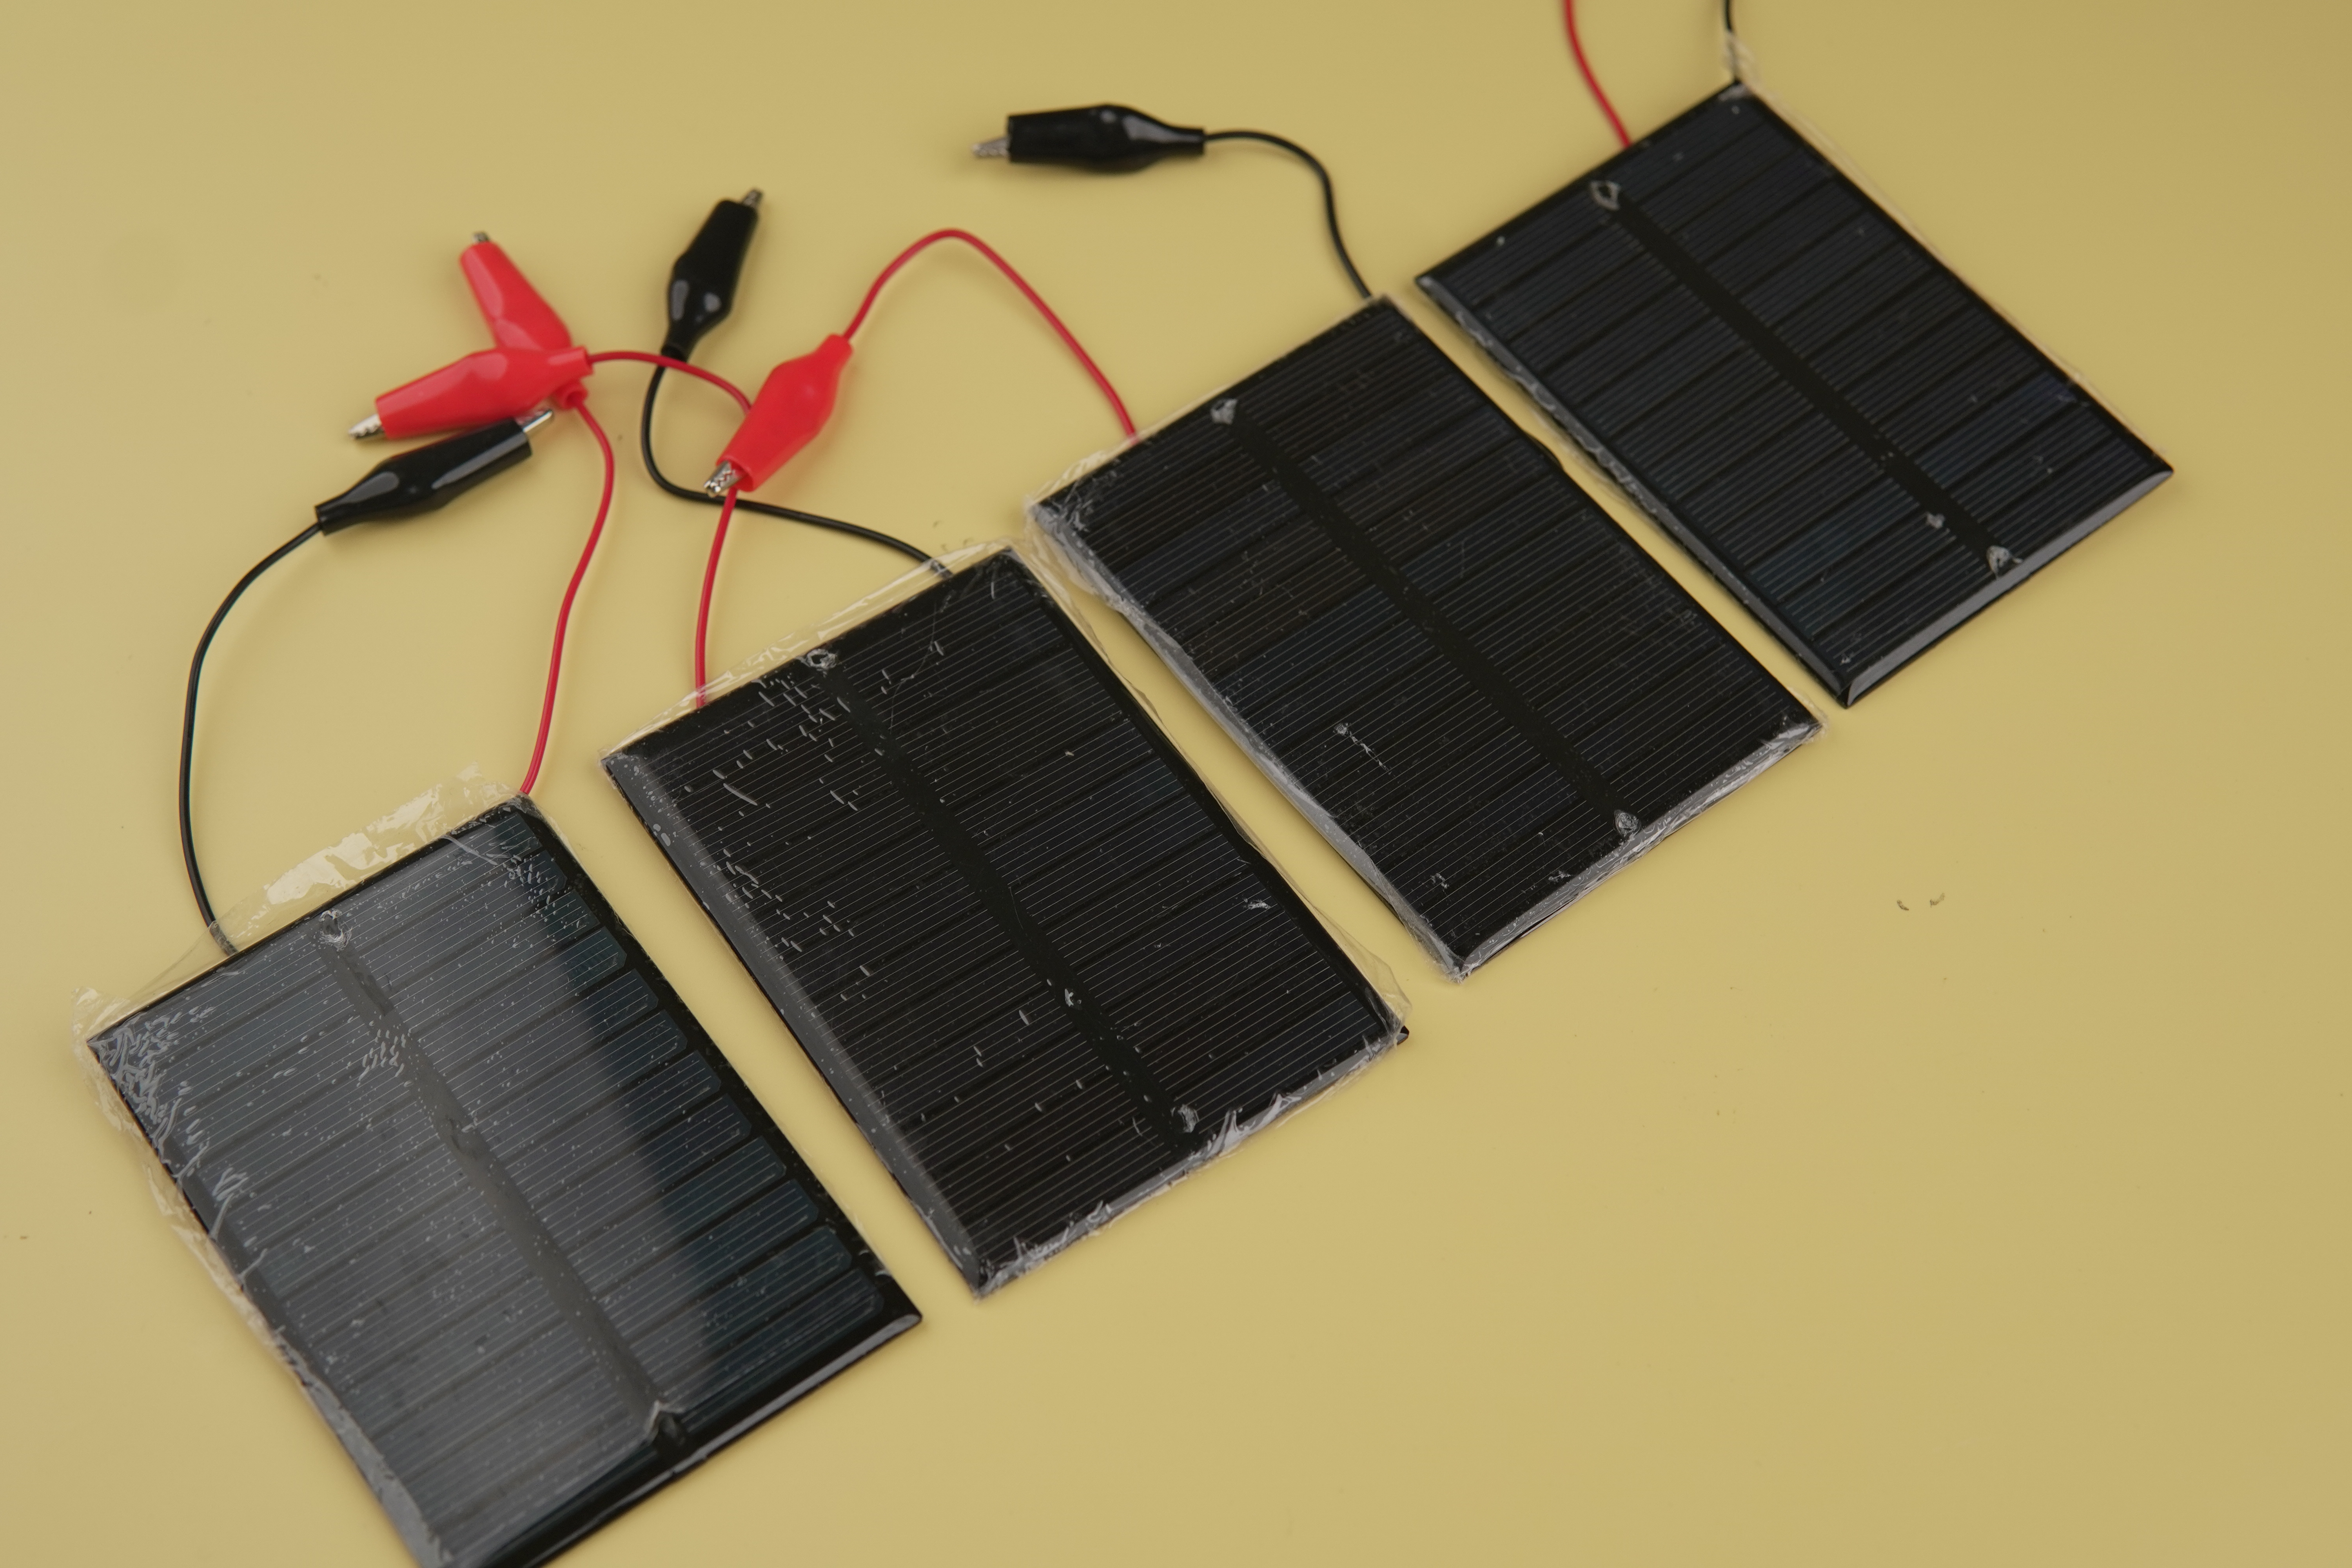
The Dissolved oxygen sensor needs 9V to operate, to compensate the voltage we have used the LM2596S Buck converter power supply.
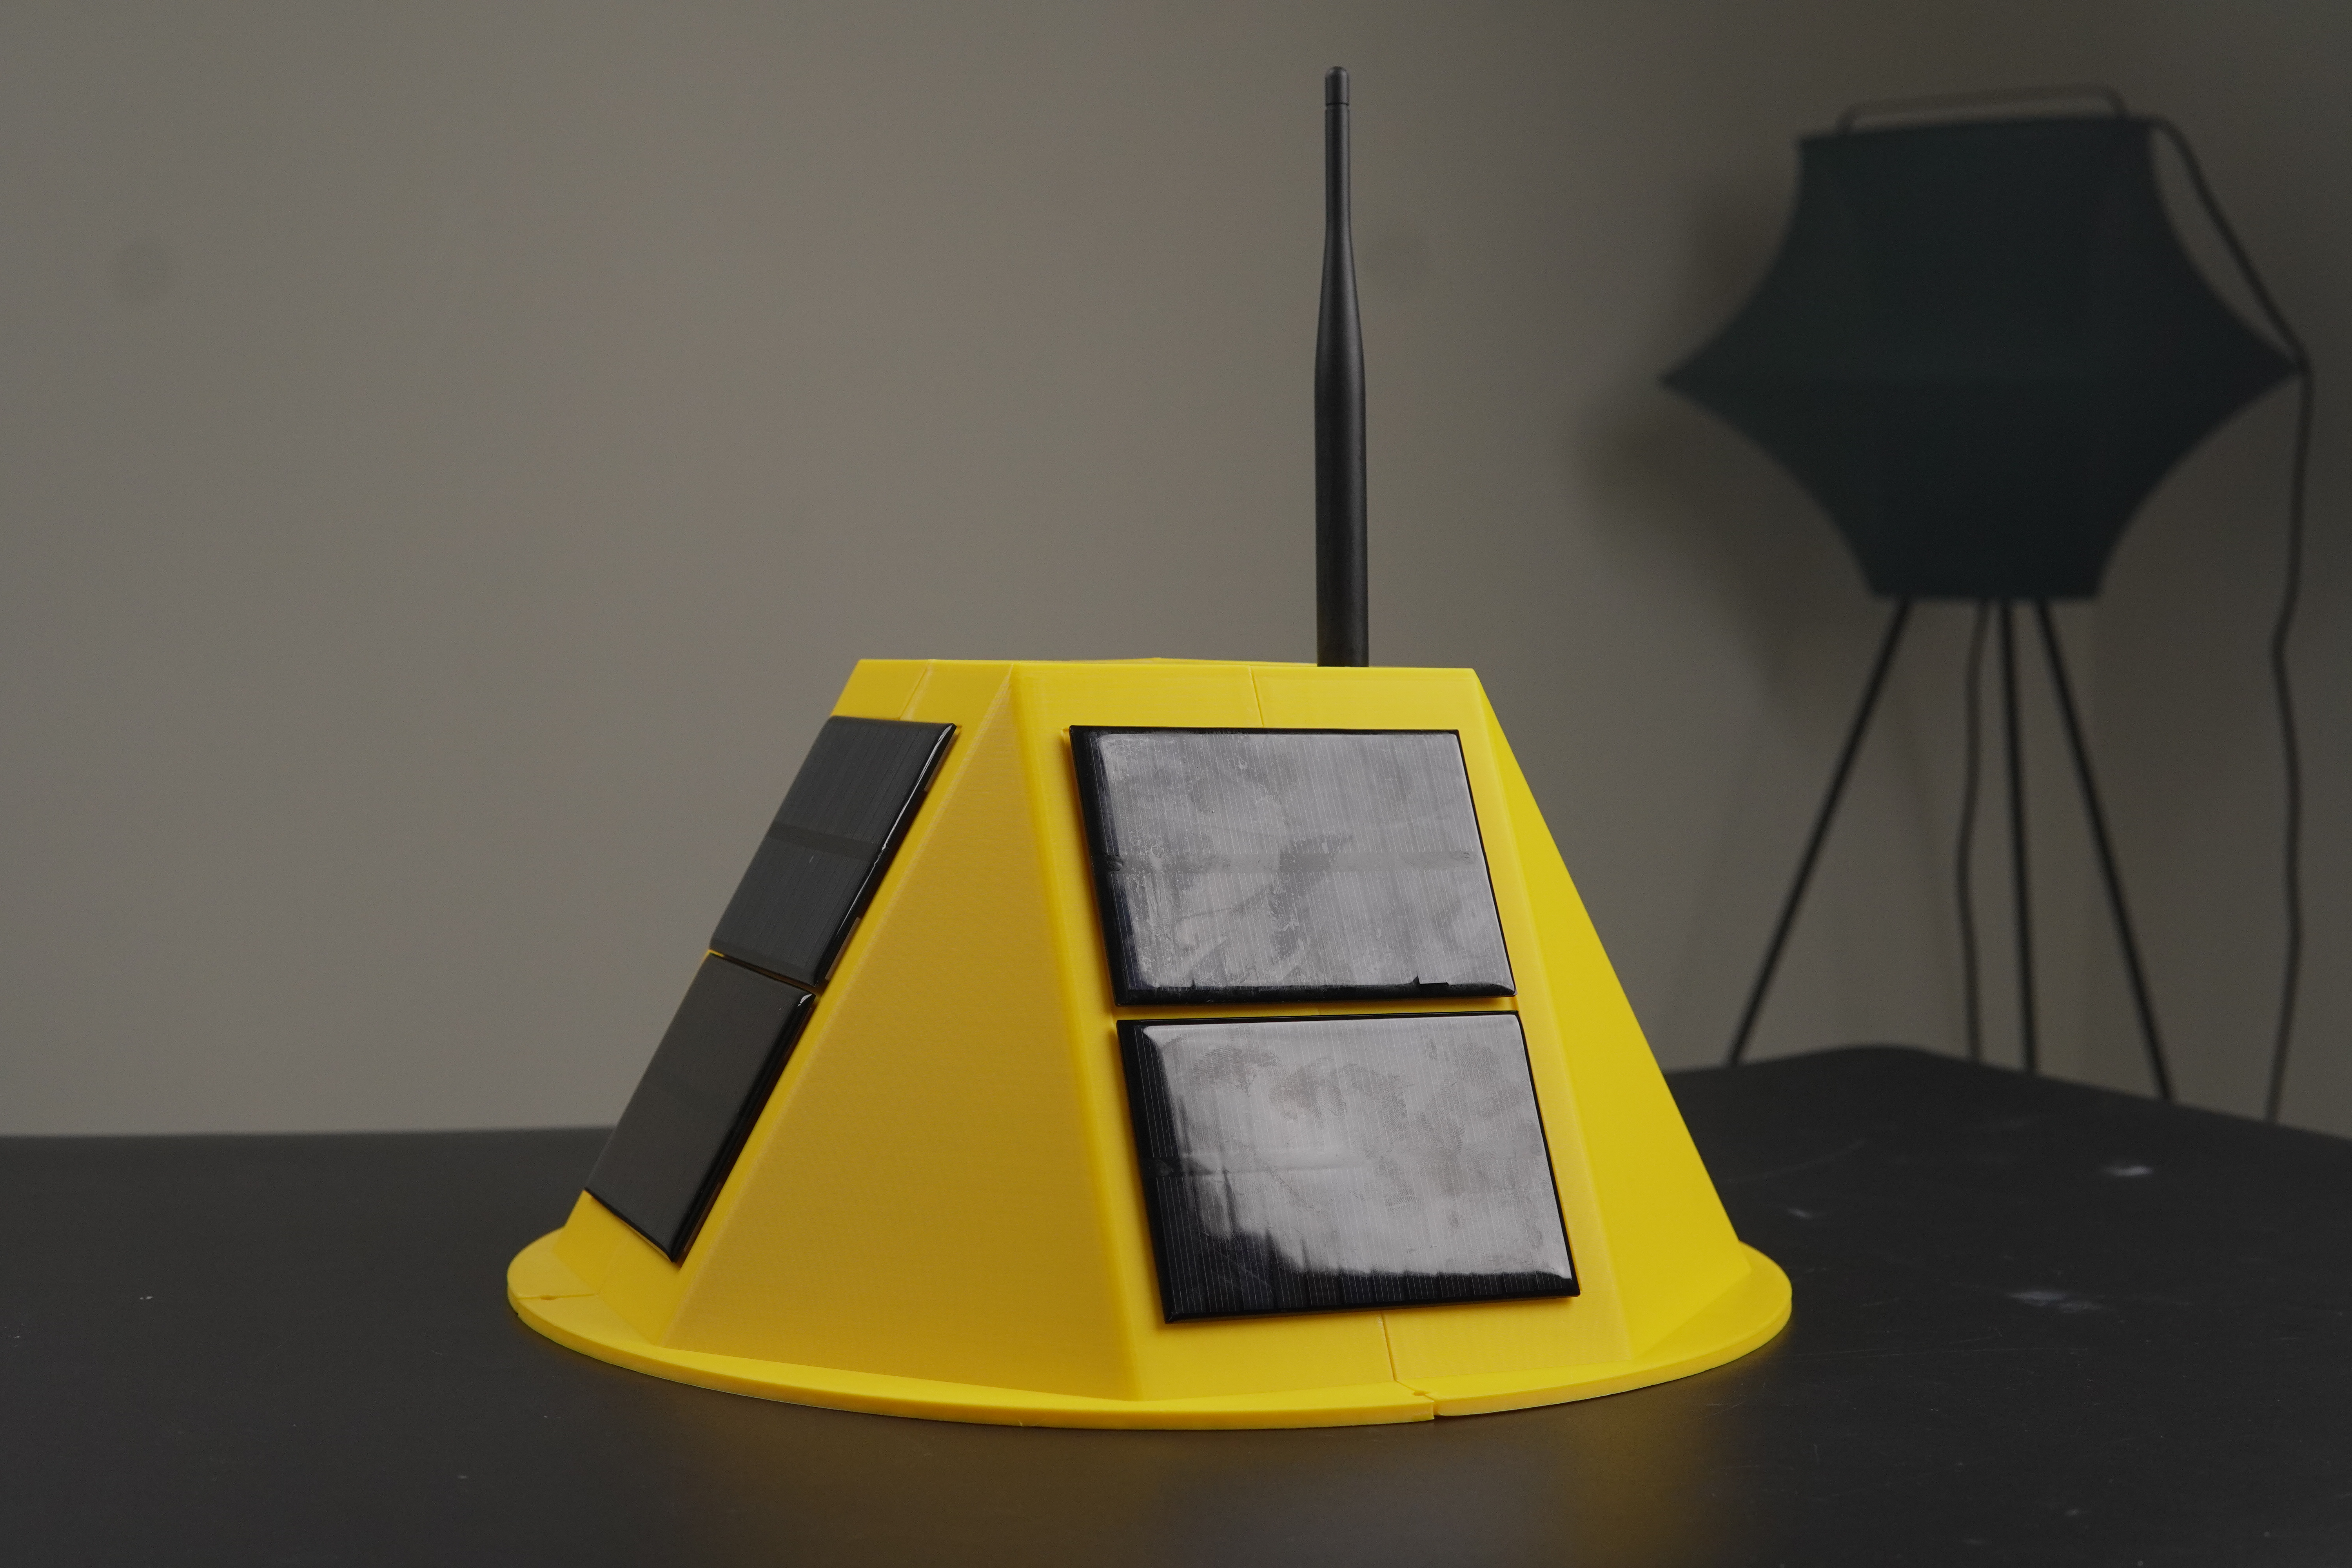
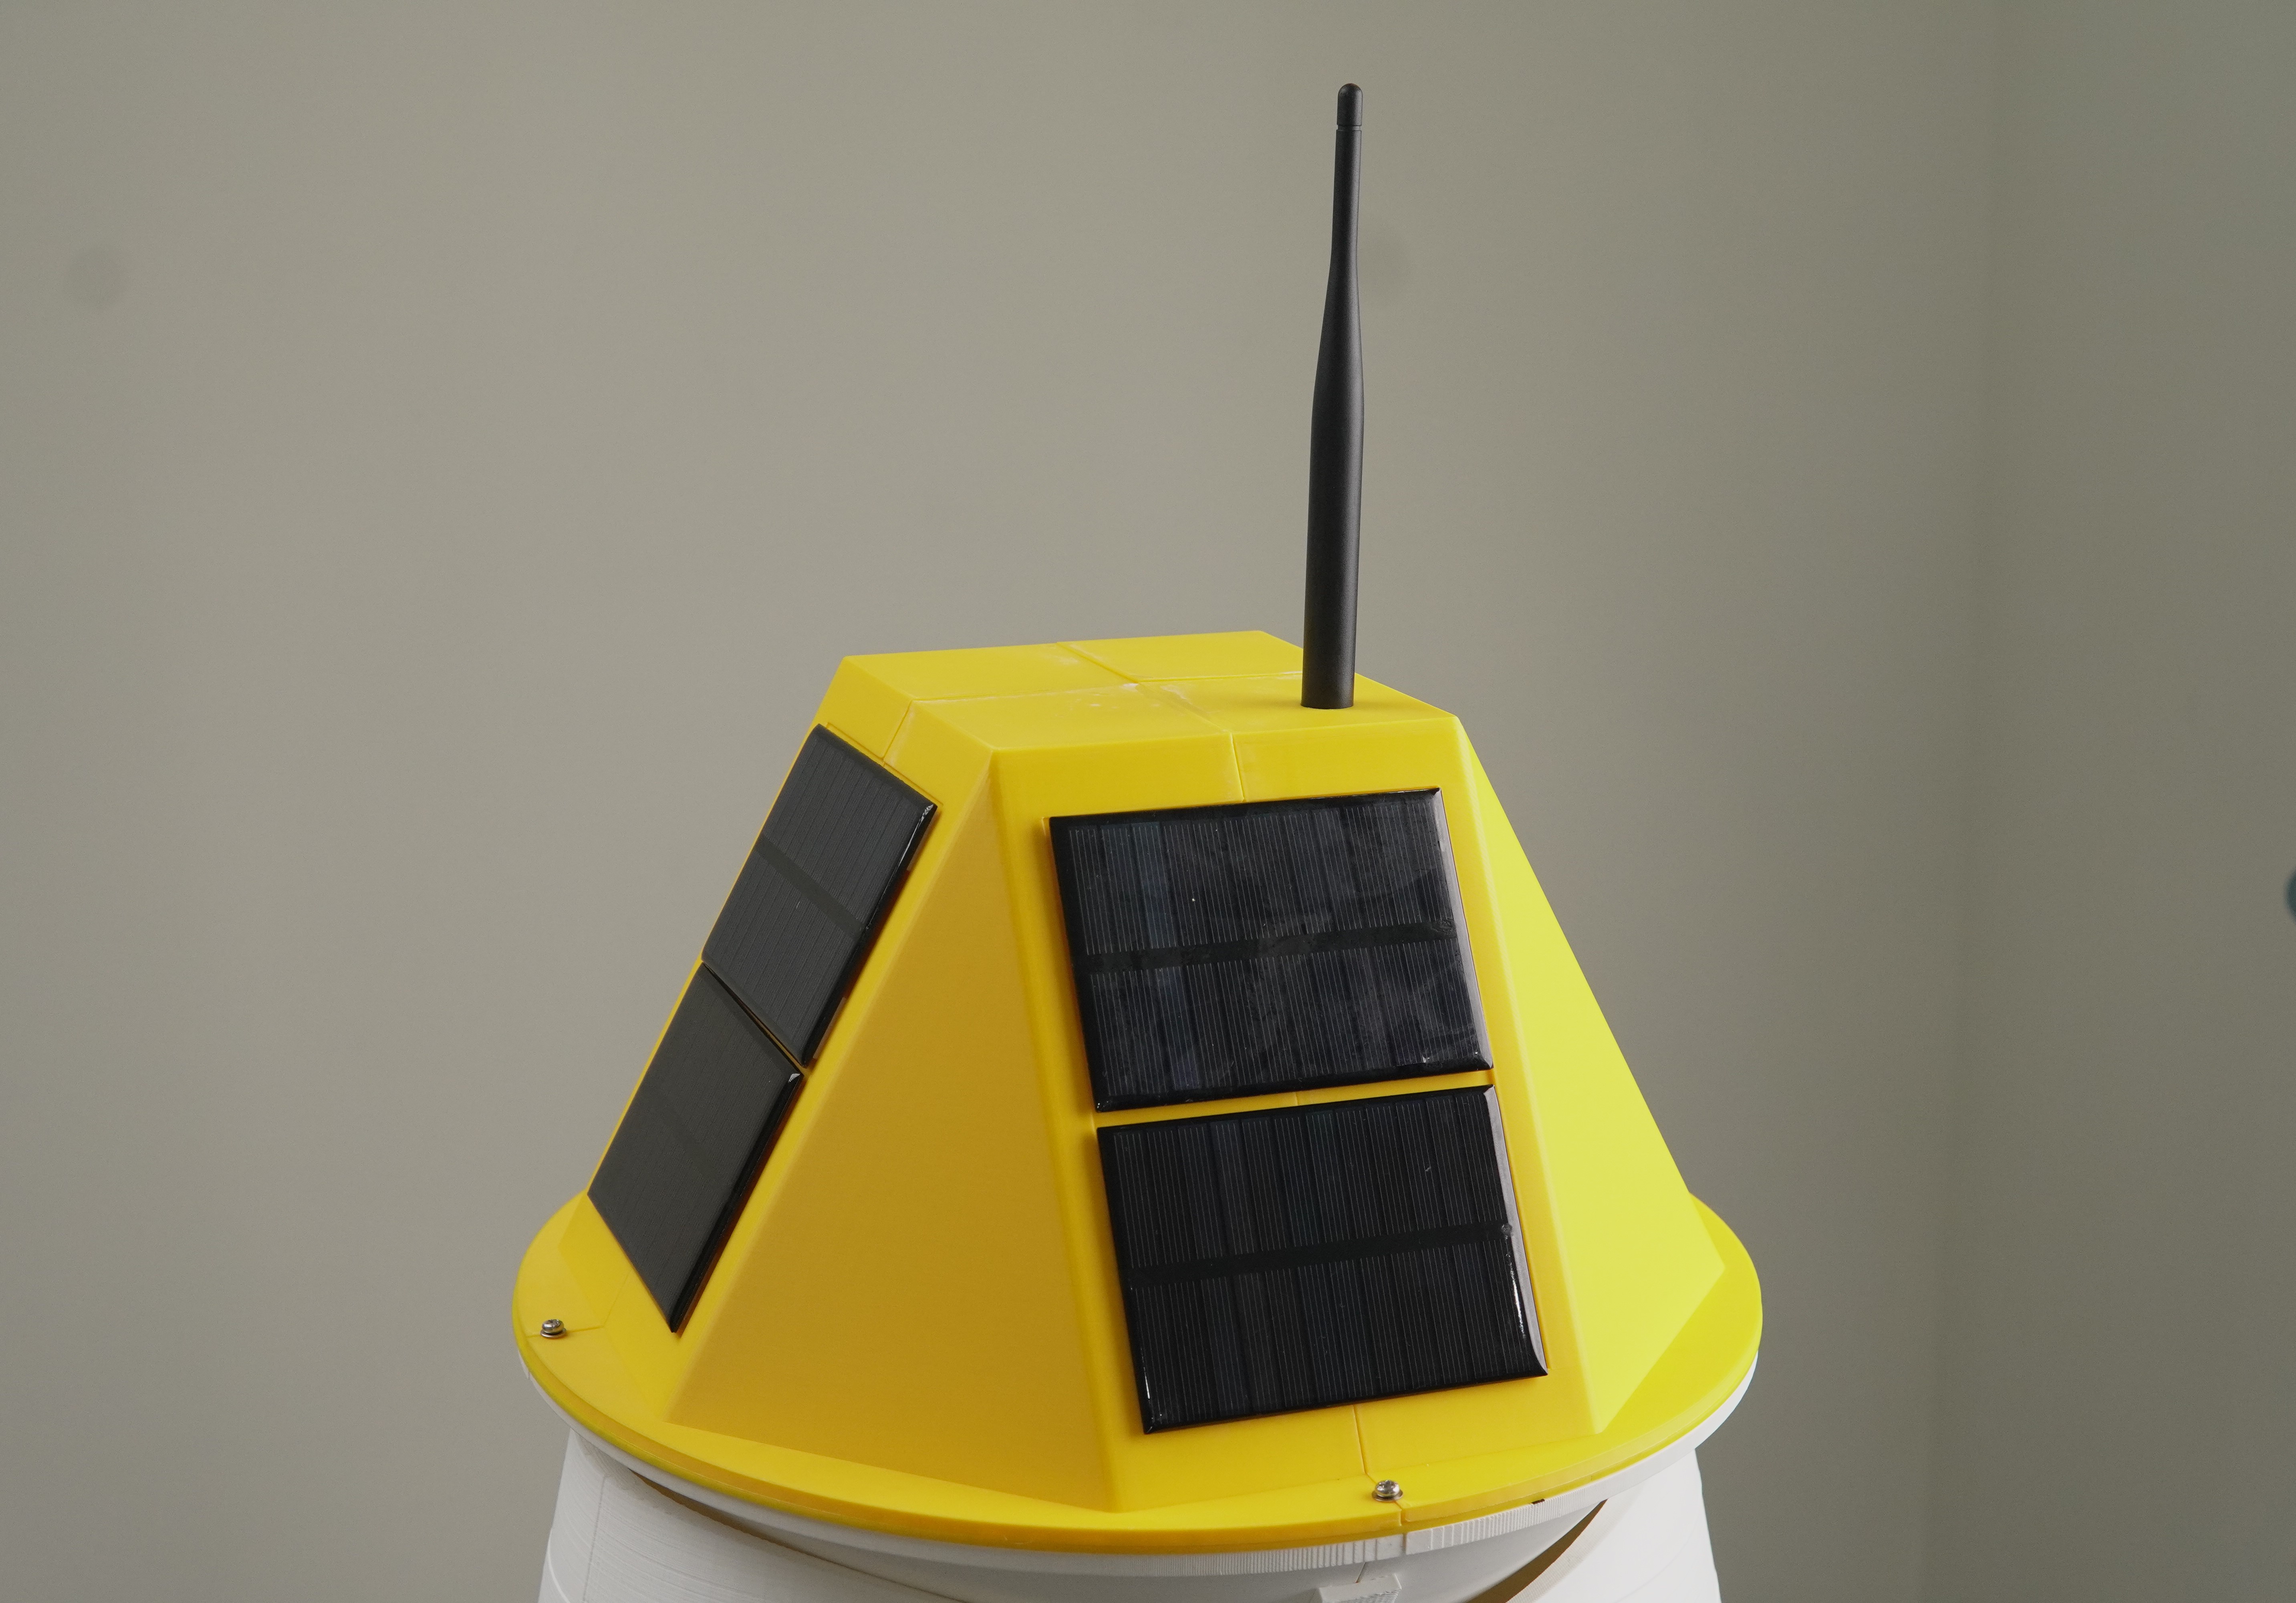
Antenna
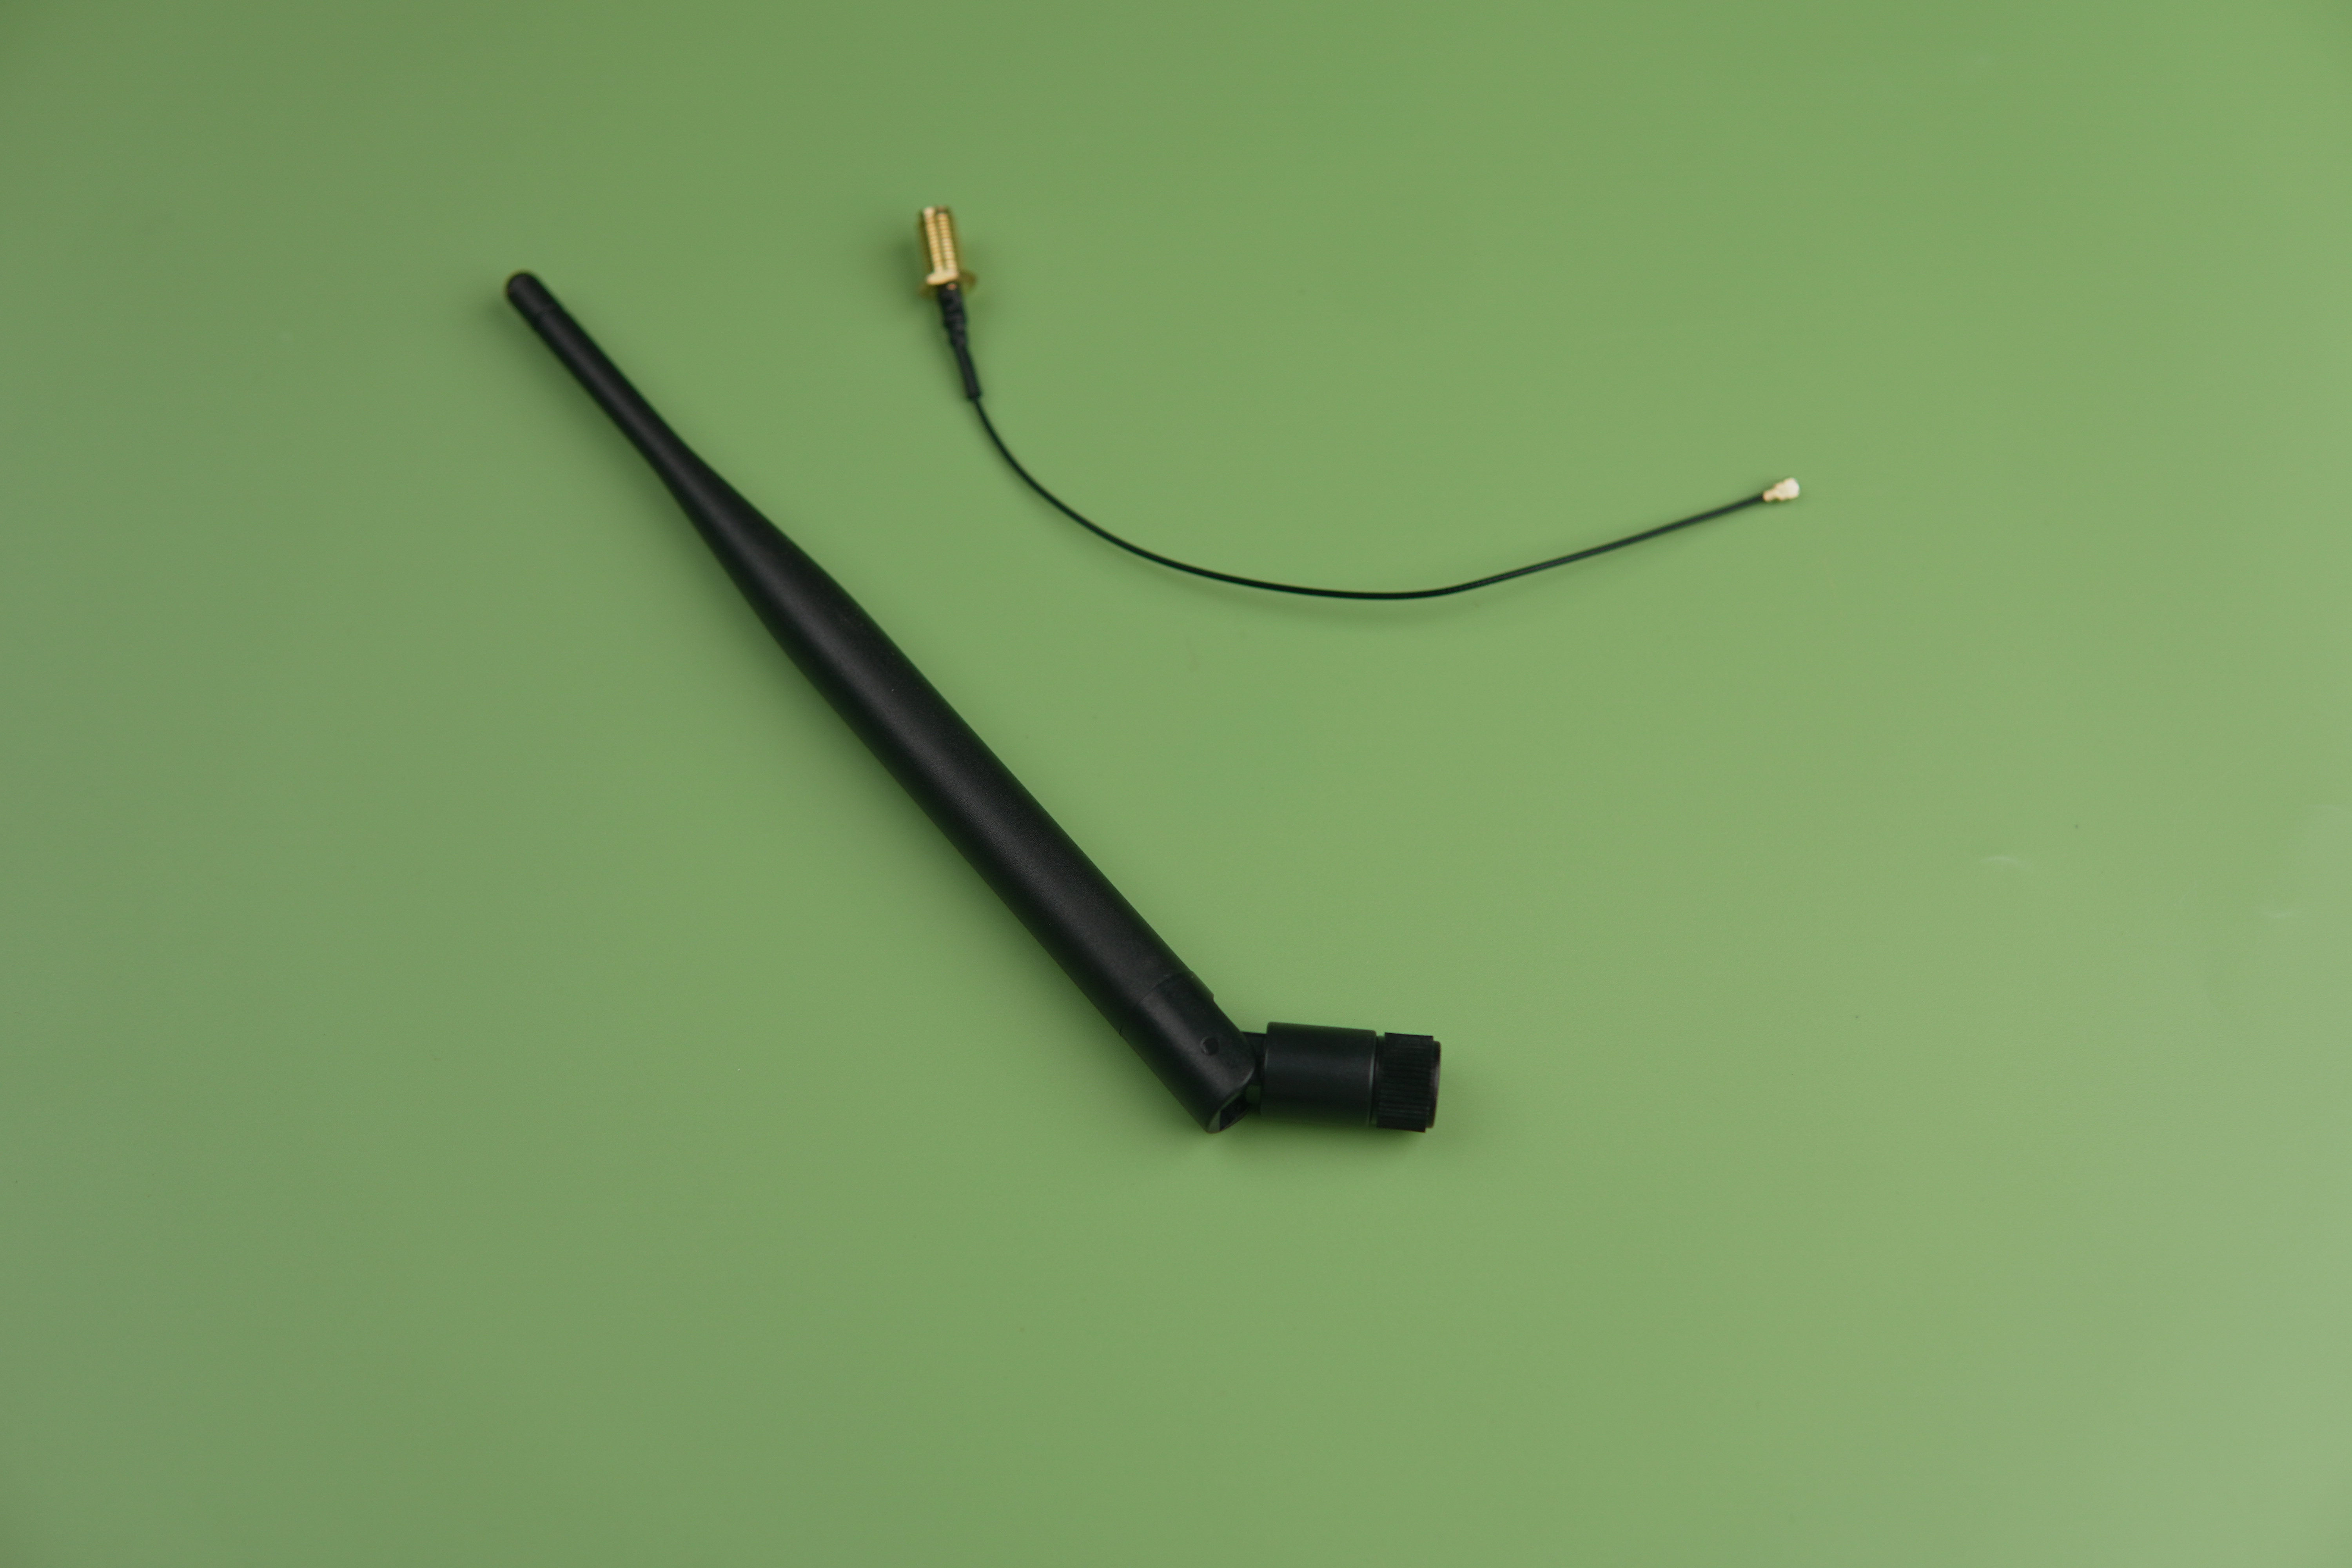
To enhance cellular connectivity and ensure stable data transmission in remote or aquatic locations, we upgraded the default antenna to a rubber duck antenna for use with the Particle B SoM. This antenna features a durable, flexible exterior and connects via a standard SMA connector, offering omnidirectional radiation that's ideal for buoy-based systems, which may shift due to wind or water currents. To connect the antenna to the B SoM's U.FL port, we used a 15cm U.FL to SMA female bulkhead RF cable assembly. Operating across a wide frequency range (698–960 MHz & 1710–2690 MHz) with up to 5 dBi gain, the rubber duck antenna significantly improves performance in low-signal areas compared to embedded or PCB antennas. The sleek form factor also adds a more professional, rugged aesthetic to the final device, making it suitable for both field and demonstration use.
3D Model
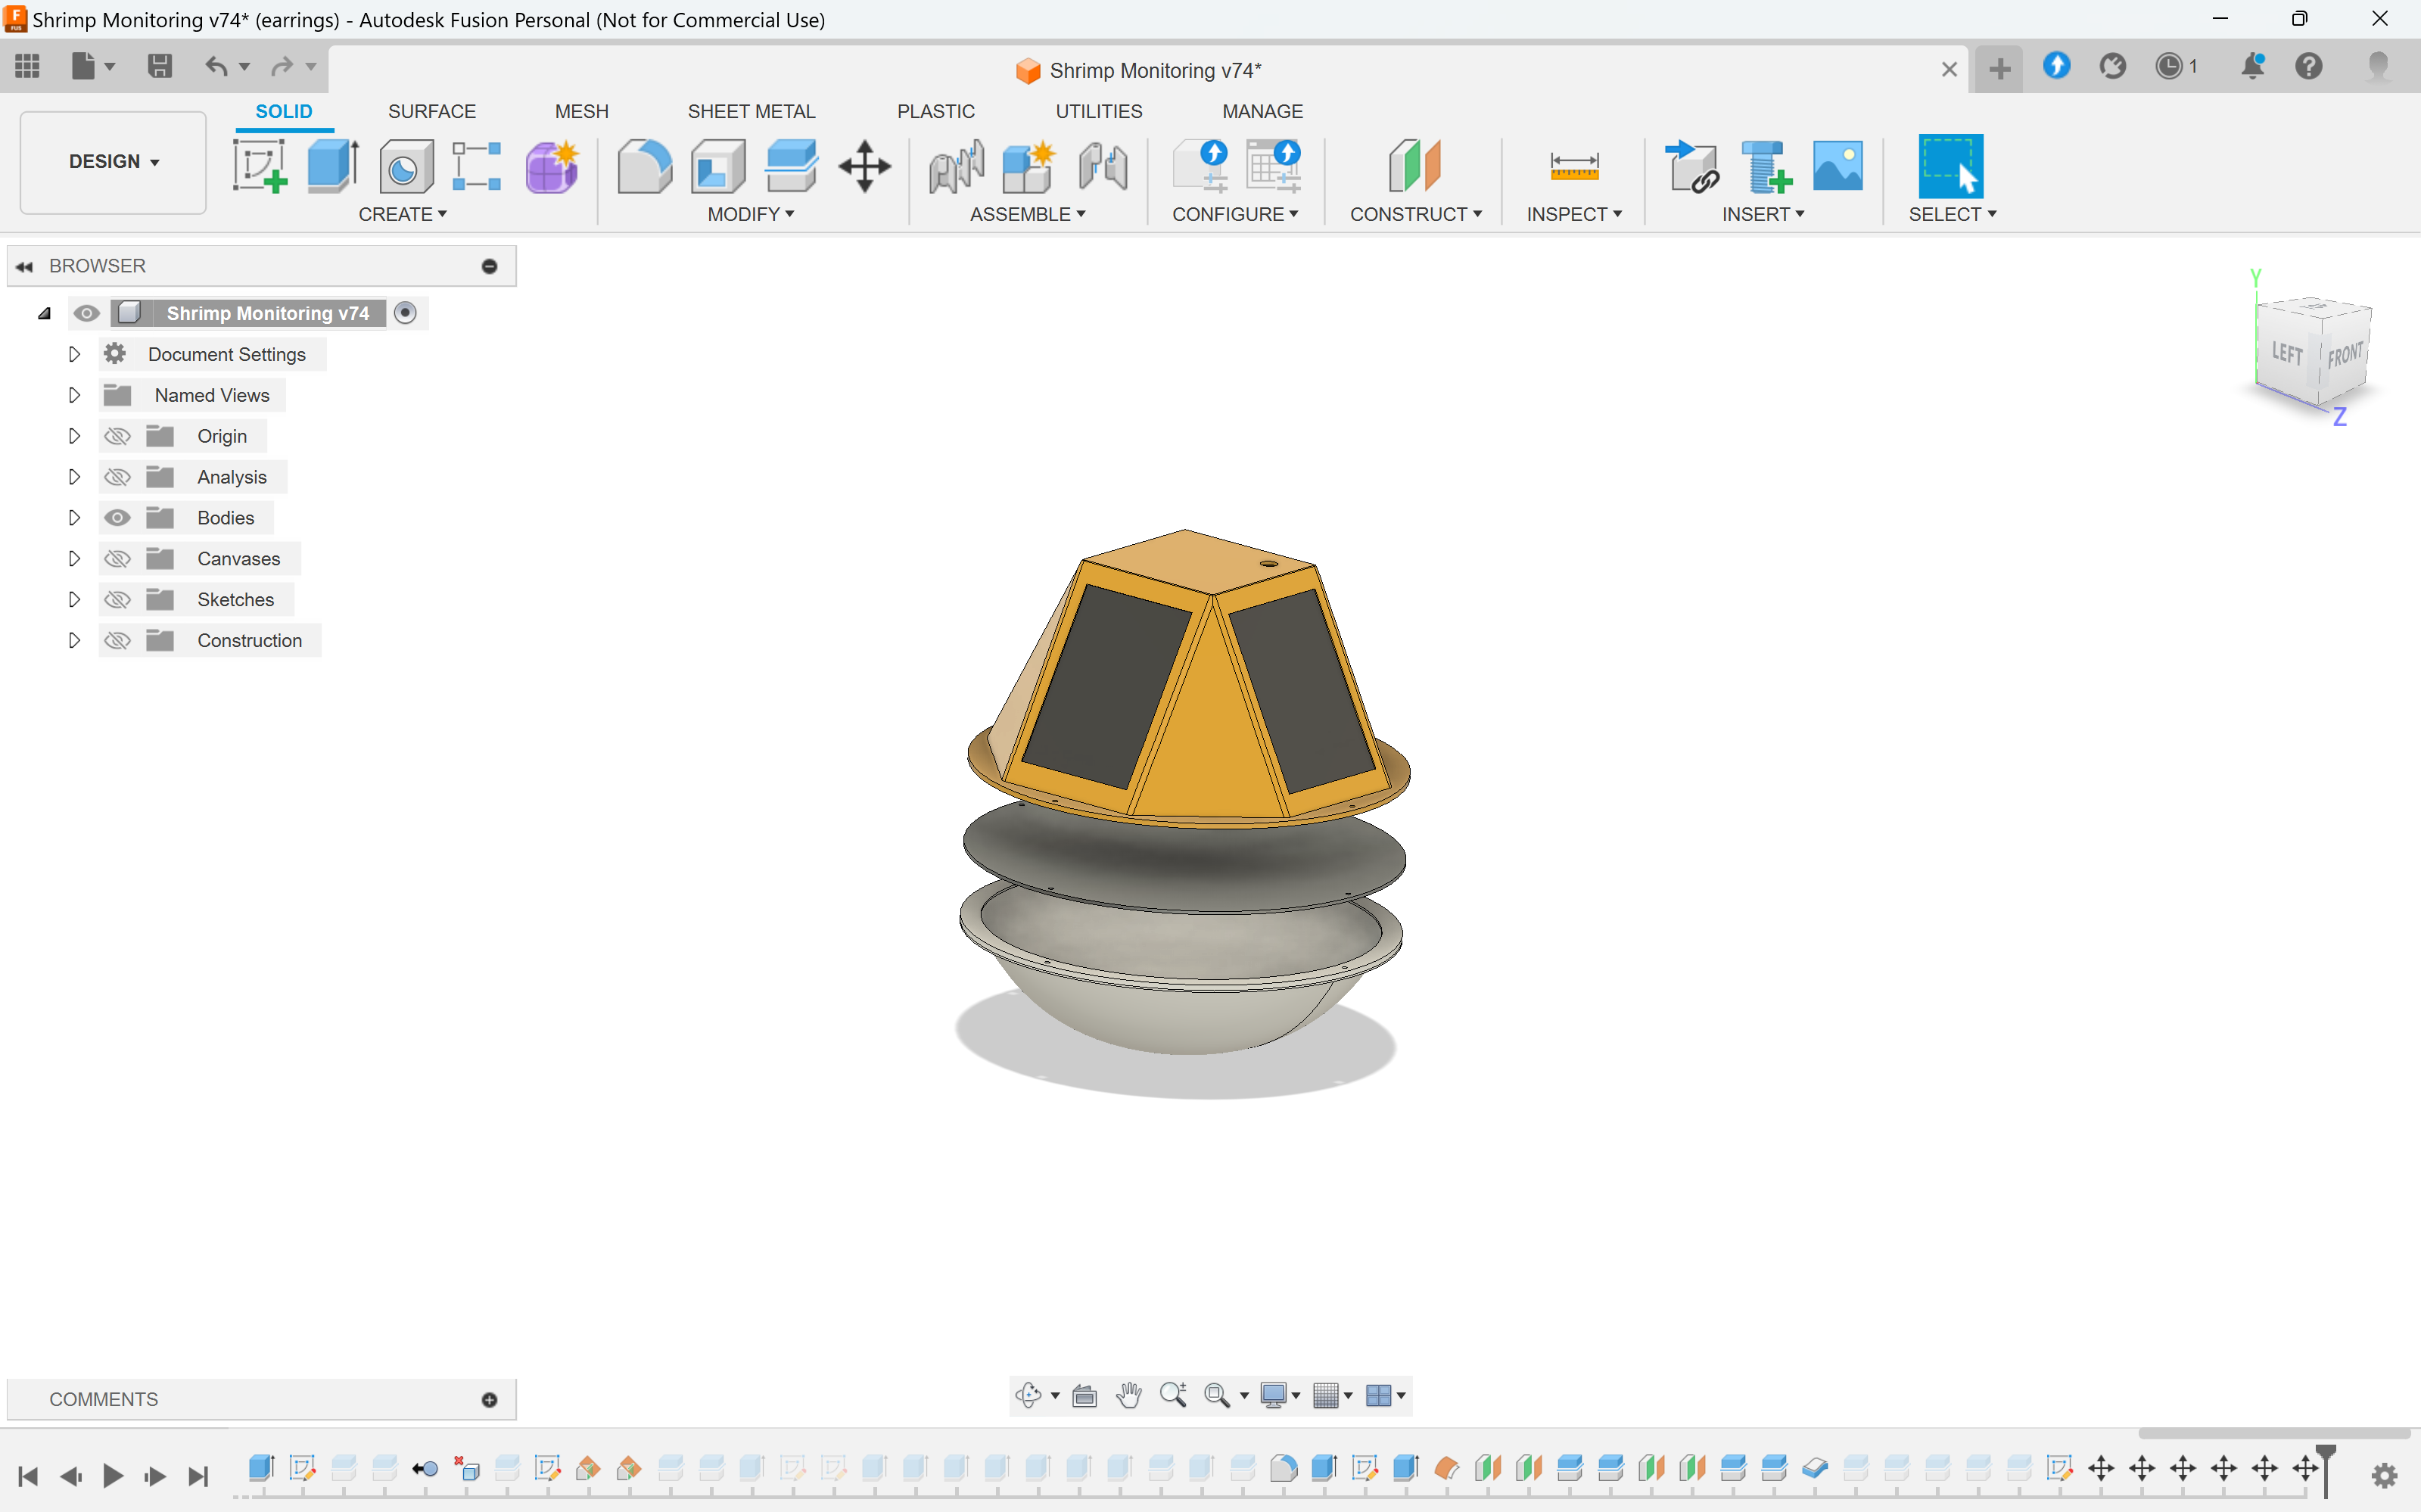


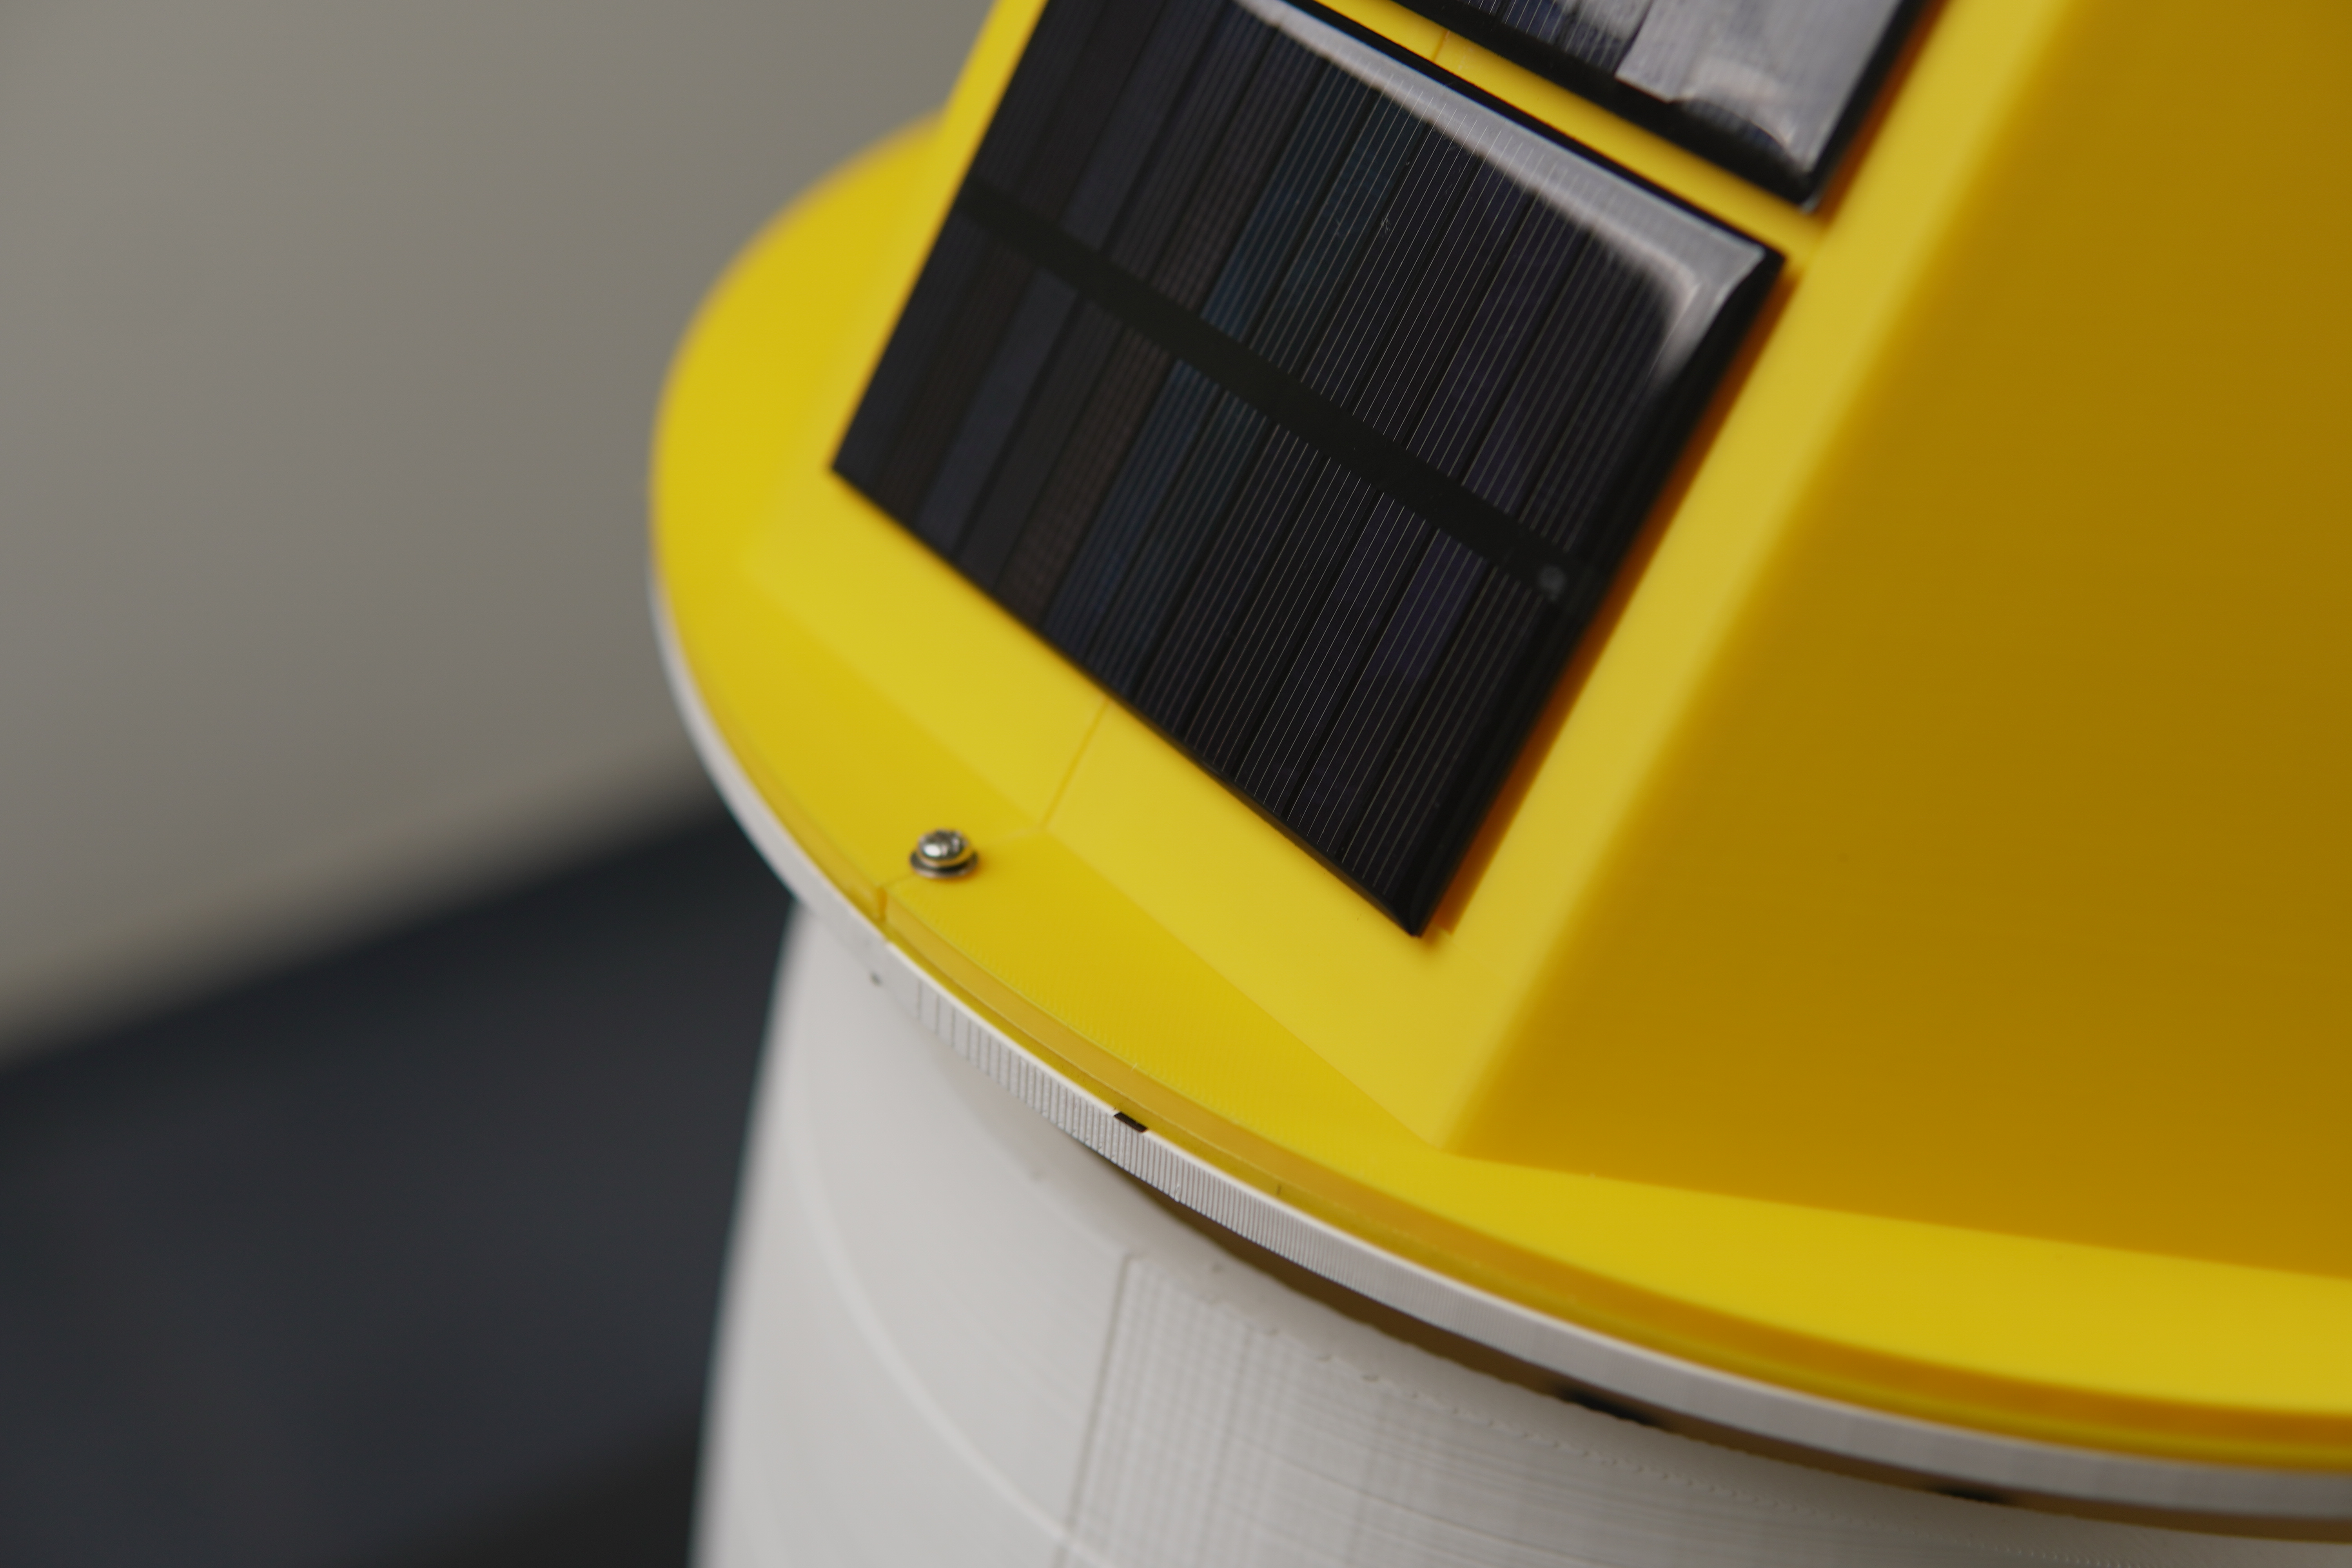
Using Autodesk Fusion 360, we developed a bespoke 3D model that combines a trapezoidal housing with a circular semi-spherical foundation to ensure optimal buoyancy performance. This distinctive shape enhances balance and stability on the water surface while offering ample room to mount sensors and securely enclose the electronics.

The full structure comprises three main parts: the upper trapezoidal section, the semi-spherical middle, and a flat circular base for holding internal components. The trapezoidal and semi-spherical parts were 3D printed using PLA, chosen for its lightweight, water-resistant, and outdoor-friendly properties. For saving the time and the filament the base was laser-cut from 2mm yellow acrylic.

Assembly
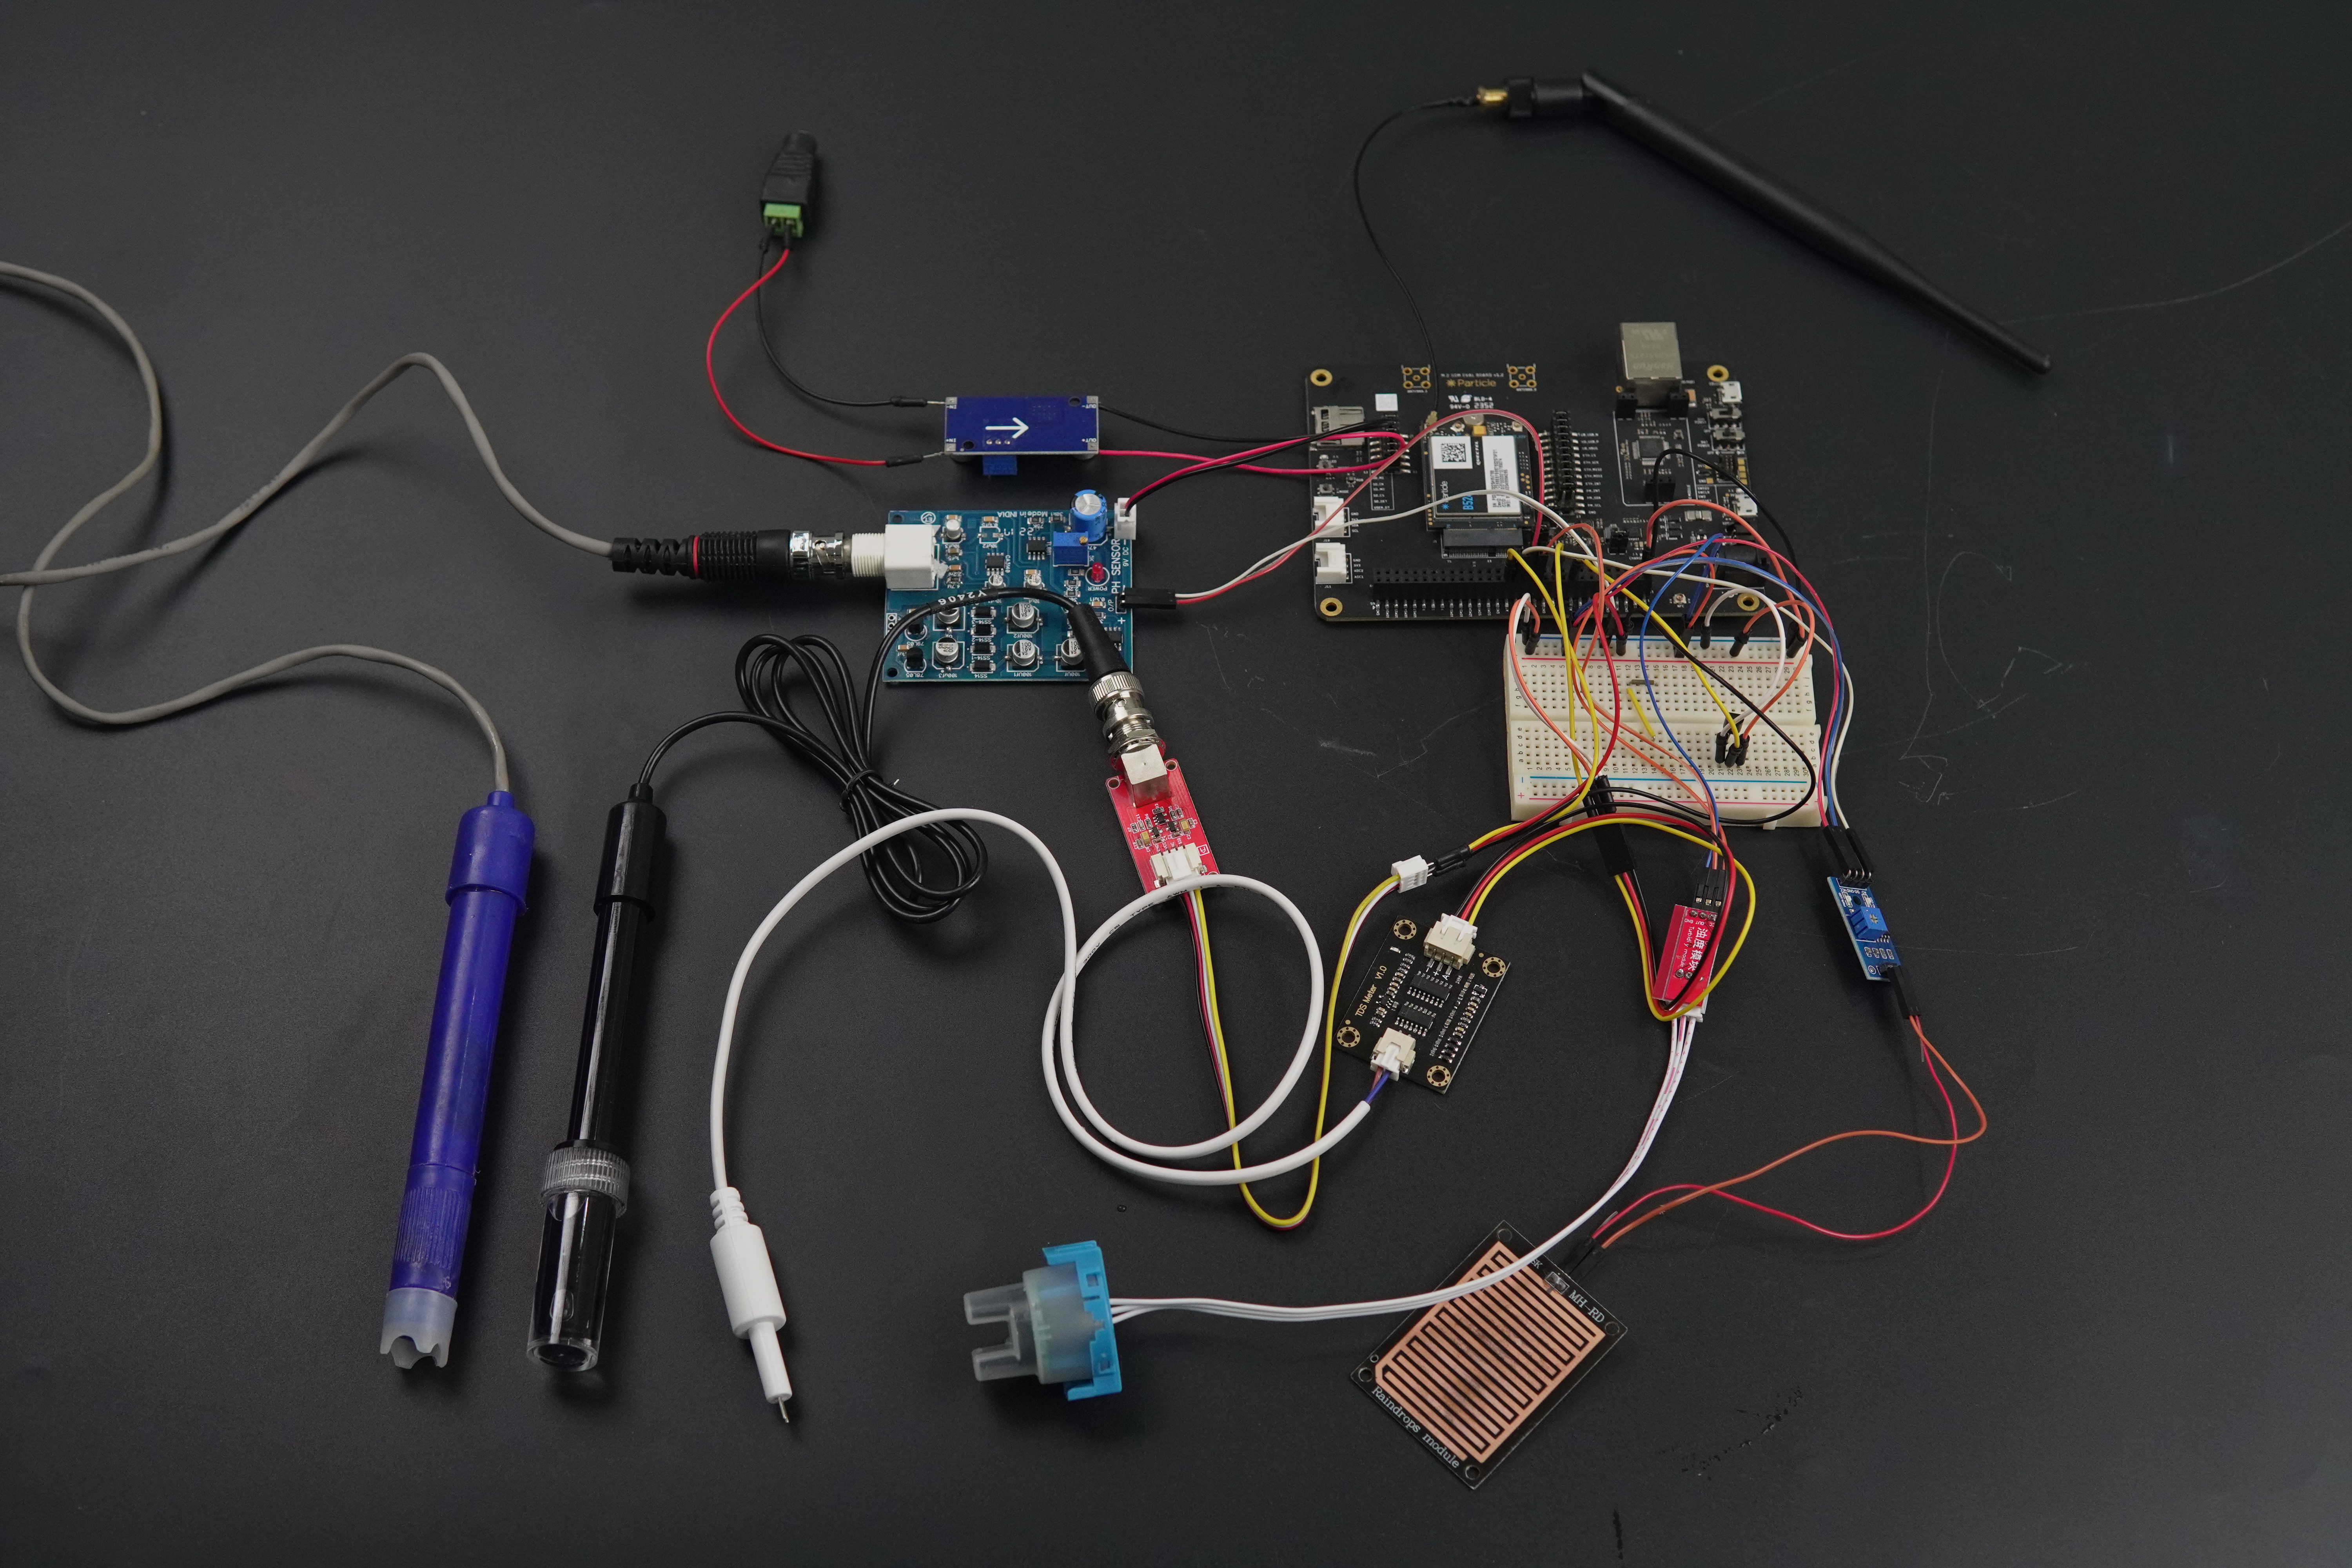
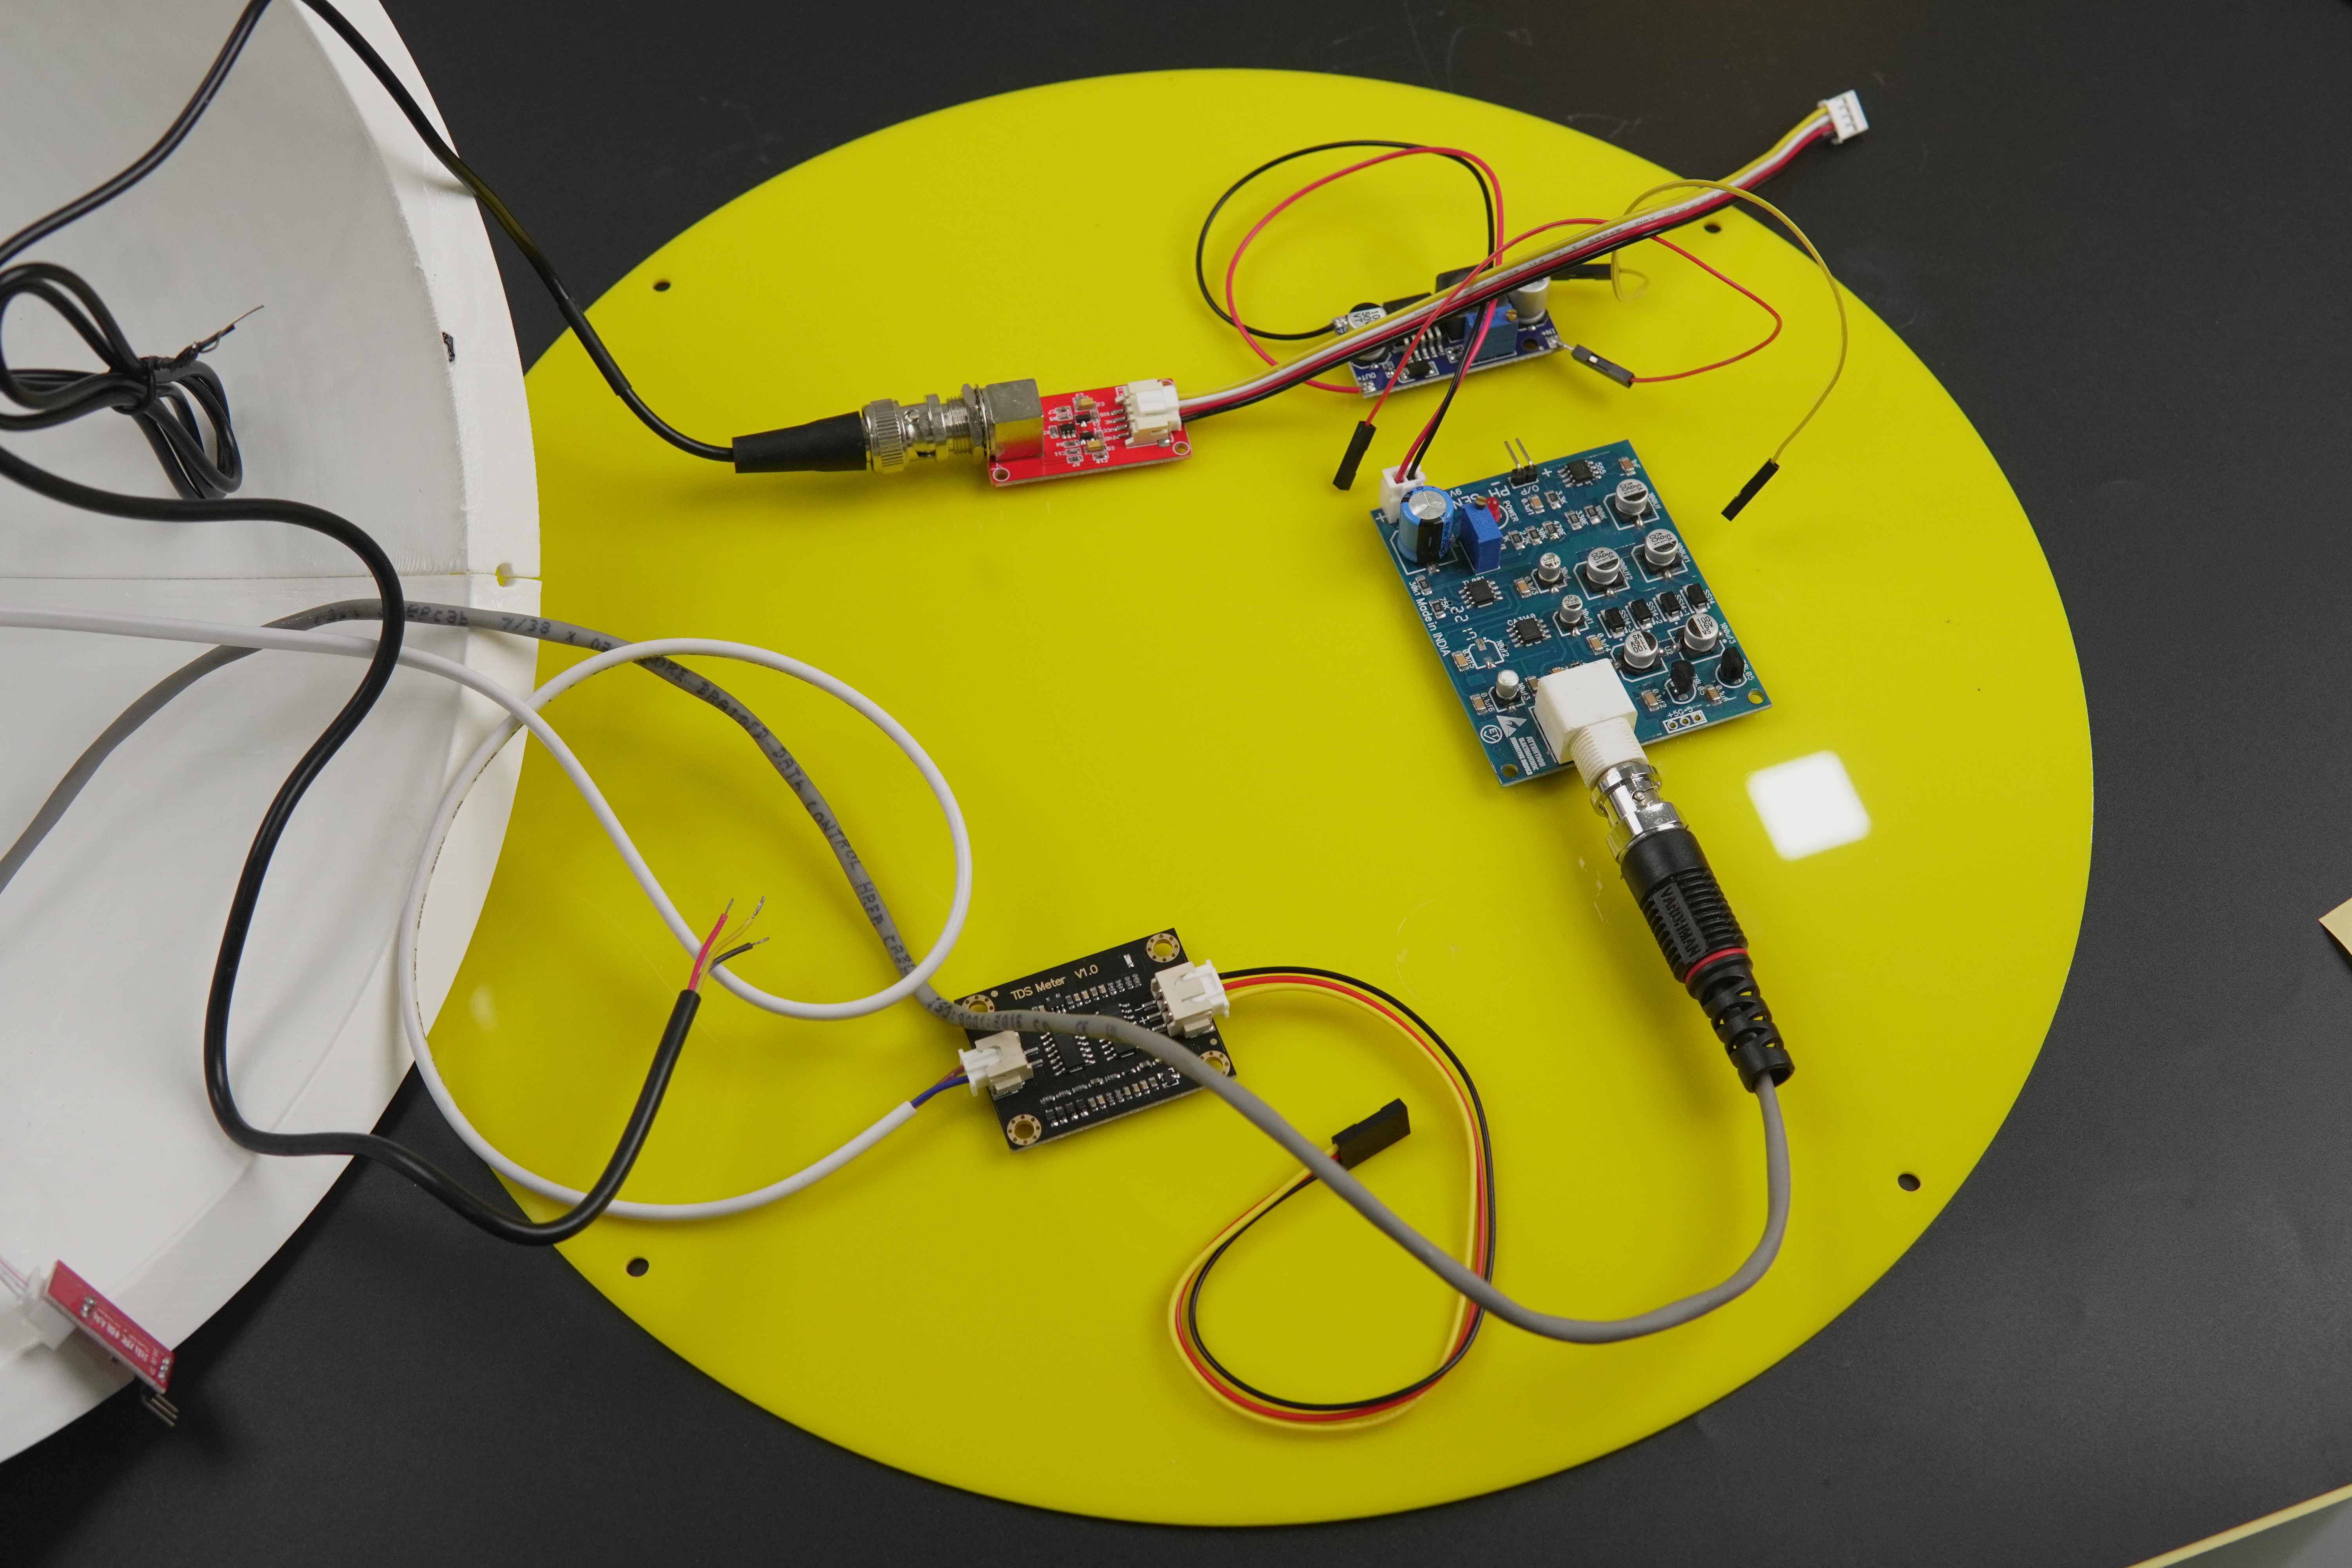
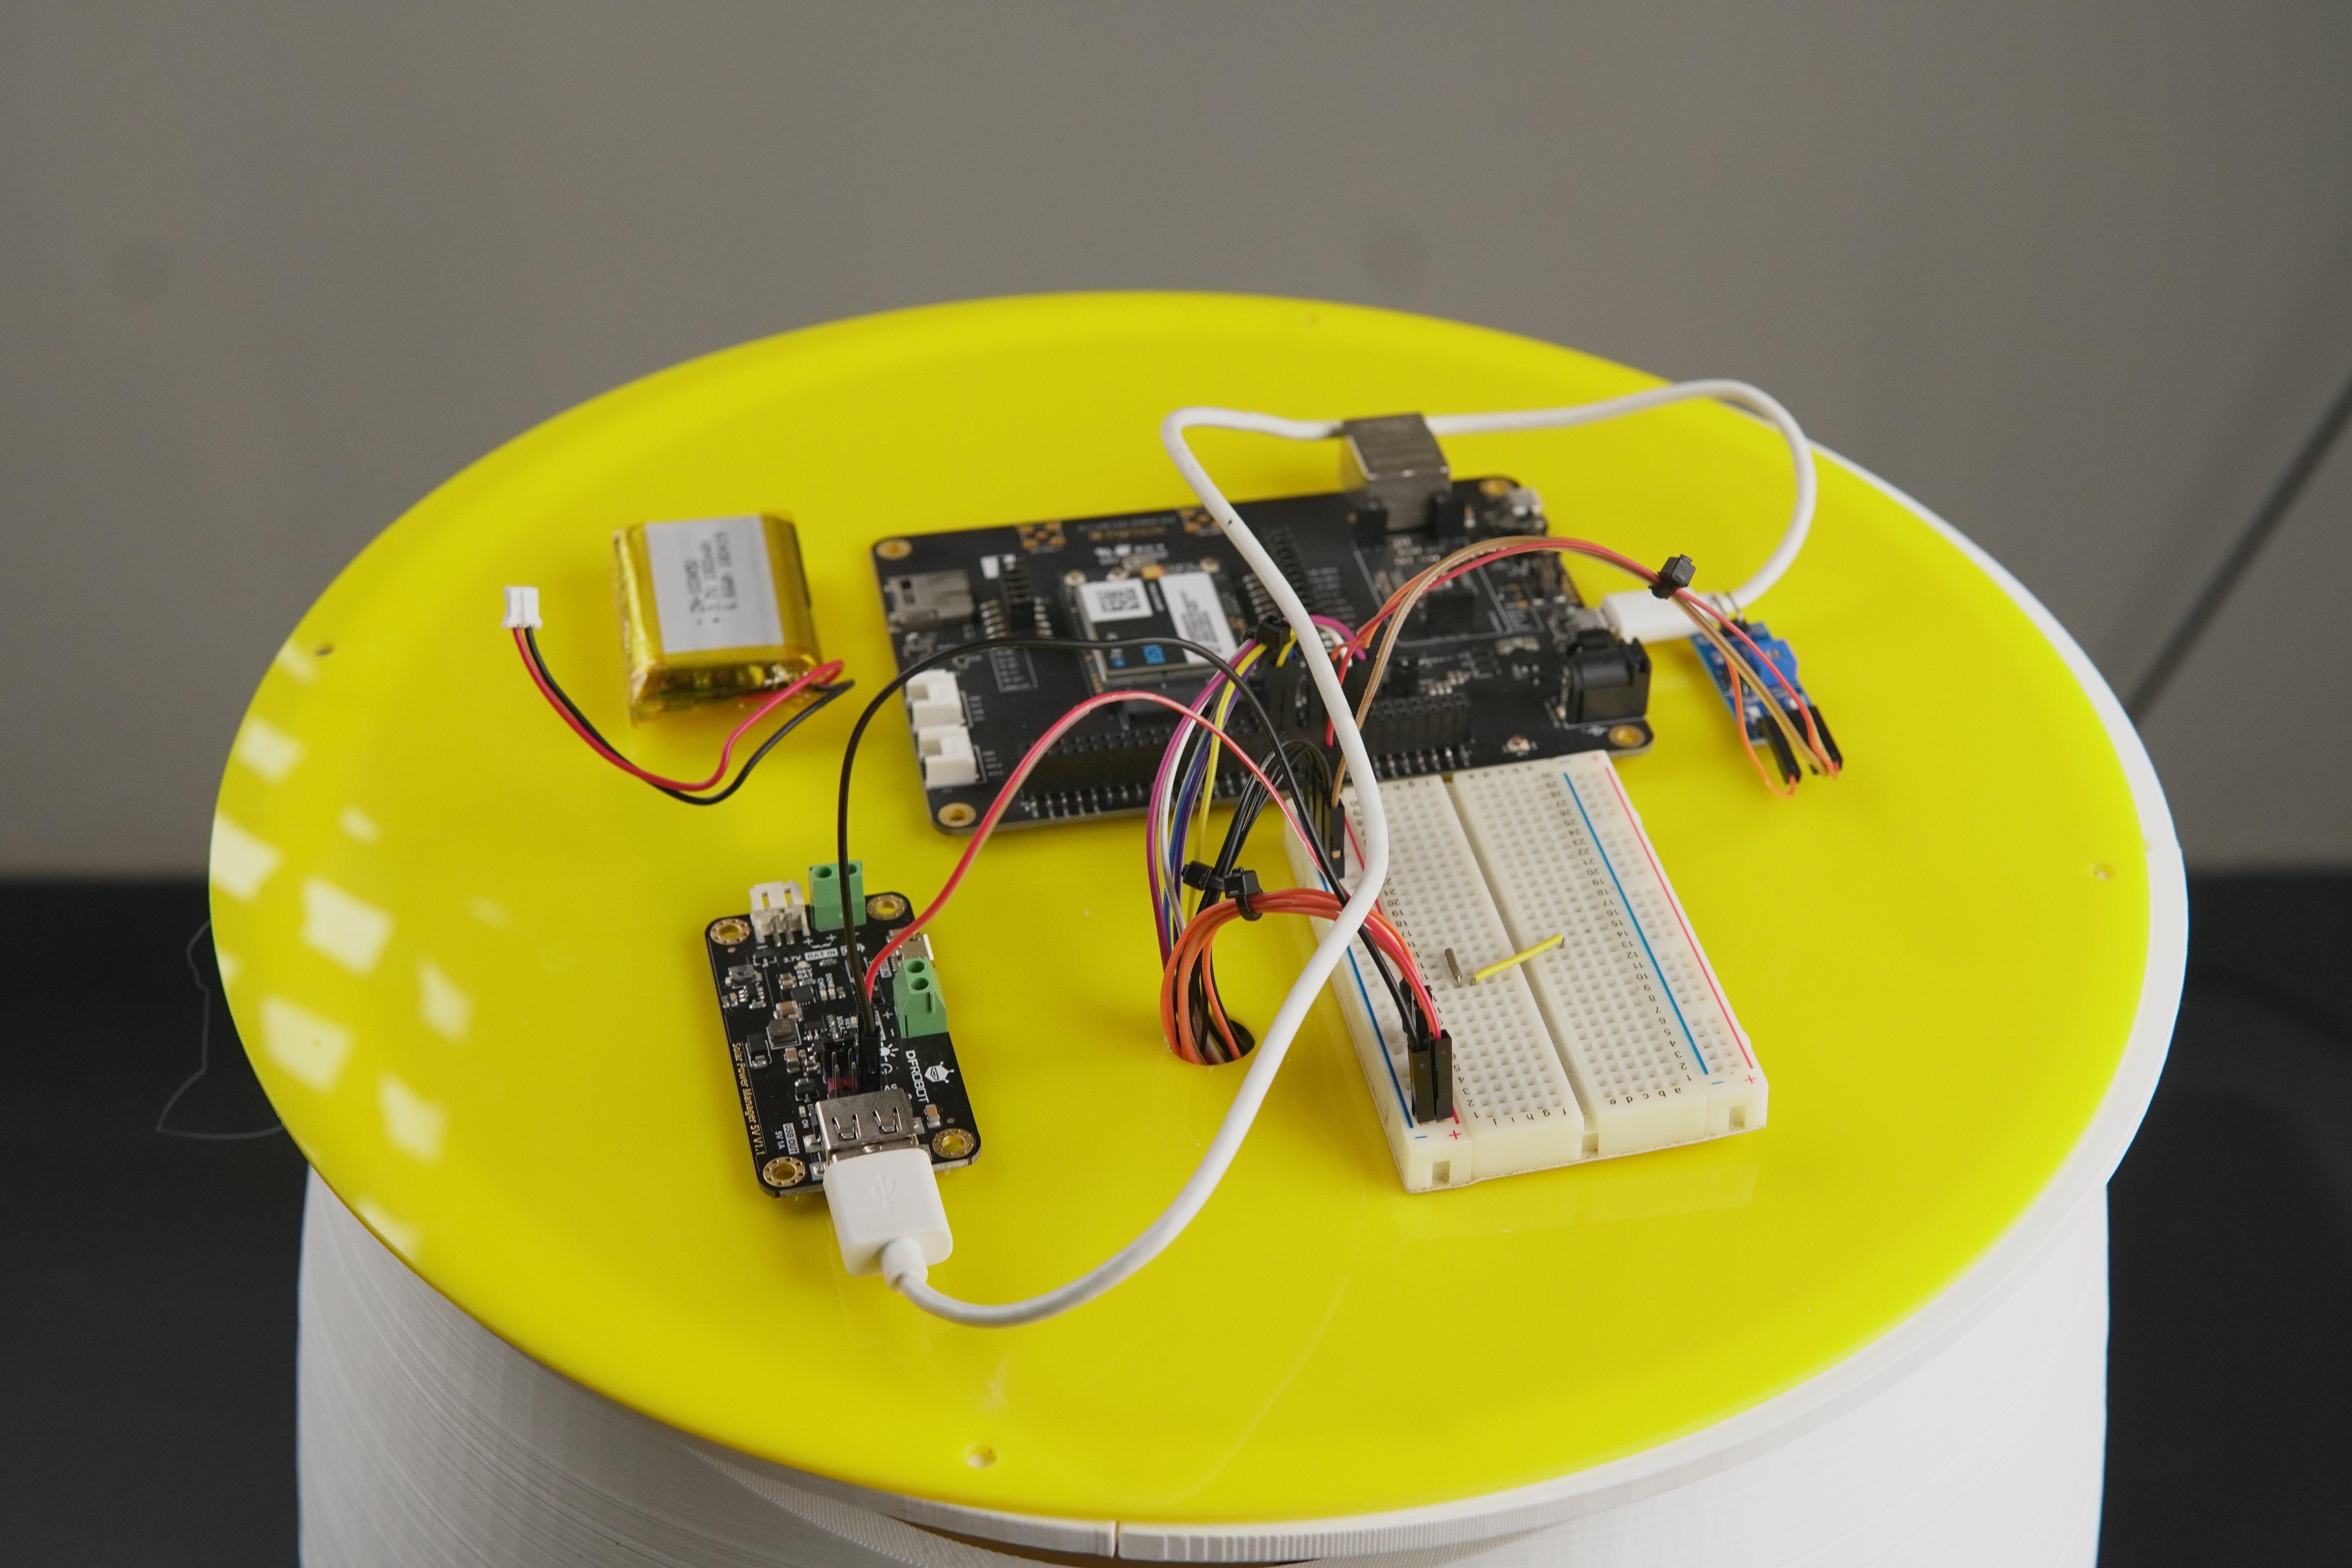
Before getting into the assembly we finalized code and the circuit using breadboard and jumpers,
First we secured the sensors on their corresponding slots.
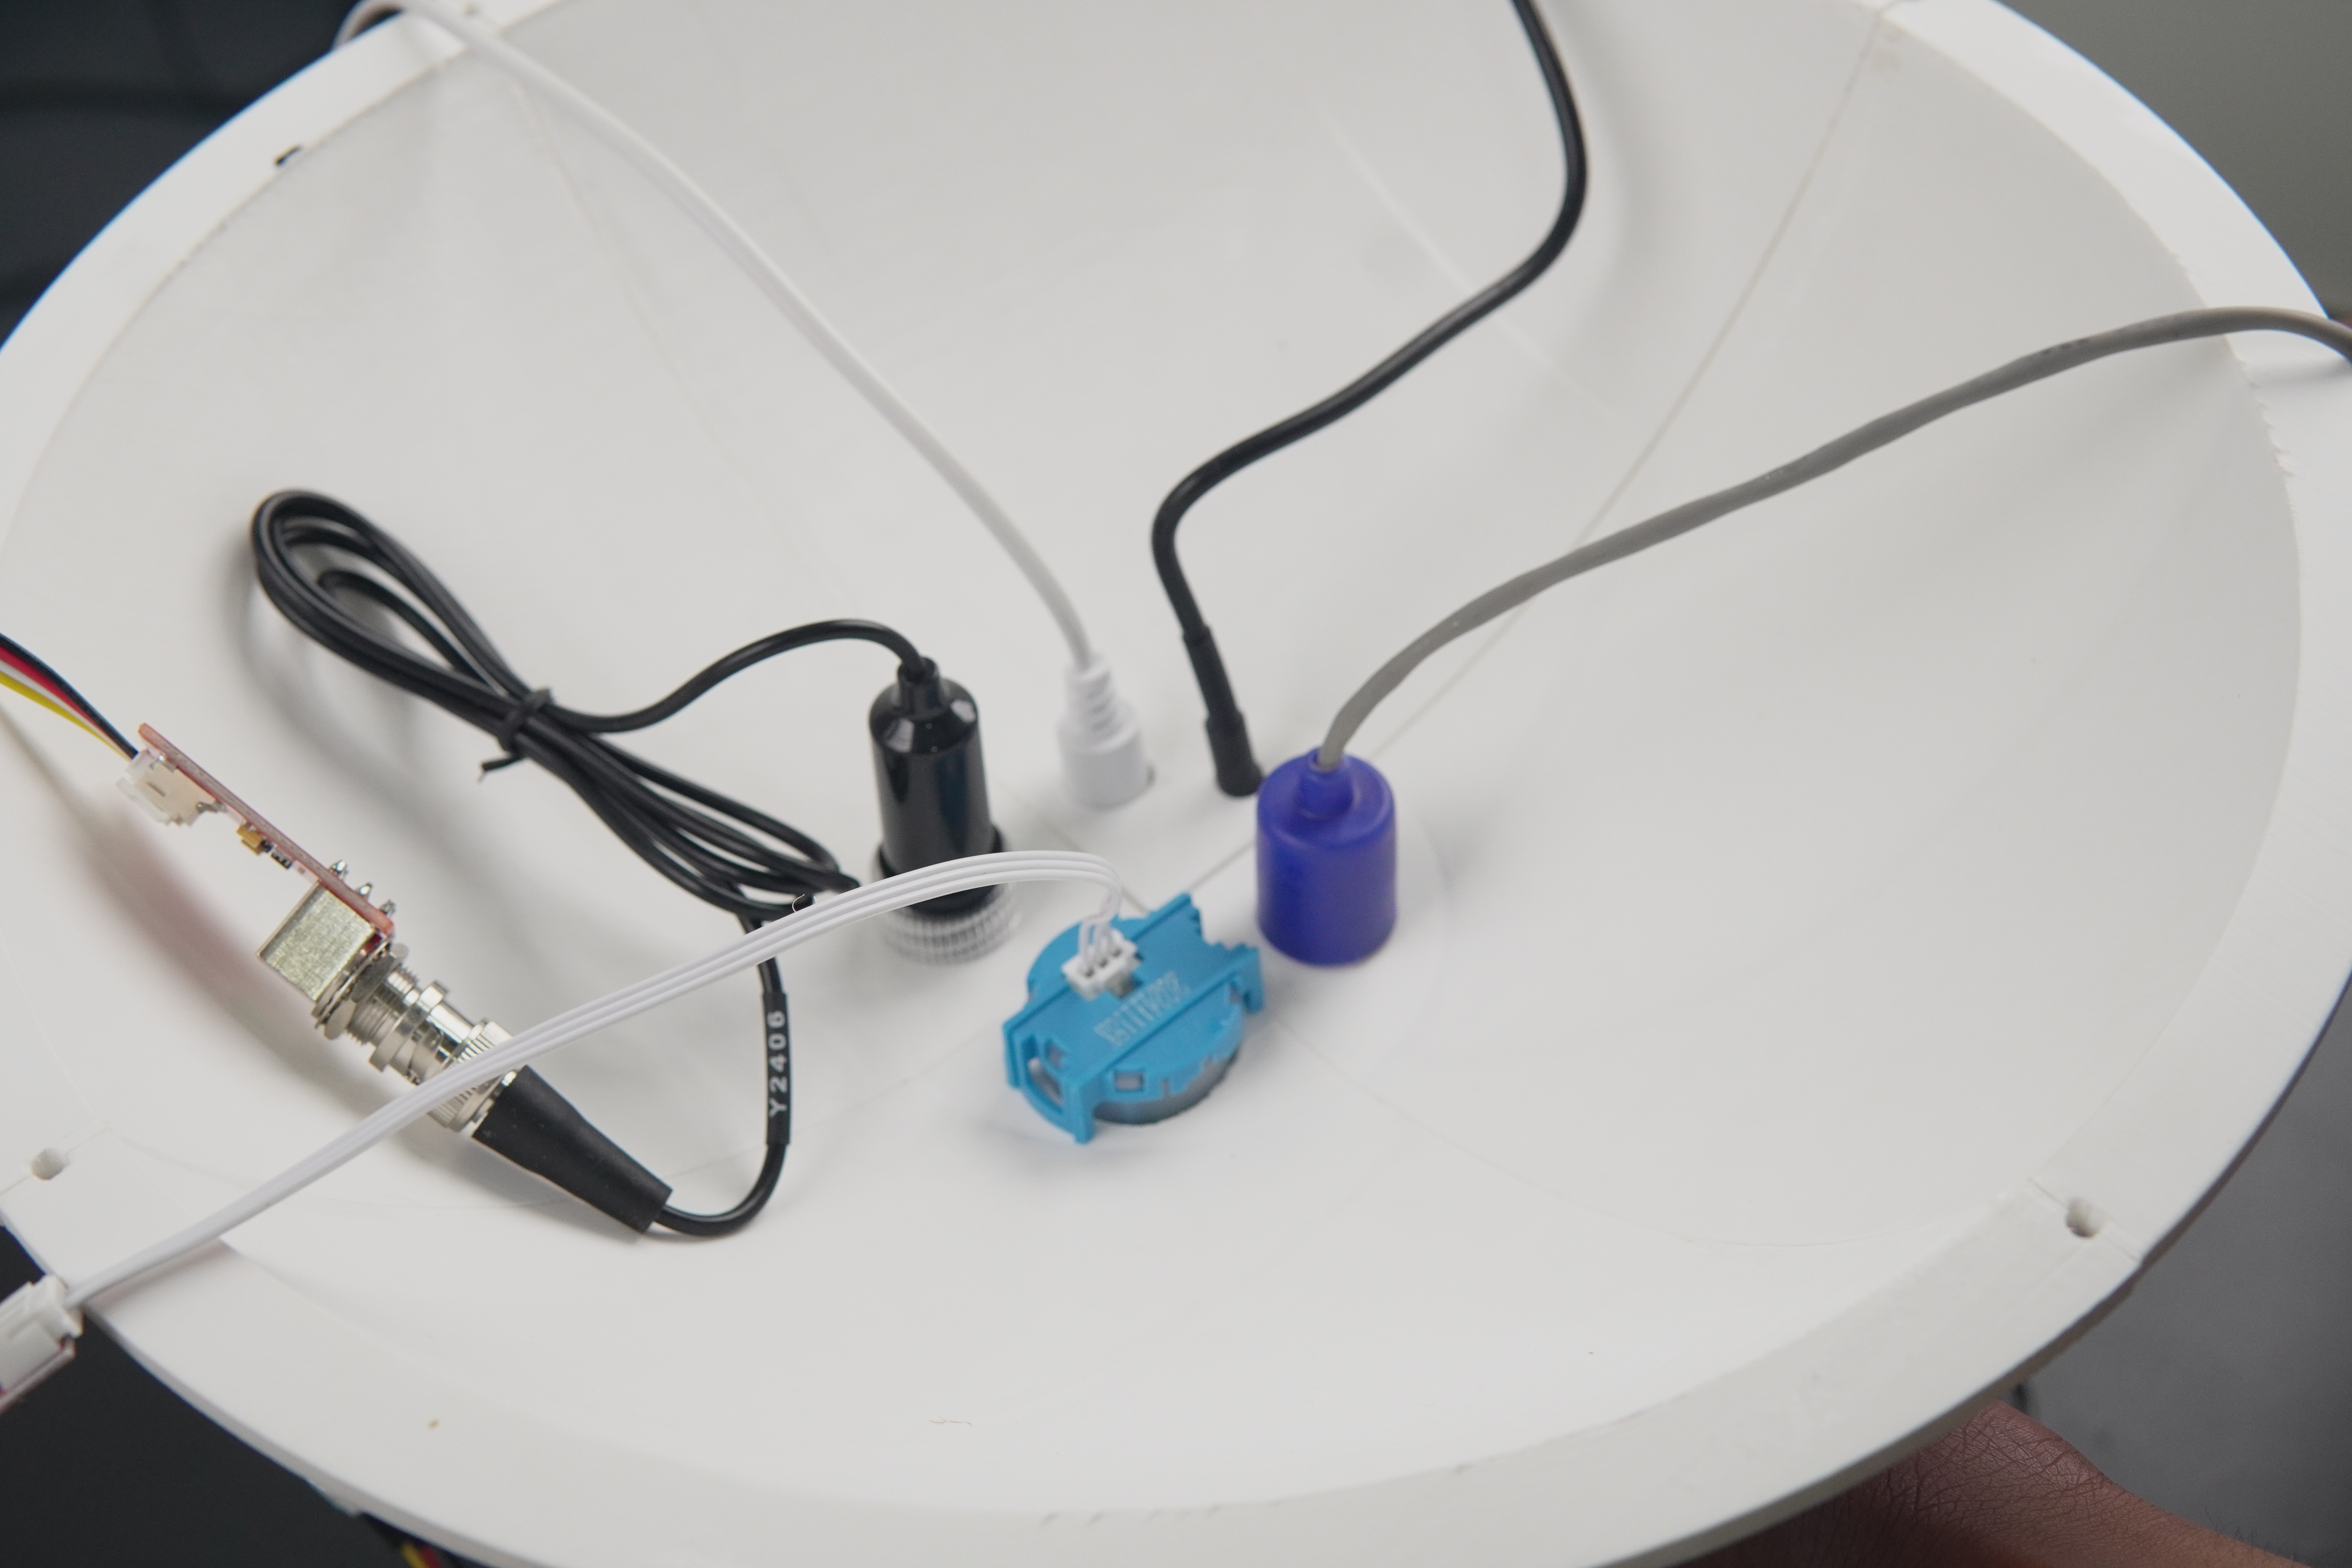
Then we secure the sensors breakout boards on the one side of acrylic and remaining on the other side.
Then we attached the solar panel and the rain sensor.
Then we fixed the three parts with the M3 nuts and bolts.
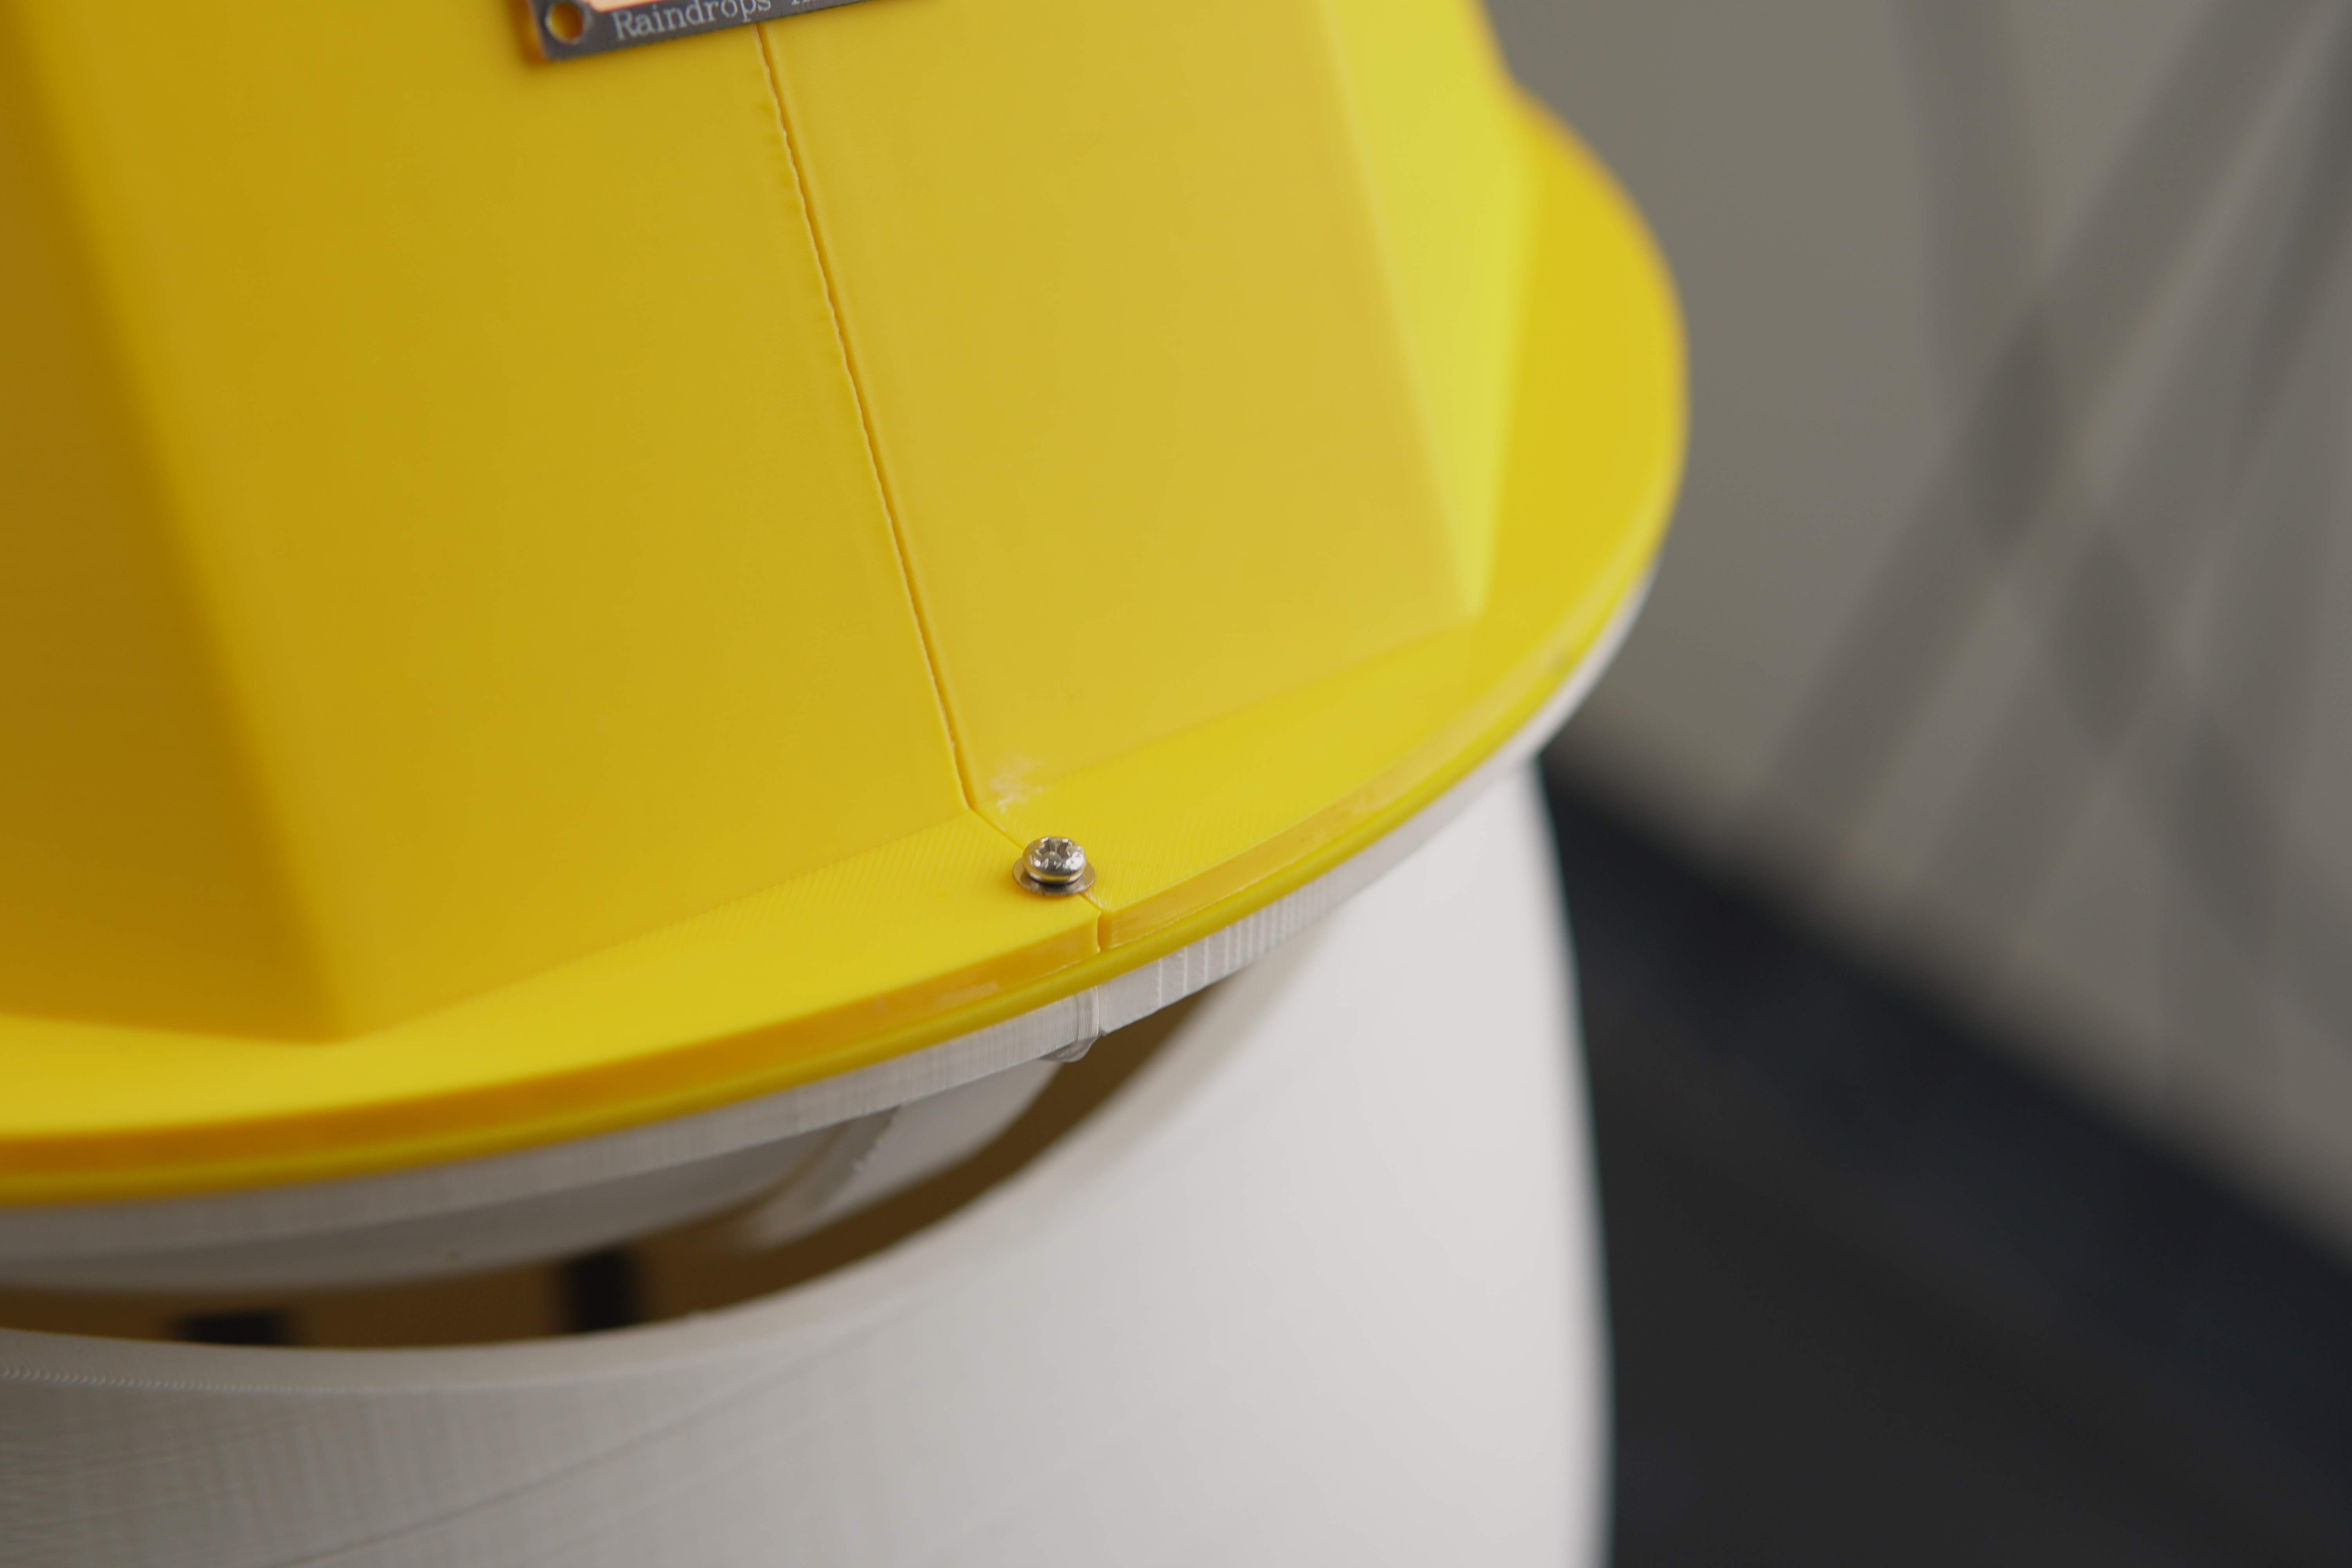
So here is the final version.
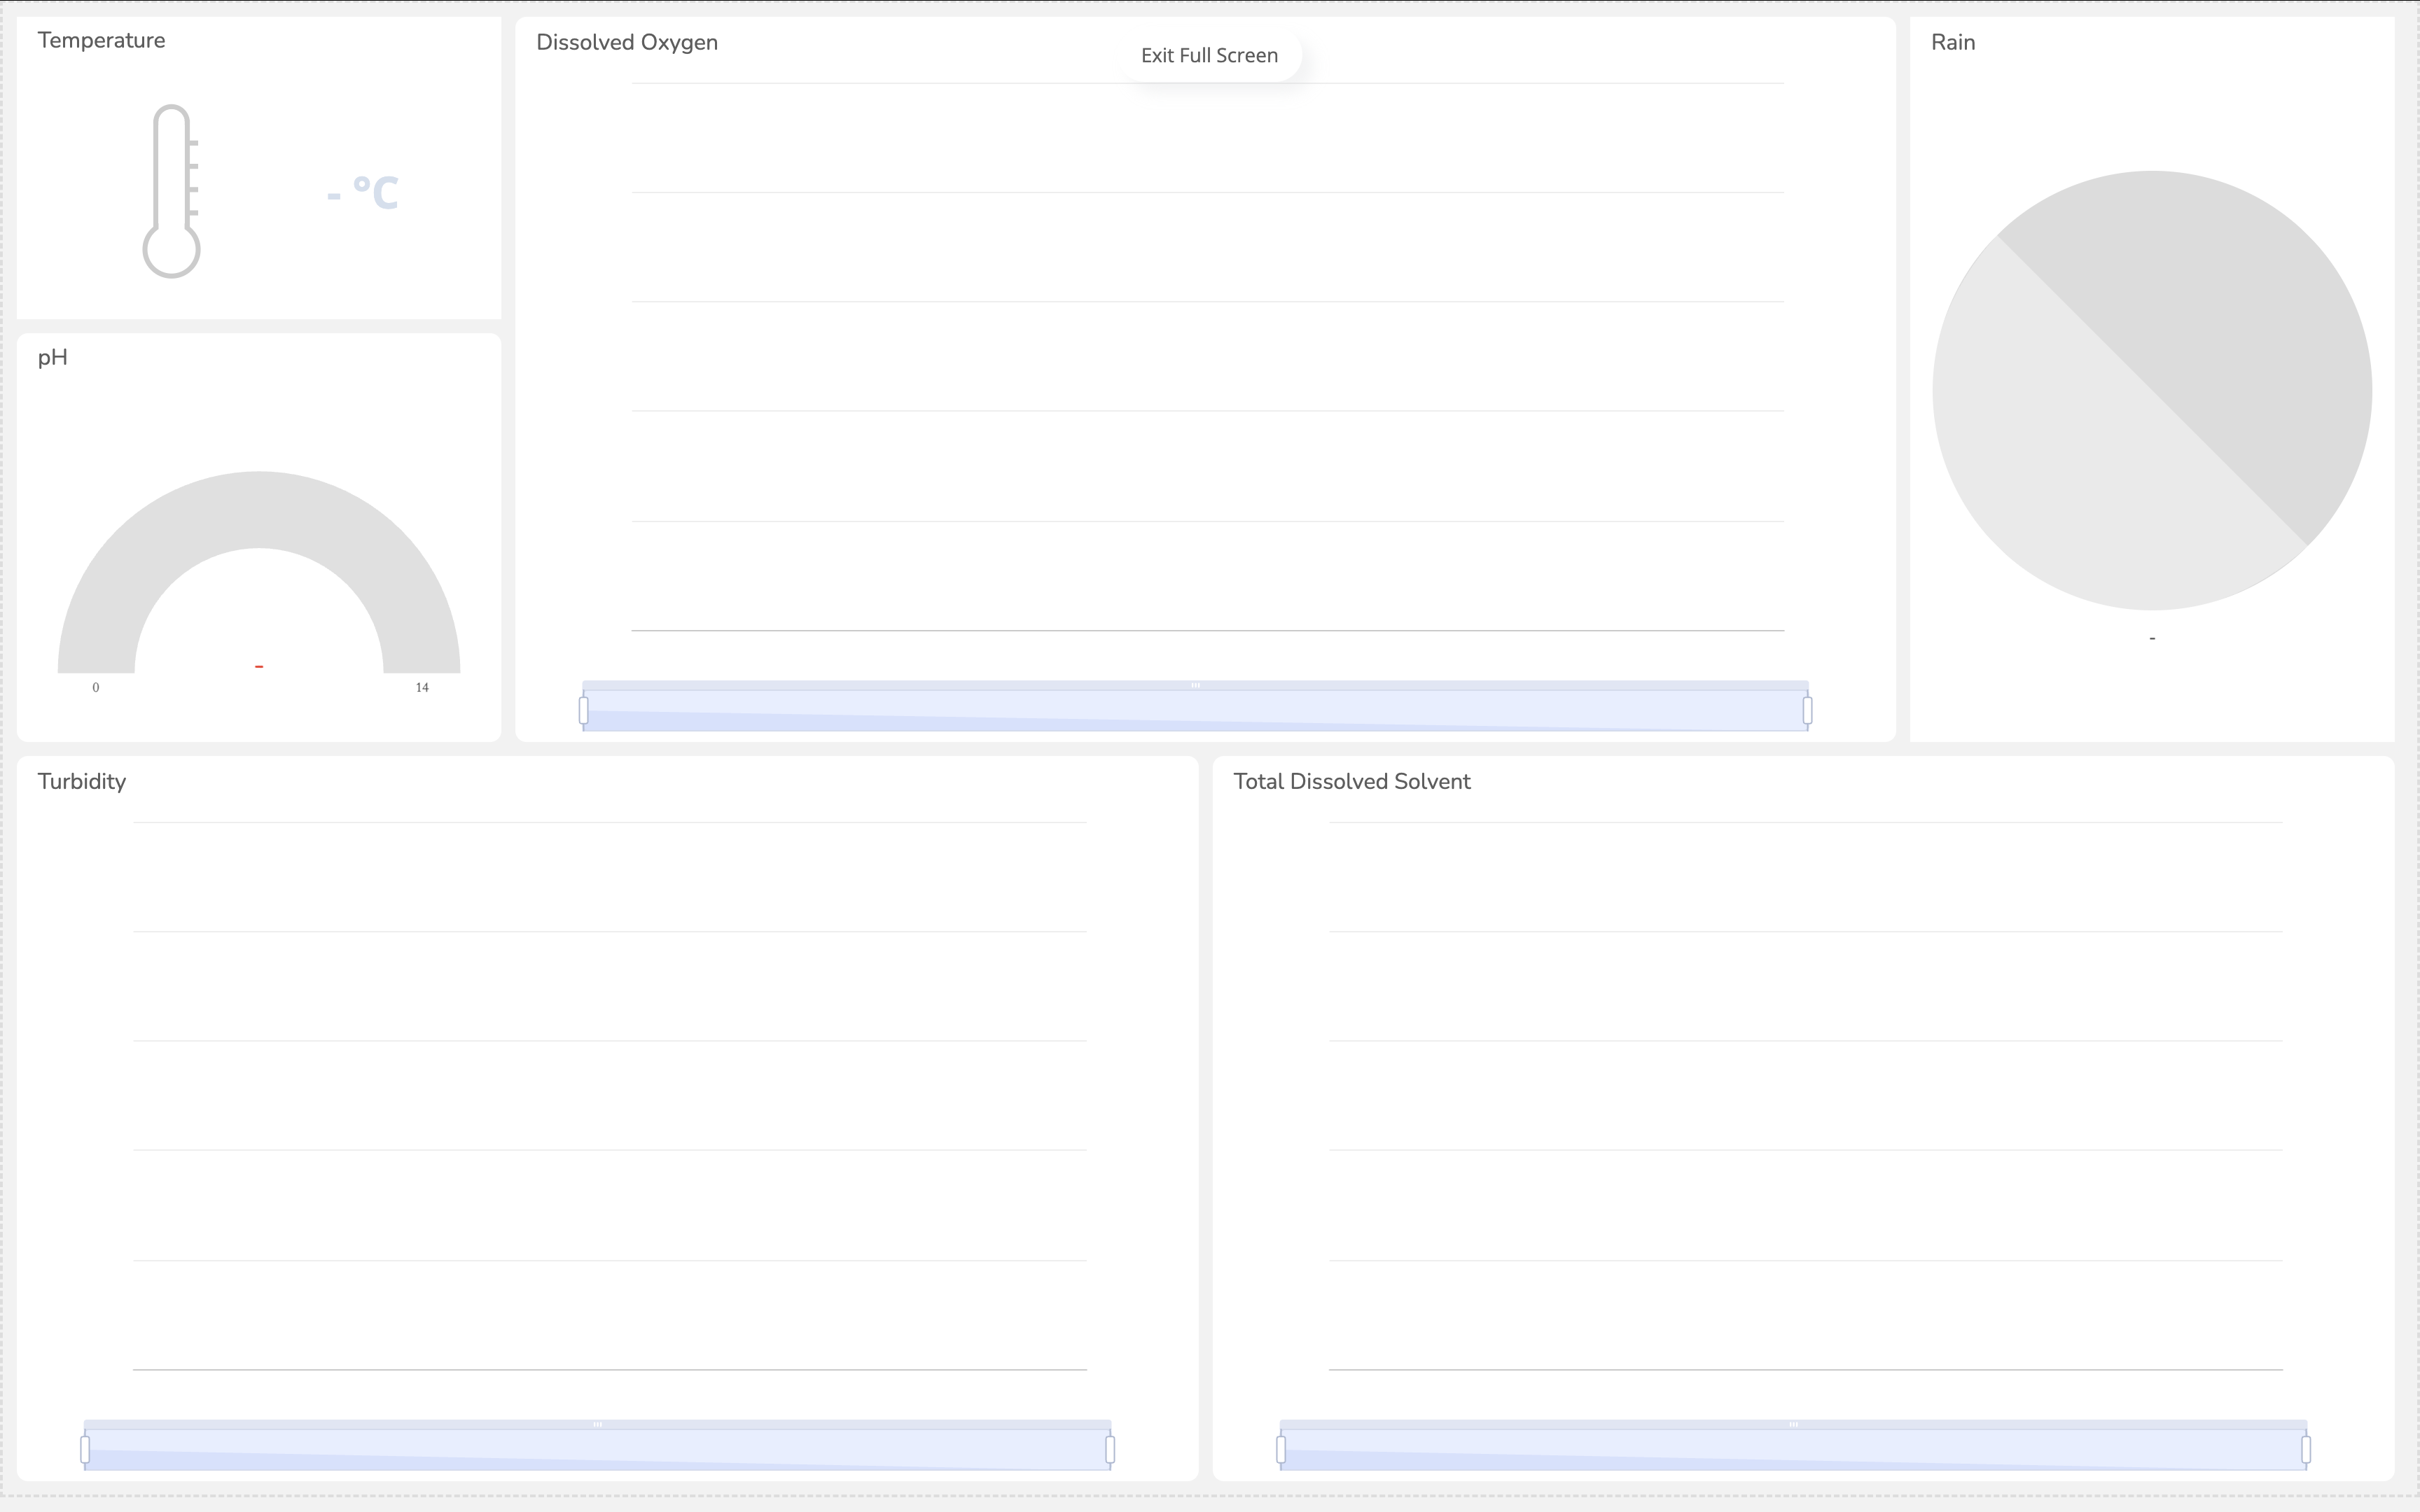
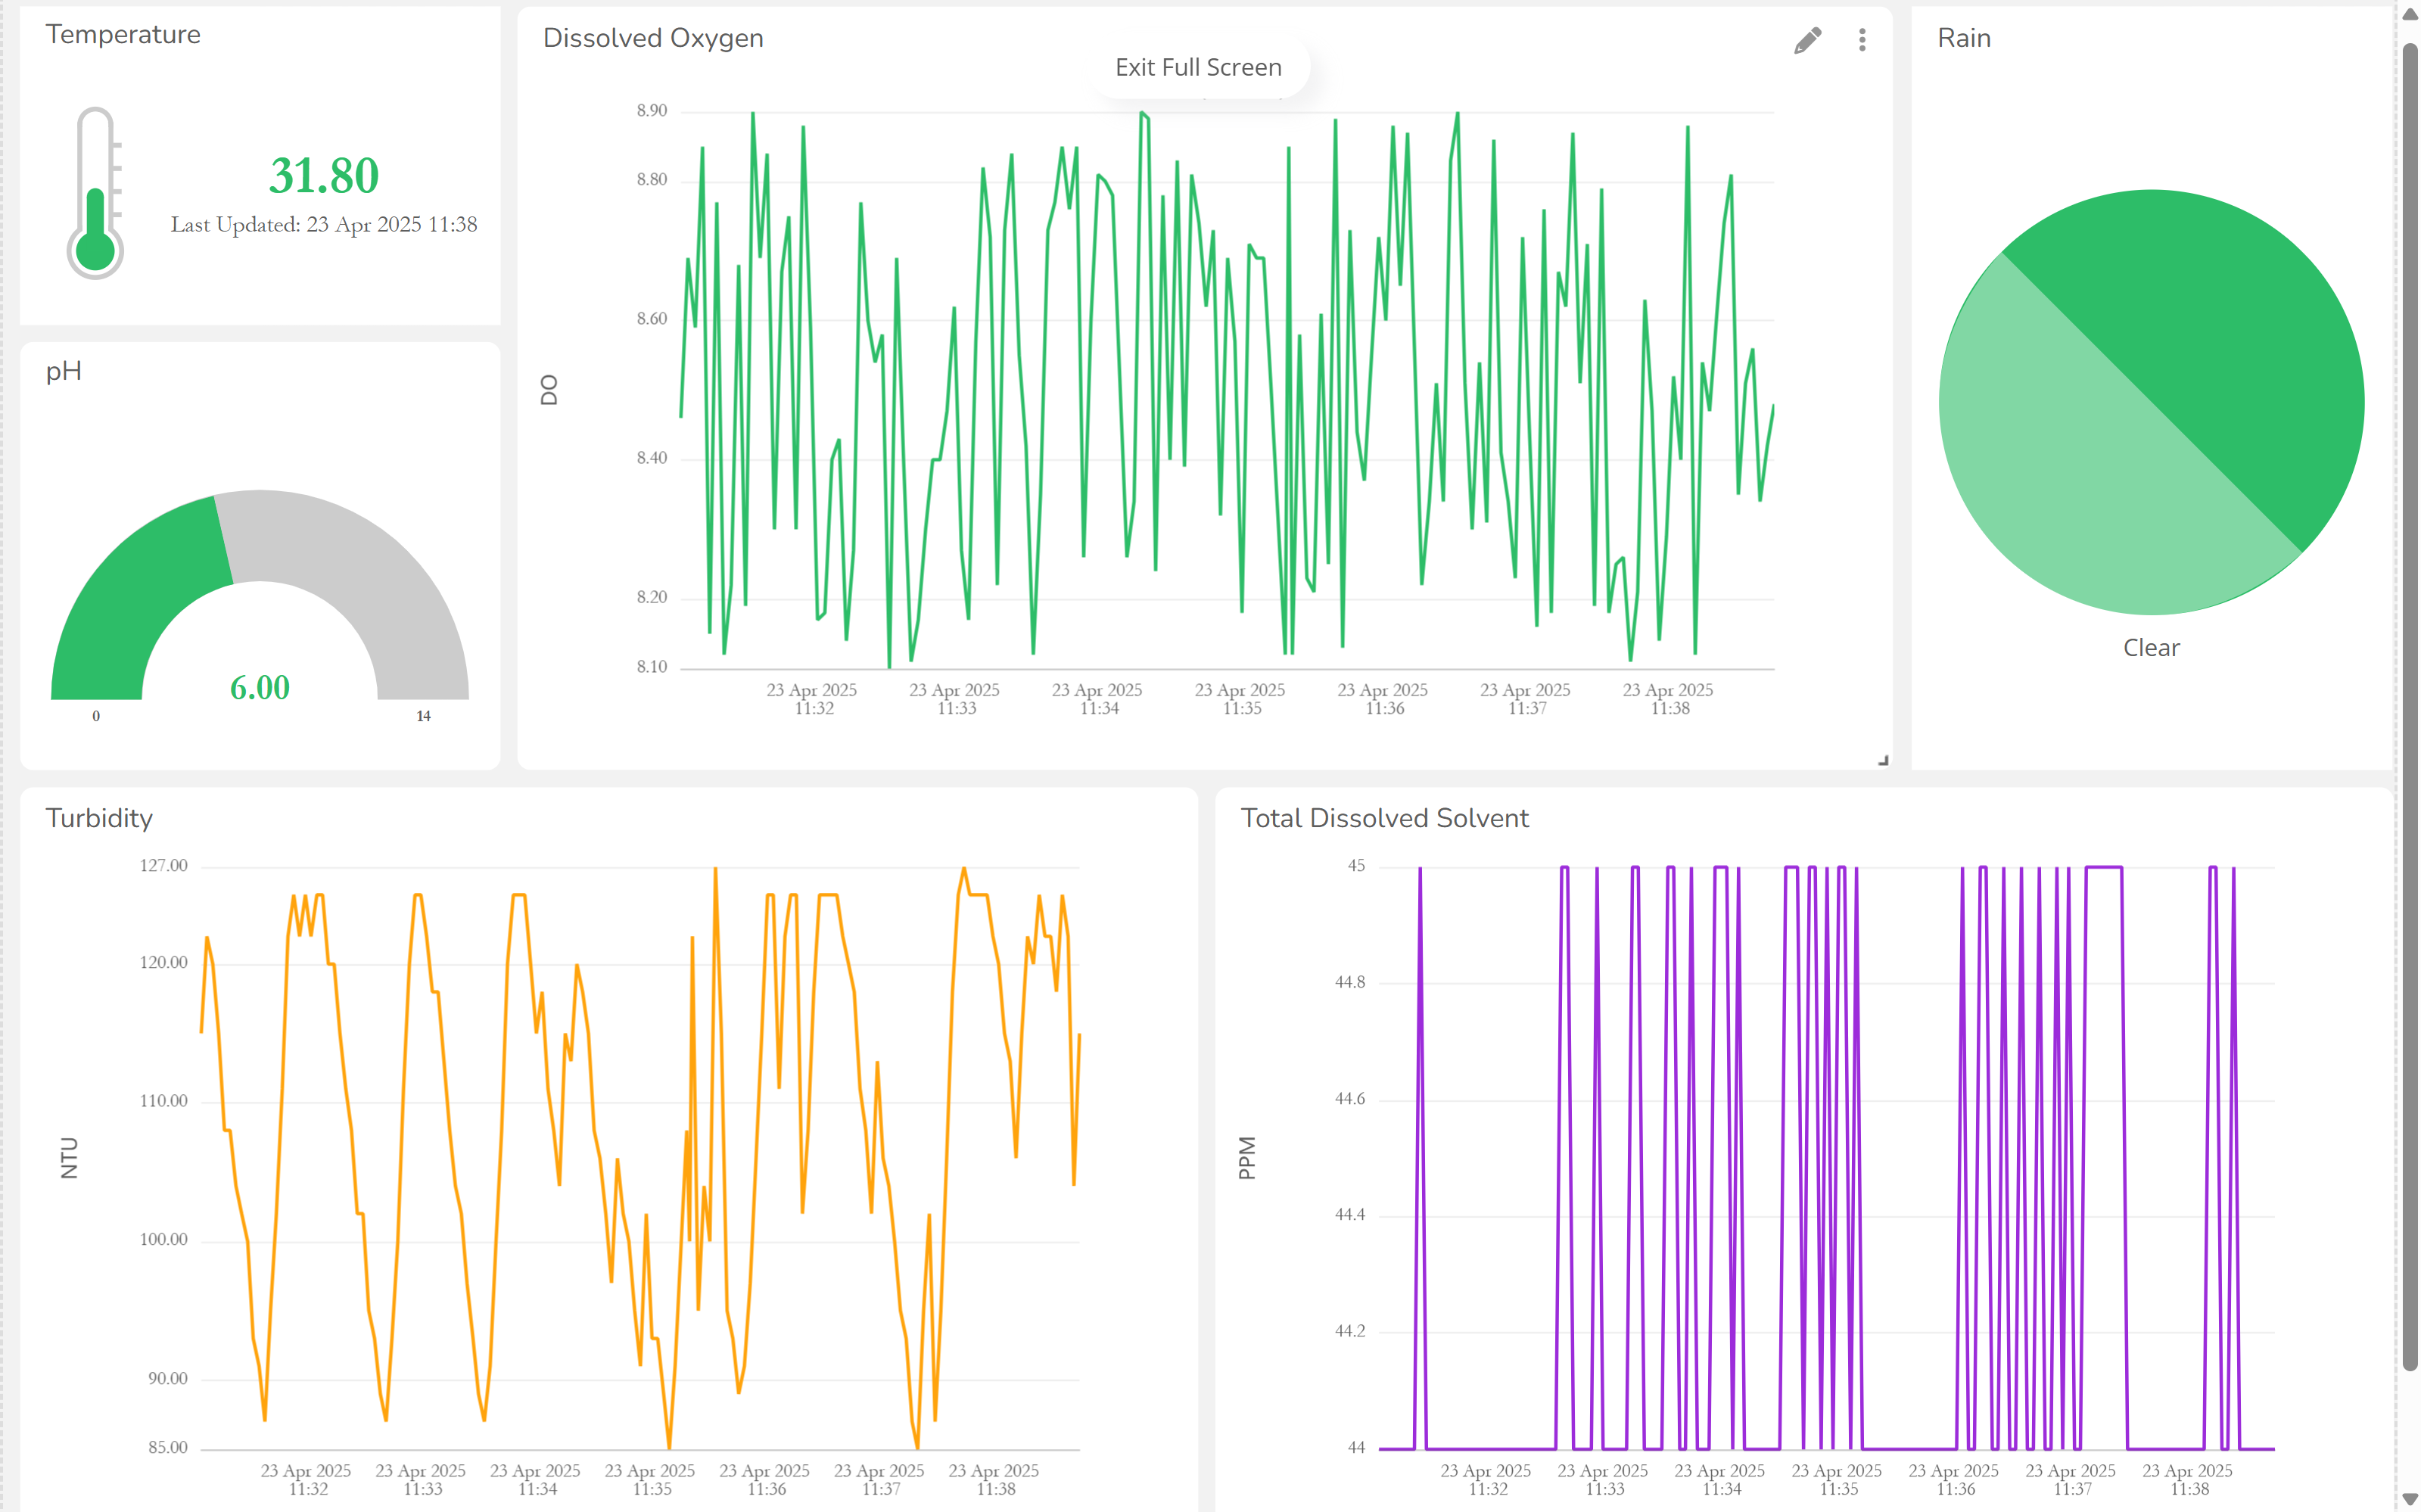
Ubidots Dashboard
We used Ubidots to visualize real-time sensor data from the buoy. The Particle B SoM sends temperature, pH, turbidity, dissolved oxygen, TDS, and rain sensor data to the Ubidots platform using webhooks. Ubidots provides a clean, user-friendly dashboard where each parameter can be monitored through graphs, gauges, and indicators.
Interconnecting Particle Cloud With Ubidots
To interconnect Particle cloud with ubidots follow these steps.
- Create an account at ubidots.com.
- Create a new device and note the device label.
- In the Particle console, go to Integrations > New Integration > Ubidots.
- Set the event name and paste the Ubidots API endpoint: https://industrial.api.ubidots.com/api/v1.6/devices/{device-label}
- Use the POST method and include your Ubidots Token in the header.
- Format your JSON body with the variable labels and values as
Once configured, data from the buoy will appear in Ubidots and can be customized into a real-time monitoring dashboard.
Sending Alerts With Ubidots
To create alerts, navigate to Data > Events, and then “Create Event.”
1. In the Triggers section:
- Click "Add Variable."
- Select your device and variable
2. Set condition:
- "is greater than" for upper limit
- "is less than" for lower limit
3. Enter the threshold value4. In the Action section:
- Click "Add Action."
- Select "Send SMS."
- Enter the recipient’s phone number (e.g., +1234567890)
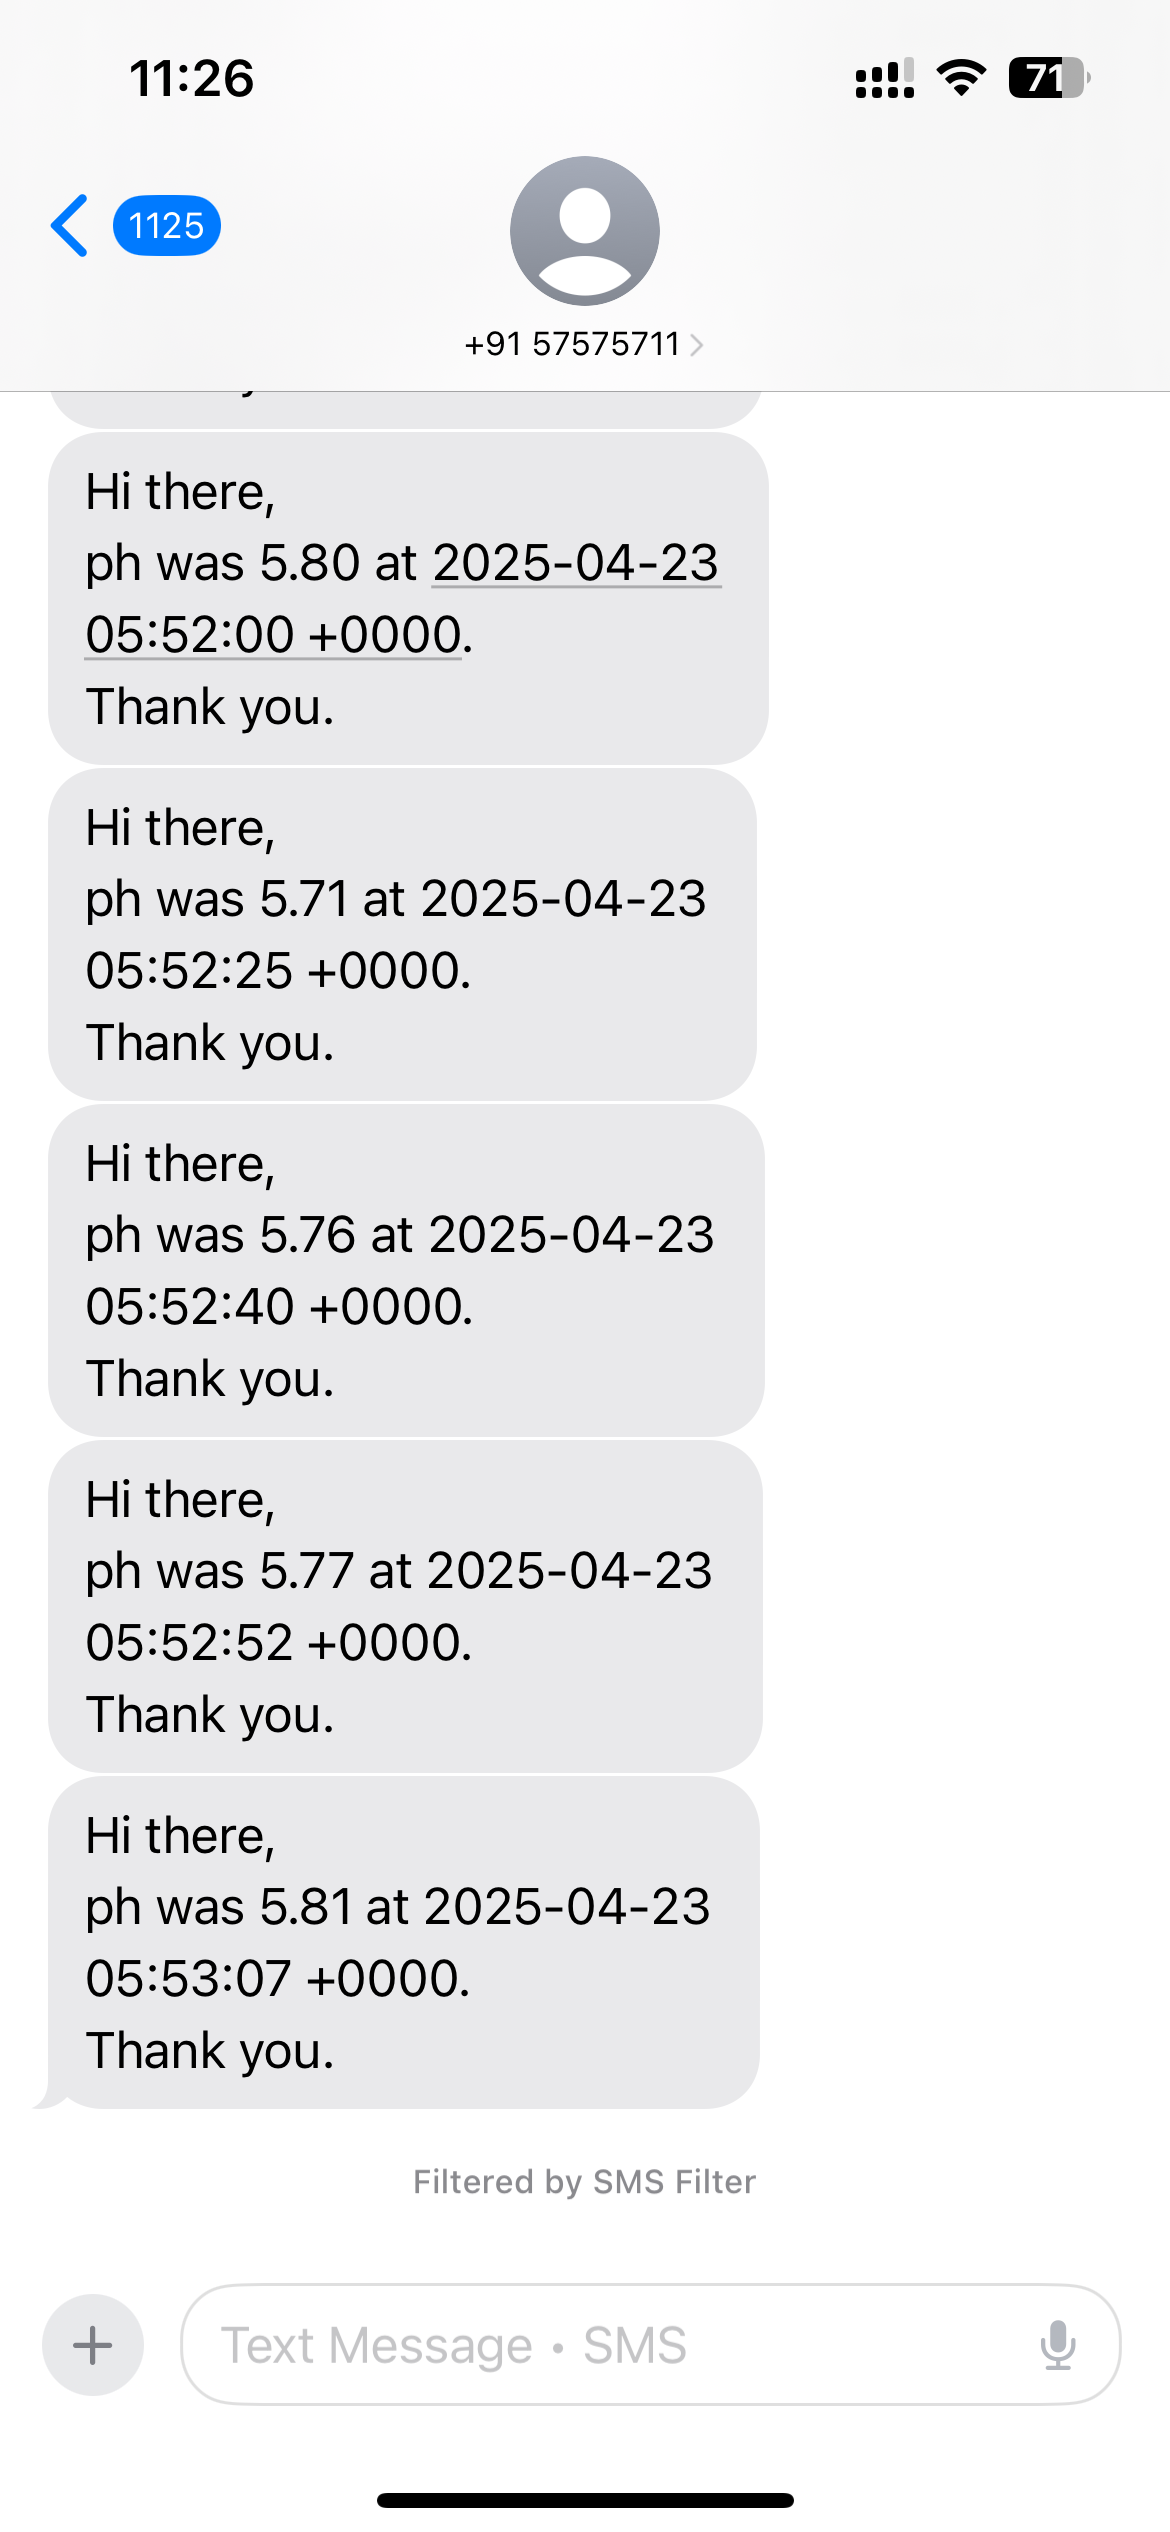
- Type the SMS message ( Hi there, {{Variable name}} was {{Trigger value}} at {{Trigger timestamp}} )
- In the Settings section, name your event (e.g., "Temperature High Alert")
- Click "Save."
5. Test by sending a value that triggers the condition.
Once everything is configured, you get alerts when the values cross the thresholds.
What Does This Offer
As aquatic ecosystems face mounting pressures from climate change and human activity, the need for continuous, intelligent monitoring has never been more critical. By integrating essential water quality sensors—including temperature, pH, turbidity, total dissolved solids (TDS), and rainfall detection—into a compact, waterproof, and solar-powered platform, this buoy offers a comprehensive snapshot of aquatic health. Its universal design ensures it can be deployed not only in aquaculture settings like shrimp or fish farms, but also in lakes, rivers, reservoirs, and coastal zones for conservation, research, or pollution control efforts.
Beyond its technical capabilities, the Smart Buoy empowers communities, researchers, farmers, and environmental agencies with actionable insights to make informed decisions. It enables early detection of harmful changes in water conditions, helping to prevent disease outbreaks, habitat degradation, and biodiversity loss. Whether it’s ensuring optimal growth conditions for aquatic species, supporting sustainable farming practices, or safeguarding delicate ecosystems, this smart buoy offers a scalable, cost-effective approach to environmental stewardship—demonstrating how accessible technology can play a vital role in protecting our planet’s most precious resource: Water.