Differential Thermal Analysis Using Arduino and PhyPhox
by AlbertoVillalobos in Circuits > Arduino
4776 Views, 23 Favorites, 0 Comments
Differential Thermal Analysis Using Arduino and PhyPhox


When a solid substance is heated the increase in energy manifests itself in the form of an increase in temperature.
If the heating rate is constant the temperature increase is also constant as long as there is no change in the structure of the substance.
At the time when some kind of transition is initiated in the substance, for example fusion, change of crystal structure or other, the temperature will not increase at the same rate because part of the heating energy will be used in that change of state.
If we compare the temperature of the substance that is experiencing the change of state (Sample) with that experienced by another substance that remains stable (Reference) during heating under identical conditions and subtract a temperature value from another (Sample - Reference) we will be performing what is known as Differential Thermal Analysis (DTA).
The objective of this Instructable is to show the basics of the DTA using Arduino microprocessor, a home heater and a free access program (PhyPhox) that will allow us to obtain on our cell phones curves of Sample Temperature vs Difference (Sample Temperature - Reference temperature) known as thermograms.
Supplies
- Cell Phone (Android or iOS).
- PhyPhox app (Google Play or AppStore).
- 1 Plastic container with multiple compartments.
- 2 Waterproof DS18B20 temperature sensor.
- 2 Breadbord mini modular.
- 1 Arduino Nano V3.0 CH340 with mini usb cable.
- 1 Bluetooth Low Energy BLE CC2541 Bluetooth 4.0 UART.
- 1 1k ohm resistance.
- 1 2k ohm resistance.
- 1 4,7k ohm resistance.
- Male/Male jumpers wire.
- Male/Female jumpers wire.
- 1 Portable battery charger (6000 mAh 3.7V, Out 5V, Output Max. 2.4A).
- 4 Glass test tubes (approximately 1 cm in diameter and 7.5 cm long)
- Wooden base (circular or square of approximately 20 cm in diameter or side).
- 1 Ceiling lampholder (E27).
- 1 Incandescent light bulb of 25 Watts (E27).
- 1 Rotary dimmer switch.
- Approximately 1 m of electrical cable (two cores 0.4 mm thick).
- 1 Two pin electric socket.
- 1 Clothes dryer aluminum duct reducer (10.16 cm to 7.62 cm).
- 2 Disposable circular aluminum plates of approximately 20 cm in diameter.
- 2 Wire insulate screw cap.
- Electrical tape.
- Silicone or Epoxi glue.
- Plastic fasteners.
Heating Device


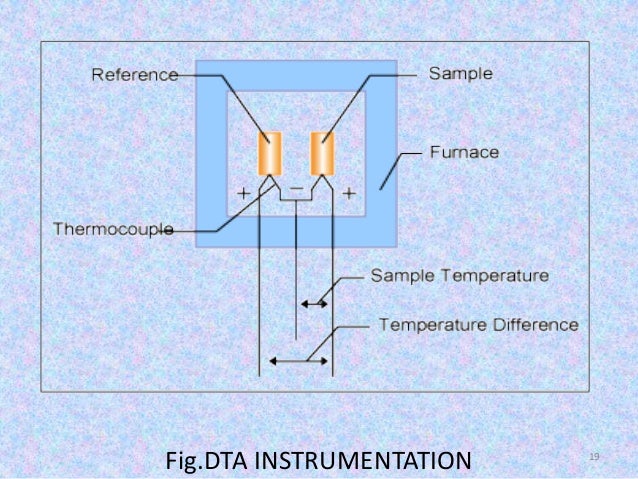
A DTA equipment basically consists of a furnace containing two containers, one for the Sample and one for the Reference and two sensors that measure the temperature of Sample and Reference simultaneously.
The temperature inside the furnace and its heating or cooling rate must be very well regulated so the construction of the furnace in professional equipment is an important factor in the design of a DTA apparatus, however for the illustrative purposes of this Instructable it was chosen to make a rather modest design using homemade materials (see supplies list) as indicated below :
- Fix on a wooden base a ceiling lampholder (E27) provided with two core electrical cable with two pin electric socket.
- Section one of the cores of the electrical cable and connect a rotatory dimmer switch, using wire insulate screw cap or electrical tape to reestablish the cable connection.
- Screw an incandescent light bulb (25 Watts, E27) into the ceiling lampholder.
- With the help of glue, fix on the surface of the ceiling lampholder a clothes dryer aluminum duct reducer (10.16 cm to 7.62 cm) so that the end of smaller diameter is like a chimney around the incandescent light bulb (Caution: Once the bulb is turned on this surface will be hot so there will be a danger of burn).
- Fold the surface of a disposable circular aluminum plates in such a way as to form a concavity that fits on the chimney formed by the clothes dryer aluminum duct reducer (see video in Step 3).
- Using another plate repeat the previous operation forming a concavity that fits on the first and in which two holes near the top of the concavity but separated from each other will be drilled, with a diameter that allows to receive the test tubes (approximately 1 cm in diameter and 7.5 cm long) of Sample and Reference.
- Insert the Sample and Reference test tubes into the drilled holes by pushing until only about 1 cm is left outside. Deform the surface of the aluminum sheet in such a way that they fit on the surface of the test tubes and fix them.
- Hold both aluminum concave covers firm using a plastic fastener.
Arduino Connections, Code and Sensor Calibration


The connections to the Arduino controller are shown in a Fritzing scheme that is attached (DTA_Arduino_BLE.fzz). Also attached is the programming code of the Arduino Nano V3.0 CH340 (DTA_Arduino_BLE.ino).
// DTA_Arduino_BLE
// IDE 1.8.5
// Adapted and modified by Alberto Villalobos (IDE 1.8.5)
// References:
// 1. http://hombrosdegigantes.blogspot.com
// 2. http://cetroniconline.blogspot.com/2014/07/tutorial-arduino-iv-sensor-de.html?m=1
// 3. https://randomnerdtutorials.com/guide-for-ds18b20-temperature-sensor-with-arduino/
// 4. http://diymakers.es/arduino-bluetooth/

#include
#include
#include

float CorrTempRef = 0.37; //Correction to the temperature initially measured by the Reference sensor
float CorrTempSamp = 0.69; //Correction to the temperature initially measured by the Sample sensor
AltSoftSerial BTserial(9, 8); // RX | TX

// Data wire is conntec to the Arduino digital pin 4

#define ONE_WIRE_BUS 4

OneWire oneWire(ONE_WIRE_BUS);
DallasTemperature sensores(&oneWire);

// ***** Indicate the directions of the sensors (each DS18B20 sensor has its own code) *****

DeviceAddress Ref = {0x28,0xFF,0x68,0xDD,0x64,0x15,0x02,0x6F};  // See References 1 and 2
DeviceAddress Samp = {0x28,0xFF,0x2E,0x90,0x64,0x15,0x02,0x67}; // See References 1 and 2

void setup(void)
{
  Serial.begin(9600);
  BTserial.begin(9600);

  sensores.begin();
}

void loop(void)
{
  sensores.requestTemperatures();

  float TempSensorRef = sensores.getTempCByIndex(Ref)+CorrTempRef;//Reference Sensor
  float TempSensorSamp = sensores.getTempCByIndex(Samp)+CorrTempSamp;//Sample Sensor

  // ***** Establish the resolution for each sensor *****

  //9 bits 0.50 ºC
  //10 bits 0.25 ºC
  //11 bits 0.125 ºC
  //12 bits 0.0625 ºC

  sensores.setResolution(Ref,12);
  sensores.setResolution(Samp,12);

  Serial.print(TempSensorRef);Serial.print(",");Serial.println(TempSensorSamp);

  BTserial.print(TempSensorRef);
  BTserial.print("/");
  BTserial.print(TempSensorSamp);
  BTserial.print("/");

  delay(500); // Determines sensor data capture rate
}
DS18B20 Sensor Calibration:
It should be noted in this code that the float CorrTempRef and CorrTempSamp constant are corrections that should be applied to the initial measurements of the DS18B20 temperature sensors as a calibration and that it must be determined for each individual sensor being used.
float CorrTempRef = 0.37; //Correction to the temperature initially measured by the Reference sensor
float CorrTempSamp = 0.69; //Correction to the temperature initially measured by the Sample sensor
This correction is estimated by reading the temperature value that the sensor marks when immersed in an ice bath (ice in the presence of liquid water). The deviation of 0°C, which is the value that the ice bath should have, is the one used as a temperature sensor correction.
In this case the measured correction for the Reference and Sample DS18B20 temperature sensors was 0.37°C and 0.69°C respectively and the data were read directly from the designed PhyPhox app (see Step 3) value then used to define the correction in the Arduino code.
DT18B20 Addresses:
The DS18B20 temperature sensors work with OneWire technology which means that several sensors can be connected to the same digital port since each sensor has a factory code (e.g. 0x28 0x8A 0xB1 0x40 0x04 0x00 0x00 0xC7) that allows the Arduino to recognize the reading that each sensor makes independently.
This is very advantageous because it saves digital ports, especially when the project requires multiple sensors.
In our case, as seen from the Arduino circuit diagram, the two DS18B20 temperature sensors are connected to a single digital port (pin 4) which is why it is necessary to find out the particular code for each one.
To find out the address of each sensor you must assemble a circuit to read this code (DS18B20_Address.fzz), load the code DS18B20.ino and test individually each sensor.
// DS1820_Address
// IDE 1.8.5
// Adapted and modified by Alberto Villalobos (IDE 1.8.5)
// References:
// http://cetroniconline.blogspot.com/2014/07/tutorial-arduino-iv-sensor-de.html?m=1

#include
#include

#define ONE_WIRE_BUS 4
OneWire oneWire(ONE_WIRE_BUS);
DallasTemperature sensores(&oneWire);
DeviceAddress Sensor;

void setup(void)
{
  Serial.begin(9600);
  Serial.println("Address Sensor DS18B20:");
  sensores.begin();

  if (!sensores.getAddress(Sensor, 0))

  //If it is not possible to determine the address gives us an error message
    Serial.println("Unable to find sensor address.");
}

//Create the show Address function
void Mostrar_Direccion(DeviceAddress direccion)
{

  for (uint8_t i = 0; i < 8; i++)
  {

    Serial.print("0x");
     if (direccion[i] < 16) Serial.print("0");
    Serial.print(direccion[i], HEX);//Usamos formato Hexadecimal
  }
}

void loop(void)
{
  Serial.print("Address: ");
  Mostrar_Direccion(Sensor);
  Serial.println();
  delay(5000);
}
The code or address obtained must then be separated with commas every four characters. For the two DS18B20 sensors used in this Instructable the directions determined were as follows:
Reference = 0x28,0xFF,0x68,0xDD,0x64,0x15,0x02,0x6F
Sample = 0x28,0xFF,0x2E,0x90,0x64,0x15,0x02,0x67
PhyPhox Parameters and Installation
)


PhyPhox is an application that allows design your own Experiments using cell phone sensors, external sensors (connected via bluetooth) or both, through an online editor (Editor-Test) in which you can define relationships between the captured data, graph them and save the results.
This is the case of this Instructable in which an PhyPhox app (DTA Arduino.phyphox) was designed to read the temperature values measured by the DS18B20 sensors, one in the Reference substance and another in the Sample under analysis.
With the data measured by the sensors, the analysis of the information is performed by the PhyPhox app installed on the cell phone which makes the device designed independent of a desktop or laptop computer.
In this way, the measured data are plotted with respect to time which allows to visualize the behavior of the temperature of both Reference and Sample over time.
The result of the subtraction of the Sample temperature minus the Reference as well as the value of this difference vs the sample temperature is also plotted.
This last graph, called a thermogram, will allow us to visualize the state changes that occur in the sample both when heating it and when letting it cool, which is the purpose of this Instructable.
The specific parameters that make up the experiment designed in this Instructable (DTA Arduino.phyphox) are shown in the video attached to this Step as well as the procedure necessary for loading experiment on the cell phone.
Details on how to design an experiment using online editor for PhyPhox can be found in the Experiment Editor PhyPhox website. While the process of designing the Experiment is quite intuitive I would like to place special emphasis on some points which, in my experience, were crucial to making communication between the Arduino and the cell phone using PhyPhox.
The above points are related to the Input tab of the Editor-Test and have to do with Bluetooth device parameters called "Device Name" and "characteristic". To find out these parameters Arduino microprocessor connections listed in Step 2 must be made and the armed equipment connected to the portable battery.
Under these conditions the Bluetooth device will start issuing information, including the parameters we want to find out. There are many mobile phone applications that allow us to access this information, in our case one was used for Android called BLE Analyser (free with advertisements) that allowed us to recognize the Name of our device as well as the Custom Characteristic that is the one we specifically need (see explanatory image in this Step).
There is another parameter that we need to know and that is also requested in the Input tab of the Editor-Test, is the so-called "separator" and that relates to the character used by Bluetooth to separate the data that is transmitted. This character is defined in the programming of the Arduino file and in our case is set with the symbol "/" (see explanatory image in this Step).
Pro Tip 1: A simple way to understand how the online editor works is to load Experiments to the Editor-Test from those included in the app.
Pro Tip 2: PhyPhox is designed to use low-energy bluetooth emitters (LBE) so you need to ensure the use of this kind of device.
Measurement Procedure

DTA's professional equipment can normally operate at temperatures ranging from ambient to almost 1100°C, allowing them to study processes of fusion, evaporation, change of crystal structure, chemical reactions, decomposition, among others.
However the objective of this Instructable is to exemplify the use of the technique and not build a professional equipment so since our heating device has a temperature range between the environment and approximately 75 °C (using a 25 W incandescent light bulb) low melting point materials were chosen as analysis samples.
In this way, the heating and cooling behavior of waxy substances such as beeswax, paraffin wax (candle) and cetyl alcohol is studied, using liquid paraffin as a reference substance that in the working temperature range does not undergo any change in state or composition.
Having clarified the above, the sample preparation and measurement procedure is described below:
(Caution: This procedure involves a strong heating that could cause burns, it is recommended to make measurements away from combustible materials and protected from the reach of children.)
- Fill up to approximately half of a test tube with the reference substance (liquid paraffin) and insert the DS18B20 sensor selected as Reference into the tube until its metal surface is completely covered with the liquid.
- Add the solid sample in pieces to about half of another test tube and place it in hot water until the solid melts. insert the DS18B20 sensor selected as a Sample into the tube until its metal surface is completely covered with the melted liquid. Allow the substance to solidify together with the sensor and cool for at least an hour (Caution: danger of burn from contact with hot water or wax, use insulating elements to handle containers containing hot liquids).
- Place the Reference and Sample test tubes in the corresponding holes practiced in the heater element (see video in the introduction).
- Activate the PhyPhox app on your cell phone.
- Load the Arduino DTA app as indicated in Step 3.
- Select DTA Arduino app from the Experiments menu.
- Select the Bluetooth device corresponding to the armed Arduino circuit.
- Turn on the incandescent ligth bulb of the heating element by selecting with the rotary dimmer switch the desired heating intensity (usually the maximum for a heating that reaches the limit of approximately 75°C) (Caution: Once the bulb is turned on this surface will be hot so there will be a danger of burn).
- Press the Play (pulsating button) in the app to start capturing data
- Observe the temperature change graphs in both Reference and Sample, as well as the graph showing the difference between these measurements in the HEATING CURVES tab.
- Observe the graph showing the change in sample temperature relative to the difference (Sample - Reference) on the DTA CURVE tab.
- Turn off the incandescent ligth bulb when it is observed that the heating temperature slows down to almost zero, or at the time that the sample is considered to be completely melted.
- Continue recording temperature changes, this time in the cooling process until it reaches almost room temperature or the storage limit set for the application (4000 data).
- If desired, you can save the temperature curves data by pressing the three buttons in the upper-right corner of the app and selecting Export Data.
- Once the measurement is finished, the sample can be removed from the test tube by melting with hot water and then cleaning the test tube with some cleaning solvent and detergent.
Results and Conclusions


Results:
The curve that plots the temperature of the Sample vs. the temperature difference between Sample and Reference (Sample - Reference) is called a thermogram and it is these thermograms that we will analyze next.
In these thermograms the temperature of the sample (scale of the "x") increases from left to right, starting at room temperature, reaching some point after melting temperature and decreasing again to a value close to the initial ambient temperature.
On the scale of the "y" the temperature difference values (Sample - Reference) increase or decrease around the value of 0°C.
When heating starts the temperature of both the Sample and the Reference begin to increase.
In the ideal case, as long as the sample does not suffer any change of phase, transition or other phenomenon, this temperature increase should occur at the same speed in both Sample and Reference would make the temperature difference (Sample - Reference) equal to zero and therefore the curve should start and stay horizontally.
However, when we look at all the thermograms measured we see that the curve always starts upwards, this is due, in large part, to the fact that the temperature in the heating element is not homogeneous which causes an uneven heating of Sample and Reference.
Notwithstanding the above, this temperature difference remains approximately constant which causes an upward curve of constant slope.
Now, when the sample begins to take some change, mainly its fusion, the rate of increase in Sample temperature slows down in relation to the Reference, this because part of the heat that is being applied to the sample is being used to give the molecules a greater mobility increasingly typical of a liquid than a solid.
This causes a sudden change in the slope of the curve that begins to move towards the negative values of the thermogram, at this time it is said that the sample is undergoing an Endothermic Process.
Cetyl alcohol:
In the case of cetyl alcohol, this endothermic change reaches a minimum at approximately 49.9°C, which coincides quite well with the value reported online of 49.3°C (1). At this point the sample is completely melted so the subsequent heating translates entirely into increased temperature which causes the curve to grow again.
At a point close to 70°C, the incandescent ligth bulb was switched off, starting a few seconds later a cooling process that is reflected in the thermogram as a displacement of the stroke of the curve from right to left with a downward slope until reaching approximately 50.7°C, a value close to the melting point determined in the heating phase , in which the curve is triggered towards positive temperature difference (Sample - Reference) values.
This means that the Sample cools slower than the Reference and this is because the heat that the cetyl alcohol had absorbed when melting is releasing it when solidifying, reaching a maximum at 46.4°C and another a little lower than 41.8°C and then start a continuous cooling to 29.6° C point at which it was stopped measuring. This type of process where heat is released is known as Exothermic Process.
Beeswax:
The thermogram corresponding to beeswax has a behavior very similar to that of cetyl alcohol in which an endothermic process related to the fusion of beeswax is seen that reaches a minimum value of approximately 50.4 °C, an exothermic process that begins in the cooling stage around 61.6 °C with two maximums , at approximately 42.3°C and 36.8°C, the second maximum, unlike cetyl alcohol, being higher than the first.
In this case, while there are general similarities in particular there are important differences, possibly related to the fact that cetyl alcohol is a substance of a more homogeneous composition than beeswax which is a mixture of fatty acid esters with fatty alcohols while cetyl alcohol is a unique substance of a relatively high purity.
Paraffin wax:
In the thermogram corresponding to the paraffin wax (candle) a difference is observed with respect to the two previous cases from the beginning because in the endothermic phase, before even reaching the fusion, which occurs at approximately 59.10°C, a minimum is observed at 46.6°C that according to the literature (2) corresponds to a change of solid-solid phase.
In the cooling phase, an exothermic phase was initiated at approximately 62.6°C, reaching a single maximum at approximately 51.8°C and then initiating a continuous cooling to room temperature.
Conclusions:
The proposed procedure has made it possible to identify endothermic and exothermic processes related to changes in solid-solid phase, solid-liquid phase (fusion) and the temperatures at which these changes begin and end.
It has been possible to graph thermograms of both the heating and freezing process of waxy matter, observing differences significant enough for the proposed procedure to be used to identify the waxes analyzed.
Although the heating element used was very simple, interesting phenomena were observed, which suggests that by improving the design of the heater device (furnace) it will be possible to further increase the capacities of the proposed equipment.
References: