Datalogging With Spark Core + Plotly
by garriaga in Circuits > Microcontrollers
4058 Views, 22 Favorites, 0 Comments
Datalogging With Spark Core + Plotly

The Spark Core makes it really easy to connect your project to the Internet of Things. You can use just about any sensor that works with a regular old Arduino and automagically send it into the cloud. But what do you do after your data vanishes into the Aether? This Instructable will show you how to make it rain (data) from the cloud into a streaming Plotly graph. The setup described here monitors temperature, humidity, light and UV index; however, feel free to substitute any sensors that work with the Spark Core. To bake this specific setup you'll need the following ingredients:
Spark Core (https://store.spark.io/)
AM2302 (wired DHT22)
Temperature + Humidity Sensor (https://www.adafruit.com/products/393)
Light Sensor (https://www.adafruit.com/products/1384)
UV Sensor (https://www.adafruit.com/products/1918)
Free Plotly account (www.plot.ly)
Connect Sensors to Spark Core

For the purposes of this Instructable we'll assume you've successfully captured and registered the Core to your spark.io account by following the instructions that came with it.
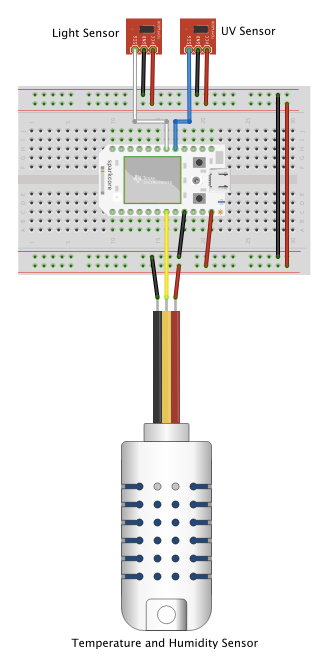
Then, the first thing you have to do is wire up all the sensors so that they can talk to the Spark Core. Each sensor needs connections to +5V, ground, and a digital or analog pin on the Spark Core. Wiring to the same pins shown in the breadboarding diagram (and described below) will prevent you from having to make a lot of edits to the sketch down the road. But feel free to use other pins if necessary.
Light Sensor signal to analog pin A6
UV Sensor signal analog pin A7
Temperature and Humidity Sensor signal to digital pin 6
Generate Plotly Streaming Tokens

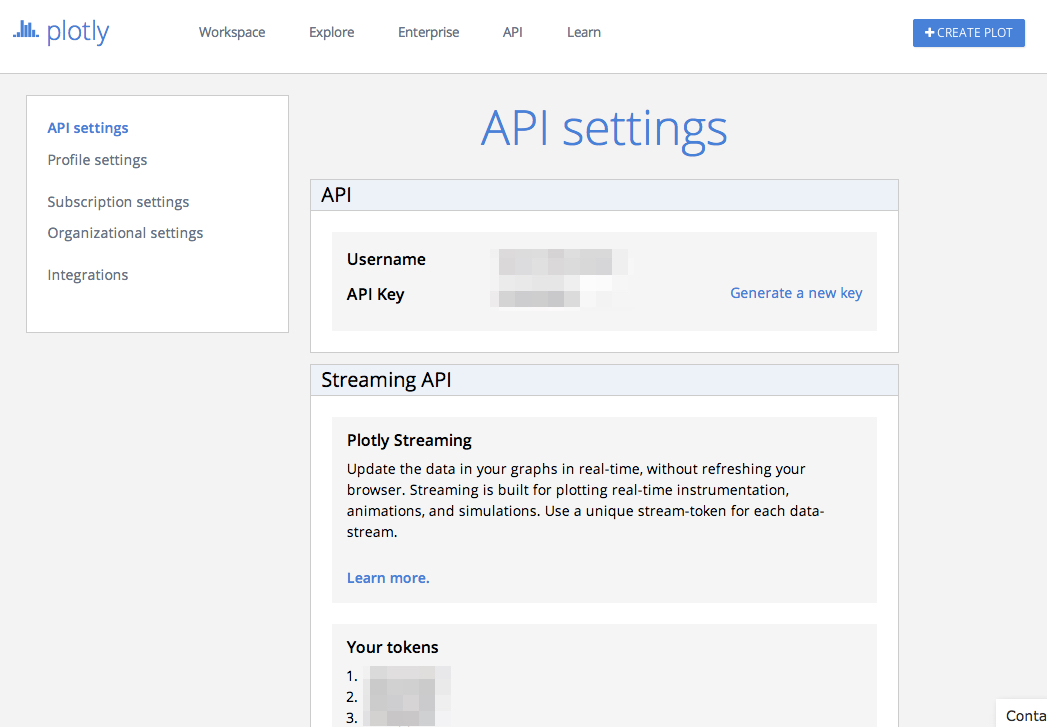
Log in to your Plotly account and head over the the settings. Under API settings, copy your username and API Key. You will need them in the next step. While you're there, go down to the "Streaming API" section and generate four (4) tokens. Copy all four tokens, you will also need those for the next step.
Load Sketch Onto Spark Core
With everything wired up correctly, connect your Spark Core to a 5V power source and wait for it to boot up and the LED to start pulsing cyan. At this point you should be able to log into your spark.io account and copy the attached demo into a new sketch. Remember to include the Adafruit DHT library and Spark-Plotly library in your sketch from the Spark IDE. Plug the username, API Key and streaming tokens into the code where indicated. You will also need to give your graph a name. After all your info is entered, go ahead and flash the new firmware onto your Core.
Downloads
Make It Rain (sensor Data)!

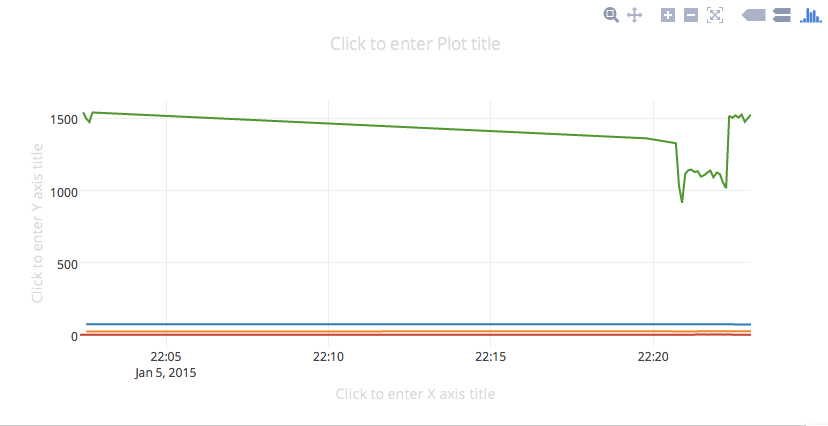
Configured as described, the sketch will be set to stream new data every four (4) seconds, so you should see the graph auto-update at regular intervals (unless the Core loses its connection). Now sit back and watch the data stream in. You don't need to do anything else!