Data Is Yours Toolkit: Fabrication Instructions
by ACME Lab in Workshop > Science
1369 Views, 10 Favorites, 0 Comments
Data Is Yours Toolkit: Fabrication Instructions
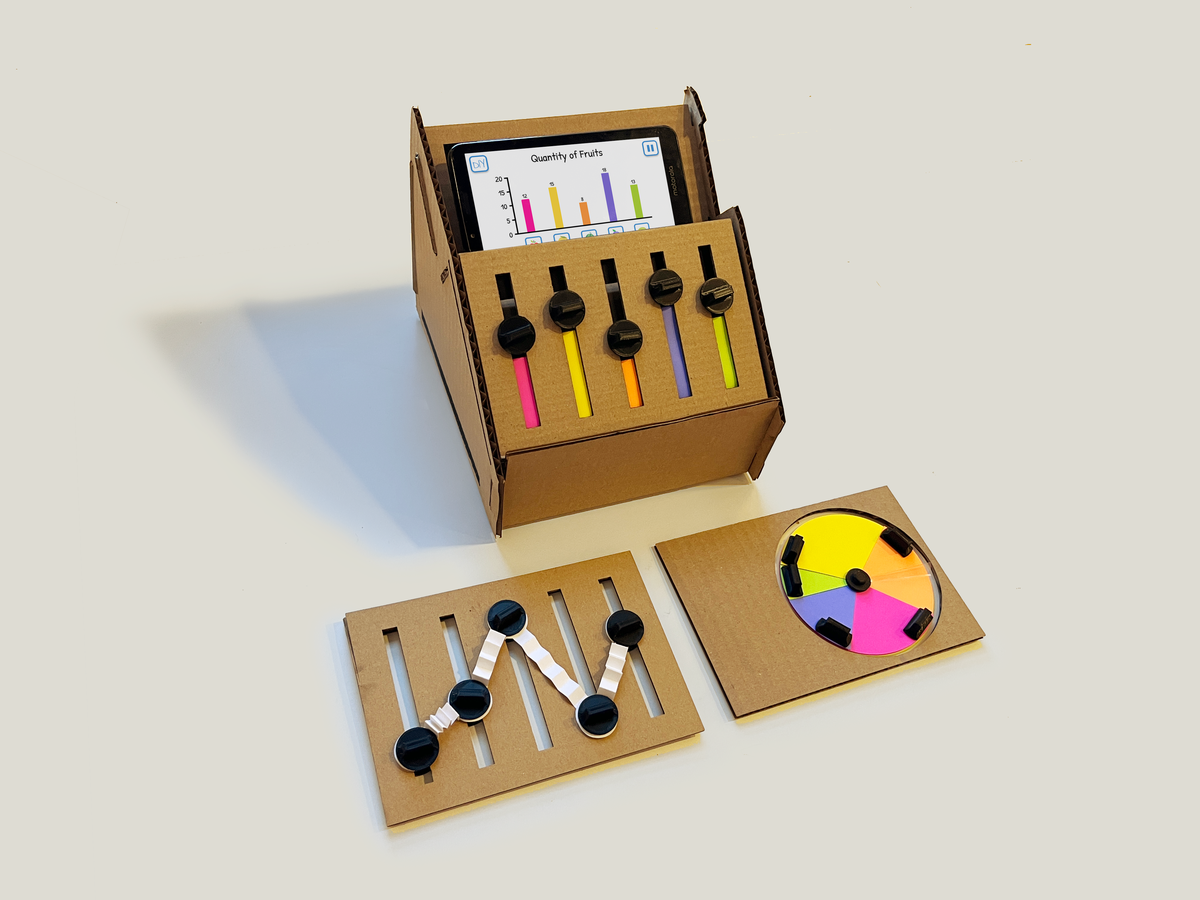
The Data is Yours Toolkit is a design probe intended to study how constructionist practices can engage children to create visualizations in a playful, creative manner. It is a toolkit made out of everyday materials (i.e., paper, cardboard) and fiducial markers to help children create physicalizations, and in turn use them to author visualizations using a mobile device. This instructable is part of a research paper that will appear in IEEE VIS 2022.
This is the first part of two instructables, and discusses the preparation of all the parts required to assemble the toolkit. Broadly speaking, we have two main sets of parts:
- The Toolkit Box
- The Chart Panels
Each of these parts has components made of different materials, including cardboard, paper, acrylic, and plastic. We first outline the materials and equipment required to begin fabricating these components, followed by an overview of the fabrication process.
Supplies
Materials

Tools
Joining: Double-sided tape, glue sticks
Hand cutting: Scissors, Craft knives, Acrylic Plastic Cutter
Machine Cutting (alternative to hand cutting ): Vinyl Cutter, Laser Cutter
Additional recommended tools and materials: 3D printer, duct tape, sand paper
Toolkit Box Components: Box Structure
Box Base and Mobile Panel: [cardboard] Box Base.pdf
Box Rear Panel: [cardboard] Box Rear Panel.pdf

The box structure consists of one large foldable piece, and two additional pieces for mounting the phone and rear mirror. The cut cardboard should look like the one in the photo once it is completed.
For hand cutting:
- Print the pdf files (without scaling) on printing paper.
- Use the glue stick to paste the printed papers onto the cardboard.
- Use scissors or craft knives, cut along the black lines, all black lines need to be completely cut through.
- Press along the blue lines, either using the back of the blade or the handle.
For machine cutting:
- Import the pdf files into the graphic application associated with the laser cutter.
- Set black for cutting and blue for engraving.
With the Epilog Laser Fusion M2, we used the settings of
Cut - Speed: 60, Power: 40, and Frequency: 100
Etch/Fold - Speed: 80, Power: 20, and Frequency: 100
Note: If you don't use the cardboard size we recommend, you can also split the drawing into smaller sections for cutting and then tape them together. In such cases, we recommend separating the cardboard with the blue lines to get the best structural support.
Toolkit Box Components: Acrylic Panel and Mirror Panels
Acrylic Panel Template: Box Acrylic Panel.pdf
Mirror Panel Template: Box Mirrors.pdf

For hand cutting:
- Print the pdf files on printing paper.
- Use scissors to cut along the black line.
- Stick the clipped paper piece to the back of the acrylic using tape or glue stick.
- Use the acrylic knife to cut along the edge of the paper.
- Remove the paper.
For machine cutting:
- Import the pdf files into the graphic application associated with the laser cutter.
- Set black for cutting.
With the Epilog Laser Fusion M2, we used the settings of
Cut - Speed: 10, Power: 100, and Frequency: 100
Note: For hand-cutting of the transparent acrylic, you don't have to cut out rounded corners, just go ahead and cut them into right angles
Visualization Panel Components: Panel Frames
Design Files:
[cardboard] Bar and Line Chart Top.pdf
[cardboard] Bar and Line Chart Base.pdf

The chart panels frames are made out of cardboard. For the bar and line chart, the same panel design is used, consisting of two layers of cardboard stuck to each other. For the pie chart, the panel consists of one layer of cardboard, with an underlying layer of plastic with a slit as a recommended option.
For hand cutting:
- Print the pdf file (select no scaling) on printing paper.
- Use the glue stick to paste the printed papers onto the cardboard.
- Use scissors or a craft knife to cut along the black lines, all black lines need to be completely cut through.
For machine cutting:
- Import the pdf files into the graphic application associated with the laser cutter.
- Set black for cutting
With the Epilog Laser Fusion M2, we used the settings of
Cut - Speed: 60, Power: 40, and Frequency: 100
Note: When cutting by hand, if the circle cannot be cut exactly, it can also be cut into a larger polygon, as long as the part that is cut off is larger than the original circle. When cutting by machine, if you use the cardboard sizes we recommend, you will be able to cut these cardboards directly using the remaining parts of the large cardboard. Once cut, the two cardboard pieces for the bar and line chart panel should be placed over each other, and joined using double-sided tape or glue stick.
Visualization Panel Components: Pie Chart Plastic Base (Recommended)
Pie Chart Plastic Piece: [plastic sheet] Pie Chart Transparent Base.pdf

This is a recommended part. Not using this part does not affect the overall functionality, but using it makes it easier to pick up and hold the Pie Chart Panel. The plastic base of the pie chart panel can be cut out of one sheet from a transparent file-folder.
For hand cutting:
- Print the pdf file (without scaling) on printing paper
- Place the printed paper under the transparent file folder, you can use glue sticks or stickers to secure it, or you can hold it directly by hand.
- Use scissors or a craft knife to cut along the black outline.
- Use a craft knife to make a cross in the middle of the circle, or cut along the edge of the circle.
For machine cutting:
- Import the pdf files as a vector into the vinyl cutter application.
- Set the blue lines into dotted lines, keep the black lines as is.
- With the Silhouette Cameo 4 and this file folder (amazon link), we used the simple cutting mode, the automatic blade, and the system default settings for shrink plastic.
Note: For hand cutting, you do not have to cut out the straight lines next to the circle. For machine cutting, you can also use the line cutting mode to increase the cutting speed of the blue line.
Once cut, the plastic panel needs to be fixed to the bottom of the pie chart cardboard panel.
Visualization Panel Components: Control Tokens
The control tokens can be fabricated in two different ways, you can make them using 3D printing, or with hand-cut cardboard. Here are the numbers of each part needed:

3D Printed Control Tokens
STL Files:
Bar and Line Chart Slider Base.STL, Pie Chart Center Top.STL, Bar and Line chart Slider Top.STL, Pie Chart Slider.STL, Pie Chart Center Base.STL

- Import the STL files into the slicing application associated with your 3D printer
- Export the corresponding files and 3D print it
- Test your printed parts to make sure they are compatible. The bar/line chart slider base and slider top should be able to be snap pressed together, as well as the pie chart center top and base.
- Sand your printed parts. Use sandpaper to sand them and make sure their surface is smooth. If in step 3 your printed parts are too large to fit, you can also use sandpaper to sand them smaller; if they are too small and come off easily, you can use some duct tape on the surface.
With the Monoprice MP10 Mini 3D Printer, HATCHBOX 1.75mm Black PLA 3D Printer Filament, and Ultimaker Cura, we used the system default configuration file and set the print configuration to Fine.
Note: The adjustment of printing parameters will not have much effect on the final print result, but you should adjust those parameters based on the actual condition of your 3D printer, the time and material you need, etc.
Cardboard Control Tokens

For bar & line chart: Take the cardboard strips cut from the bar & line chart base in the Panel Frames step, use scissors to cut each strip evenly into 2 pieces, then glue them together with double-sided tape or glue sticks.
For pie chart: Take the cardboard strips cut from the bar & line chart top in the Panel Frames step, fold it three times then glue together with double-sided tape or glue sticks. For its center column section, you can find a similarly sized cylinder (like a pen cap) or use printer paper to roll a paper roll.
The following videos explain the cardboard construction and assembly process in detail:
- Bar & Line Chart Handles
- Creating the Cardboard Handles Part 1.1.mov
- Creating the Cardboard Handles Part 1.2.mov
- Creating the Cardboard Handles Part 1.3.mov
- Pie Chart Handles
- Creating the Cardboard Handles Part 2.mov
- Bar Chart Assembly
- Cardboard Handle Bar Chart.mov
- Cardboard Handle Bar Chart Markers.mov
- Line Chart Assembly
- Cardboard Handle Line Chart.mov
- Cardboard Handle Line Chart Markers.mov
- Pie Chart Assembly
- Cardboard Handle Pie Chart.mov
Visualization Panel Components: Paper Components
Here are the numbers of each part needed:

Bar Chart
Design File: [paper] Bar Chart Paper Strips.pdf

For hand cutting:
- Print the pdf on colored cardstock paper (without scaling).
- Use scissors or a craft knife to cut along the outline.
- Use a craft knife to make a cross in the middle of the circles, or cut along the edge of the circles.
For machine cutting:
- Import the pdf file as a vector into the vinyl cutter application.
- Keep all lines as is.
- Turn on the registration marks, then print from the application directly.
- Cut along the black lines with markers registered
With the Silhouette Cameo 4 and 176 gsm (65 lb cover) cardstock paper, we used the simple cutting mode, the automatic blade, and the system default settings for cardstock paper.
Note: When using this pattern, you will make 5 strips of the same color at a time. Note, however, that you will need 5 or more strips of different colors. If you want to make more groups, you can put multiple copies of this pattern on one page.
Line Chart
Design File: [cardstock] Line Chart Paper Strips.pdf

For hand cutting:
- Print the pdf on white cardstock paper (without scaling).
- Use scissors or a craft knife to cut along the black lines.
- Press along the blue lines using the back of the blade.
For machine cutting:
- Import the pdf file as a vector into the vinyl cutter application.
- Set the blue lines into dotted lines, keep the black lines as is.
- With the Silhouette Cameo 4 and 176 gsm (65 lb cover) cardstock paper, we used the line cutting mode, the automatic blade For black lines, we used the system default settings for cardstock paper, and for blue lines, we used the maxImum speed and depth as 1.
Note: If you want to make more, you can put multiple copies of this pattern on one page.
Pie Chart
Design File: [cardstock] Pie Chart Paper Disks.pdf

For hand cutting:
- Print the pdf on colored cardstock paper (without scaling).
- Use scissors or a craft knife to cut along the black lines.
For machine cutting:
- Import the pdf file as a vector into the vinyl cutter application.
- Keep all lines as is.
- With the Silhouette Cameo 4 and 176 gsm (65 lb cover) cardstock paper, we used the simple cutting mode, the automatic blade, and the system default settings for cardstock paper.
Note: If you want to make more, you can put multiple copies of this pattern on one page.
Visualization Panel Components: Markers
Markers
Design Files: [paper] Markers.pdf

For hand cutting:
- Print the pdf file (without scaling) on printing paper.
- Cut along the outlines
For machine cutting:
- Import the pdf file as a vector into the vinyl cutter application.
- Keep all lines as is.
- Turn on the registration marks, then print from the application directly.
- Cut along the outlines with markers registered
With the Silhouette Cameo 4 and 90 gsm printing paper, we used the simple cutting mode, the automatic blade, and the system default settings for copy paper.
Note: You can also use sticker paper to print these markers, which can relieve some of the work during assembly. In such a case, if you use machine cutting, you need to adjust the setting to cut as stickers.
Marker Locator
Design File: Marker Locator.pdf

To aid in the placement of the reference markers, you can print the following Marker Guides and use it to locate the marker positions. You can also open it on your computer directly and position the part overlay on the screen. In such a case you may need to adjust the scaling of the file as it is displayed on the screen.
Visualization Panel Components: Paper Templates
You will need 2 bar & line chart paper templates, and 1 pie chart paper template.
Design Files:
[paper] Bar and Line Chart Paper Template.pdf
[paper] Pie Chart Paper Template.pdf

For hand cutting:
- Print the pdf file (without scaling) on printing paper.
- Cut along the solid black and red lines
For machine cutting:
- Import the pdf file as a vector into the vinyl cutter application.
- Set the blue lines into dashed lines, keep the black and red lines as is.
- Turn on the registration marks, then print from the application directly.
- Cut along the lines with markers registered
- With the Silhouette Cameo 4 and 90 gsm printing paper, we used the simple cutting mode, the automatic blade, and the system default settings for copy paper.
Note: You can also use cardstock for this, which will give you a better texture and a higher cost. In such cases, you will need to adjust the machine cutting for the cardstock.
Wrapping Up
Once you have all of these components ready, you can head to the Assembly Instructions document to finish making your version of the Data is Yours Toolkit.