DSO Nano V2 Guide
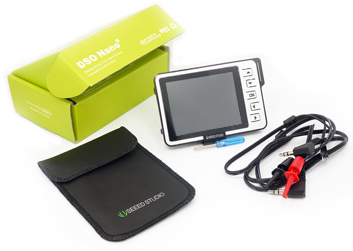
So just a little while ago i received my DSO Nano V2 from an Instructables Contest! Decided what better way to thank instructables than to put together a little user guide for it. The following is just a simple explanation and some previews of how to use it.
Not all information is my own. Some information and images are property of Seed Studio or Merriam-Webster and Wikipedia.
Not all information is my own. Some information and images are property of Seed Studio or Merriam-Webster and Wikipedia.
Introduction
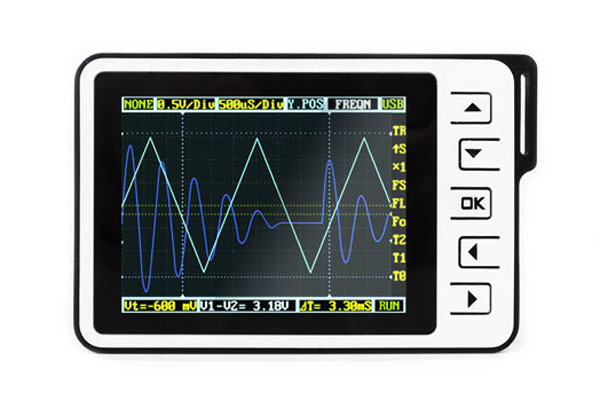
The DSO Nano v2 is a handheld digital oscilloscope for easy circuit analysis. This electronic test equipment allows for observation of constantly changing signal voltages on an easy to read display. The DSO Nano allows for basic waveform viewing on a 320 x 240 color LCD screen and image storage on a micro SD card. The DSO Nano also includes a simple function generator for applying multiple different signals to any circuit. The ease of use and small size makes the DSO Nano the perfect tool for use in the field, on a small hobby project, or for simple quick measurements.
Terms to Be Familiar With

Oscilloscope: A device for viewing oscillations, as of electrical voltage or current, by a display.
Probe: a pointed metal tip for making electrical contact with a circuit element being checked.
Waveform: a usually graphic representation of the shape of a wave that indicates its characteristics.
Trigger: to initiate, actuate, or set off by a trigger.
Voltage: electric potential or potential difference expressed in volts.
Div: abbreviation for division. Used to define scale of screen, as in volts per division.
Frequency: the number of repetitions of a periodic process in a unit of time.
Cycle Time: The amount of time in seconds elapsed between start and end.
Duty Cycle: The time occupied by signal step expressed as a percentage of available time
Peak to Peak Voltage (Vpp): The difference between the max positive voltage and max negative voltage
RMS Voltage (Vrms): Root Mean Square Voltage, is a statistical measure of the magnitude of a varying quantity
Average Voltage: Average voltage value during a period of time
DC Voltage: Direct Current Voltage, is a steady current source that does not oscillate like that of an AC voltage source. DC voltage is usually produced by sources such as batteries.
Note: Definitions provided through Merriam-Webster and Wikipedia definitions.
Components and Buttons
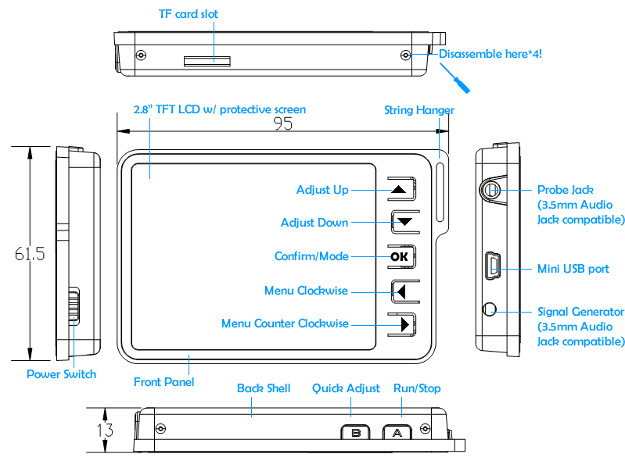
Power Switch: Simple on off switch. Up position on, down position off.
LCD Screen: 2.8” TFT LCD screen. Displays current settings and signals.
Adjust Up: Adjust selection up.
Adjust Down: Adjust selection down.
Confirm/Mode: Used to adjust signal display options and confirm selection.
Menu Clockwise: Adjust selection left. Mainly used to select menu option.
Menu Counter Clockwise: Adjust selection right. Mainly used to select menu option.
Quick Adjust: Quickly automatically adjusts to best-fit view for current signal.
Run/Stop: Run/Pause signal reading for viewing specific components or saving an image.
Probe Jack: Input for signal viewing.
Mini USB Port: USB port for viewing stored images and charging device.
Signal Generator: Output for internal signal generator.
TF Card Slot: SD Card slow for mini SD card. Used to store image captures.
User Interface
MENU
FUNCTIONS
STATUS BAR
WAVEFORM & MARKERS
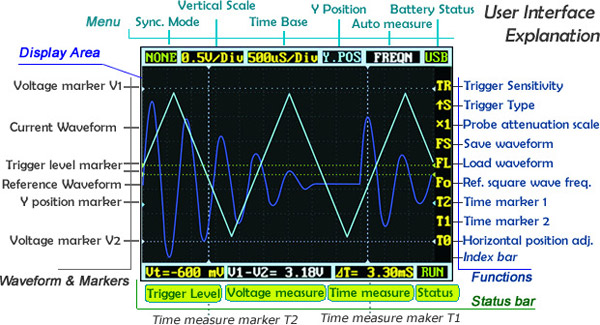
Sync. Mode: Adjust to change current triggering mode. (AUTO, NORM, SING, SCAN, NONE, FIT)
Vertical Scale: Adjust to change voltage/division scale on screen (voltage height on screen). Each division is one grid unit of the screen.
Time Base: Adjust to change horizontal scale (time width on screen) Each division is one grid unit of the screen.
Y Position: Adjust Y Position marker to move the waveform up and down.
Auto Measure: Displays simple measurements of signal input. (frequency, cycle time, duty cycle, peak to peak voltage, RMS voltage, average voltage, DC voltage)
Battery Status: Displays current status of battery, or USB if currently charging using USB port.
FUNCTIONS
Trigger Sensitivity: Shows trigger sensitivity level. This is the level at which the trigger will be activated
Trigger Type: Displays current triggering type. Default is on the signals rising edge (↑S)
Probe Attenuation Scale: This is a probe multiplier. Used for amplifying signals before being read on the display. You can select either x1 or x10.
Save Waveform: Select to store waveform to the inserted SD card.
Load Waveform: Select to load waveform from the inserted SD card.
Ref. Square Wave Frequency: Use to adjust the frequency of the square wave using in the frequency generator.
Time Marker 1: Marker 1 used to fine tune precise measurements. Place on one side of signal (opposite of Time Marker 2) to get more accurate readings
Time Marker 2: Marker 2 used to fine tune precise measurements. Place on one side of signal (opposite of Time Marker 1) to get more accurate readings
Horizontal Position Adj.: Use to adjust signal position left or right. Useful when a specific part of the signal is needed for better viewing.
STATUS BAR
Trigger Level: Use to adjust voltage level at which trigger is activated
Voltage Measure: Displays the voltage difference between Voltage Marker 1 and Voltage Marker 2. Time Measure: Displays time at Time Marker 1
Status: Displays current status (RUN, HOLD)
Voltage Measure: Displays the voltage difference between Voltage Marker 1 and Voltage Marker 2. Time Measure: Displays time at Time Marker 1
Status: Displays current status (RUN, HOLD)
WAVEFORM & MARKERS
Voltage Marker V1: Reference level 1 for Voltage Measure. Select V1 in Voltage Measure window to adjust position.
Current Waveform: Beginning point of current input.
Trigger Level Marker: Displays voltage level for when trigger will be activated. Select Trigger Level window to adjust marker.
Reference Waveform: Beginning point of reference waveform.
Y Position Marker: The Y Position Marker indicates zero volts for referencing a signal to.
Voltage Marker V2: Reference level 2 for Voltage Measure. Select V2 in Voltage Measure window to adjust position.
Triggering Waveforms
![Marketing-Timing-Trigger [] [small].jpg](/proxy/?url=https://content.instructables.com/FV1/65OG/H8I449NO/FV165OGH8I449NO.jpg&filename=Marketing-Timing-Trigger [] [small].jpg)
Using triggering modes can allow you to view just the initial part of a waveform, one period of a waveform, synchronized of unsynchronized waveforms, etc. In some situations this accessibility can be very convenient. You can adjust the voltage level at which you want the trigger to occur by navigating to the Trigger Level in the Status Bar (Vt) and using the up and down buttons. Save your selection by pressing OK (confirm). The trigger level will appear as a horizontal green dotted line on the main screen. You can prevent noise from accidentally activating a trigger by adjusting the Trigger Sensitivity (TR) or trigger slope. The Default trigger type is on a rising signal (↑S). Through the Sync. Mode (or Trigger Mode) option you can adjust the type of signal displayed. The following options are available for trigger modes:
AUTO – Continuously refreshes display
NORM – Displays synchronized waveforms
SING – Displays triggered waveform and holds
SCAN – Continuously sweeps waveform from left to right
NONE – Refreshes unsynchronized waveform, ignores trigger
FIT – Automatically adjusts vertical and horizontal scale to fit waveform
NORM – Displays synchronized waveforms
SING – Displays triggered waveform and holds
SCAN – Continuously sweeps waveform from left to right
NONE – Refreshes unsynchronized waveform, ignores trigger
FIT – Automatically adjusts vertical and horizontal scale to fit waveform
USING IT!
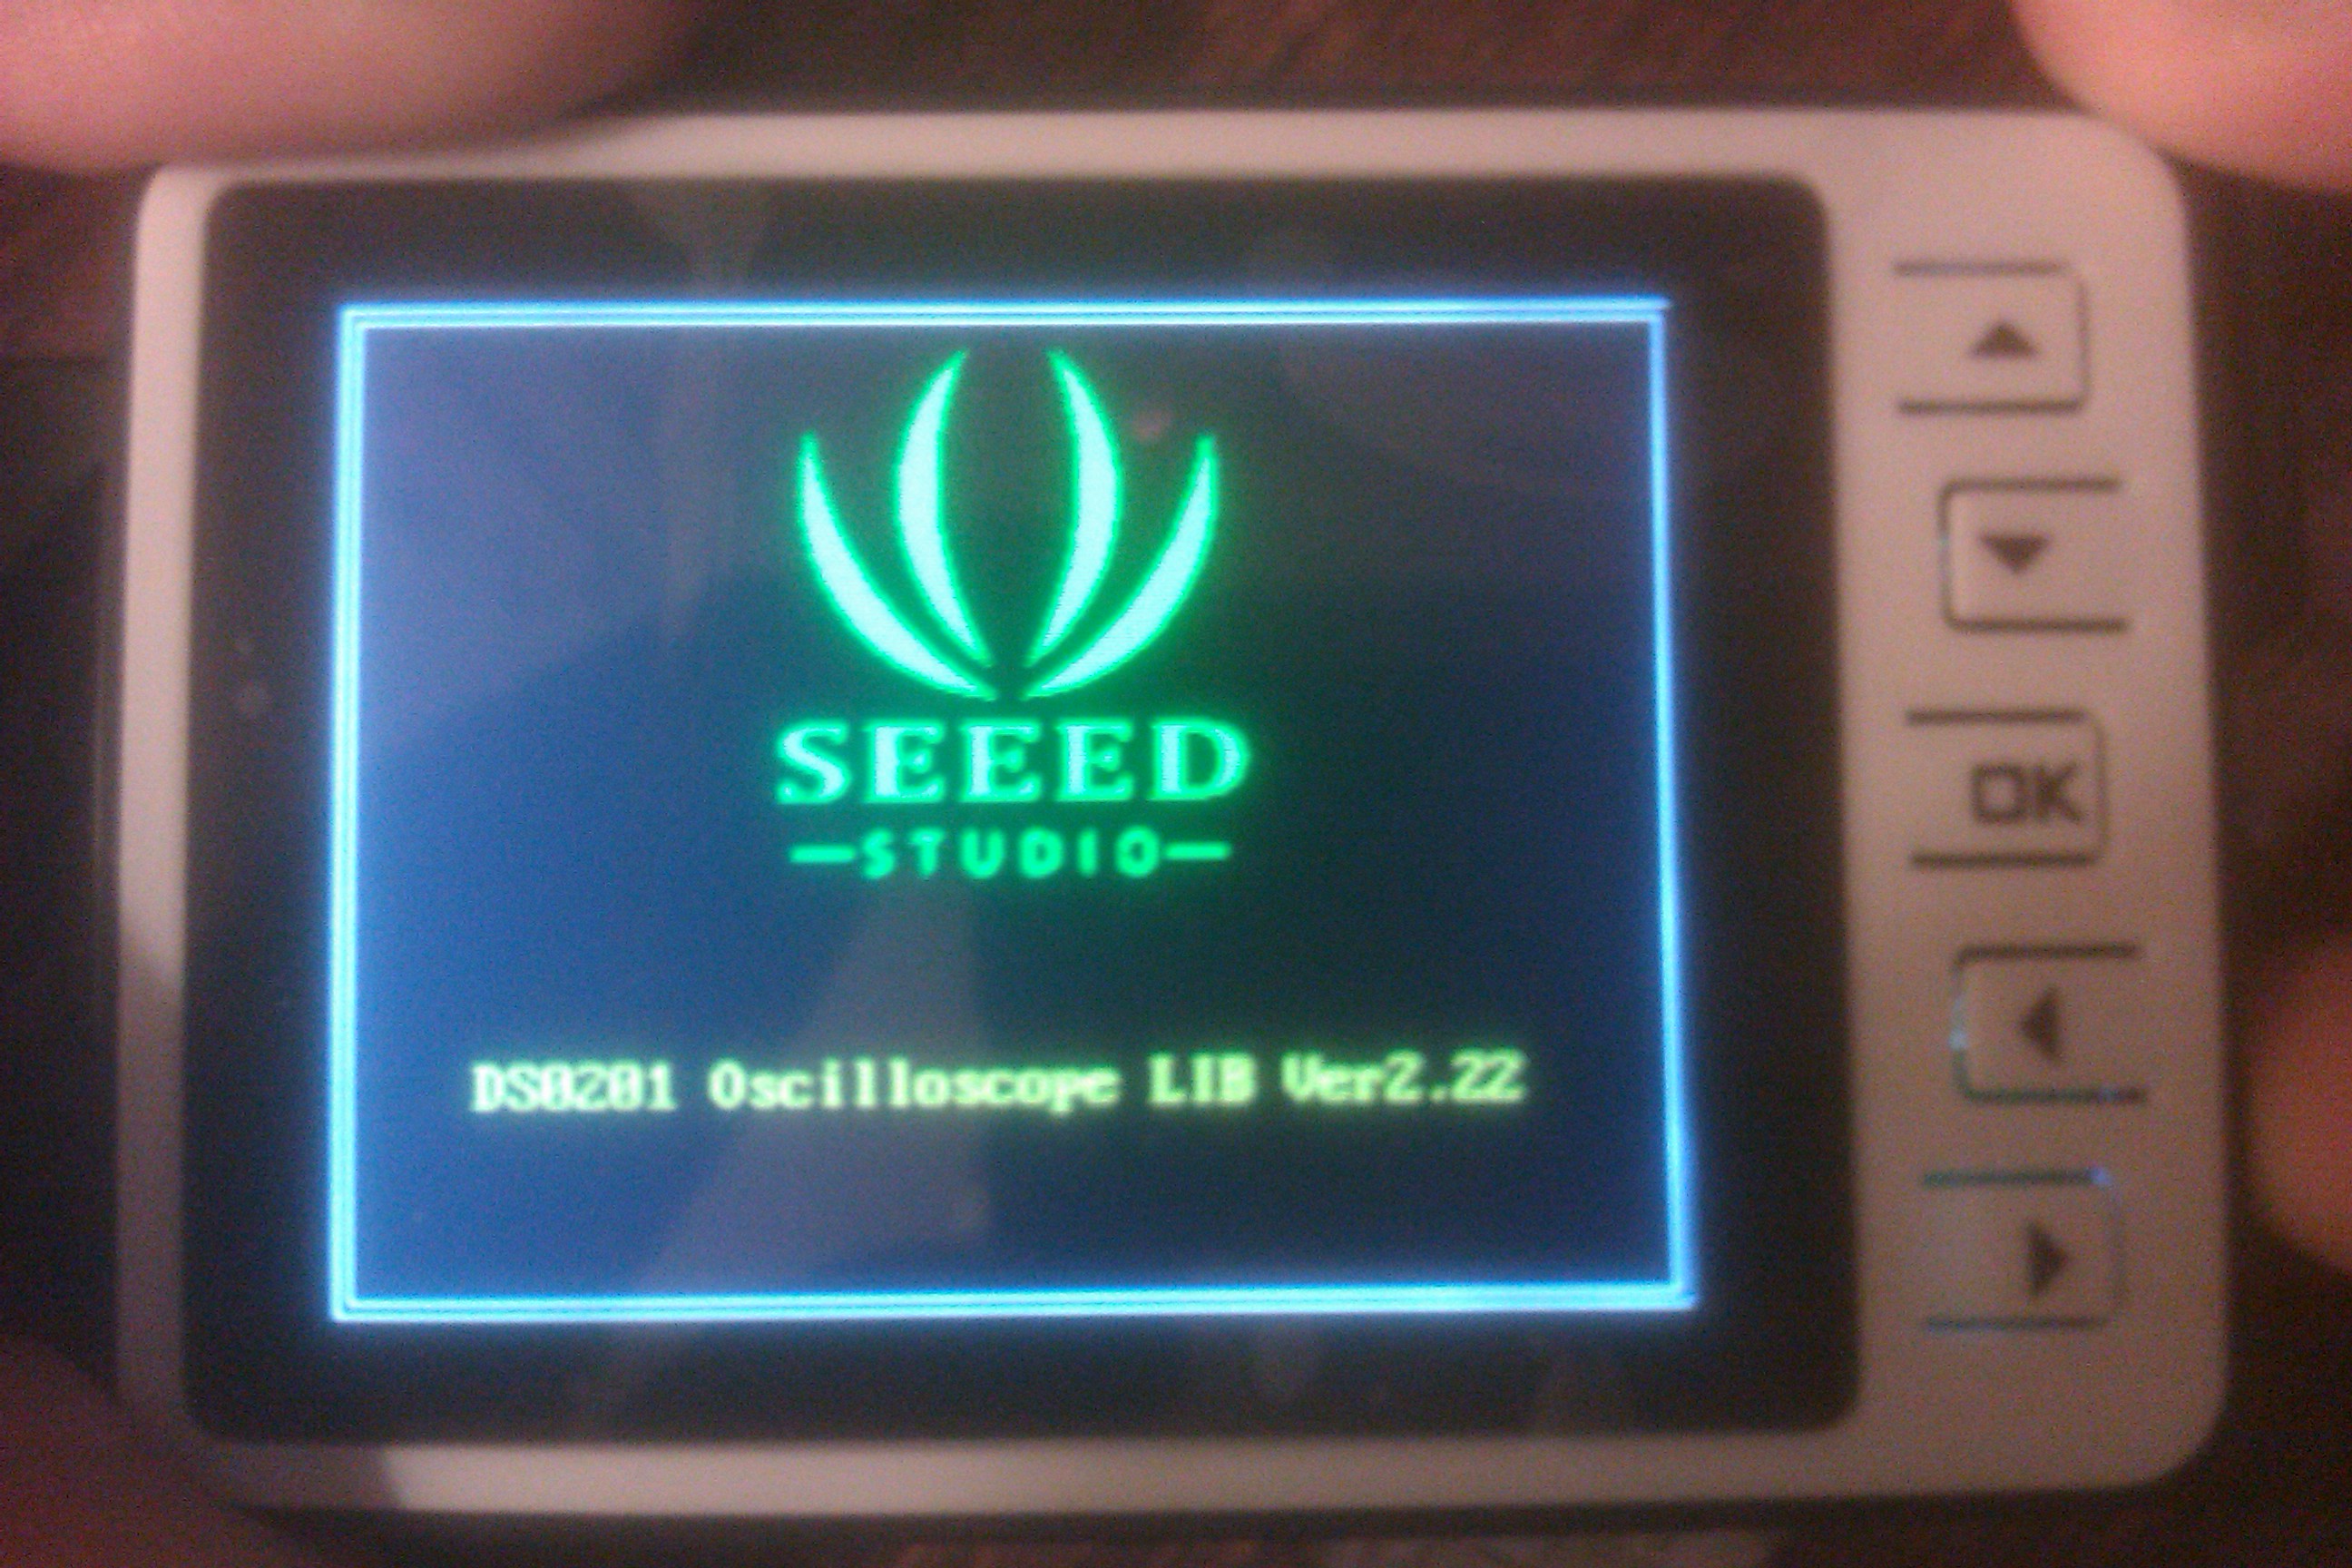
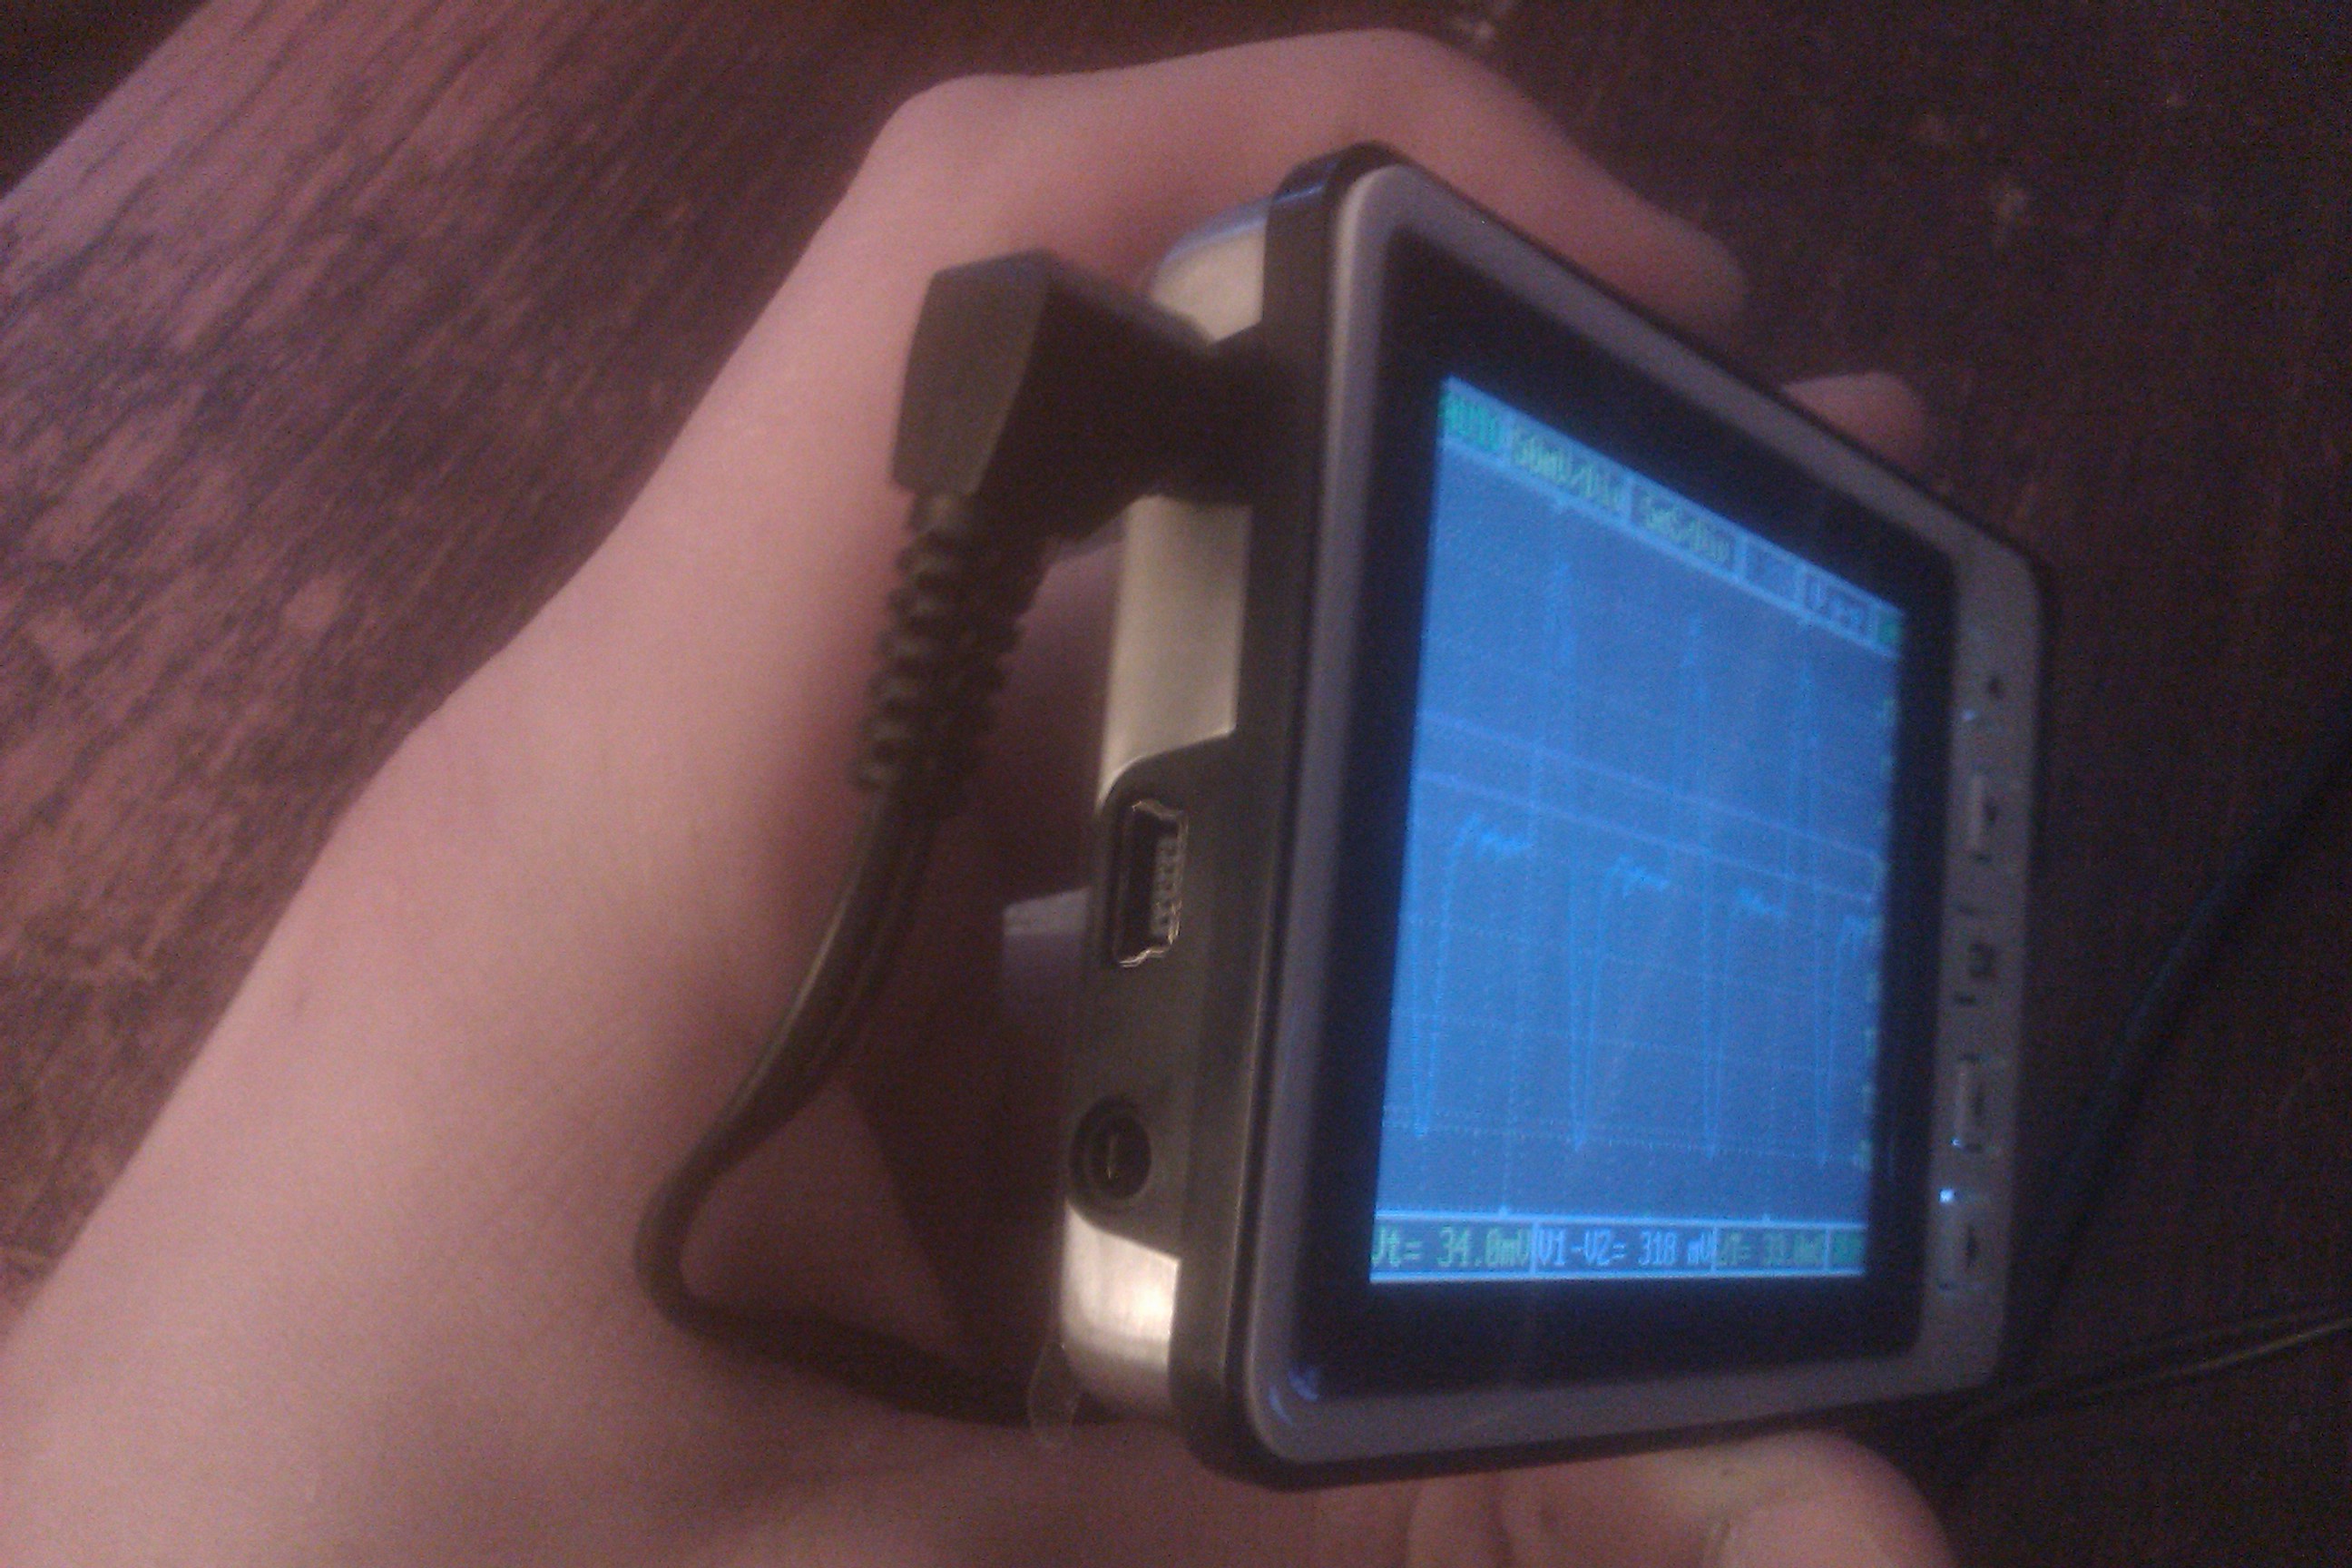
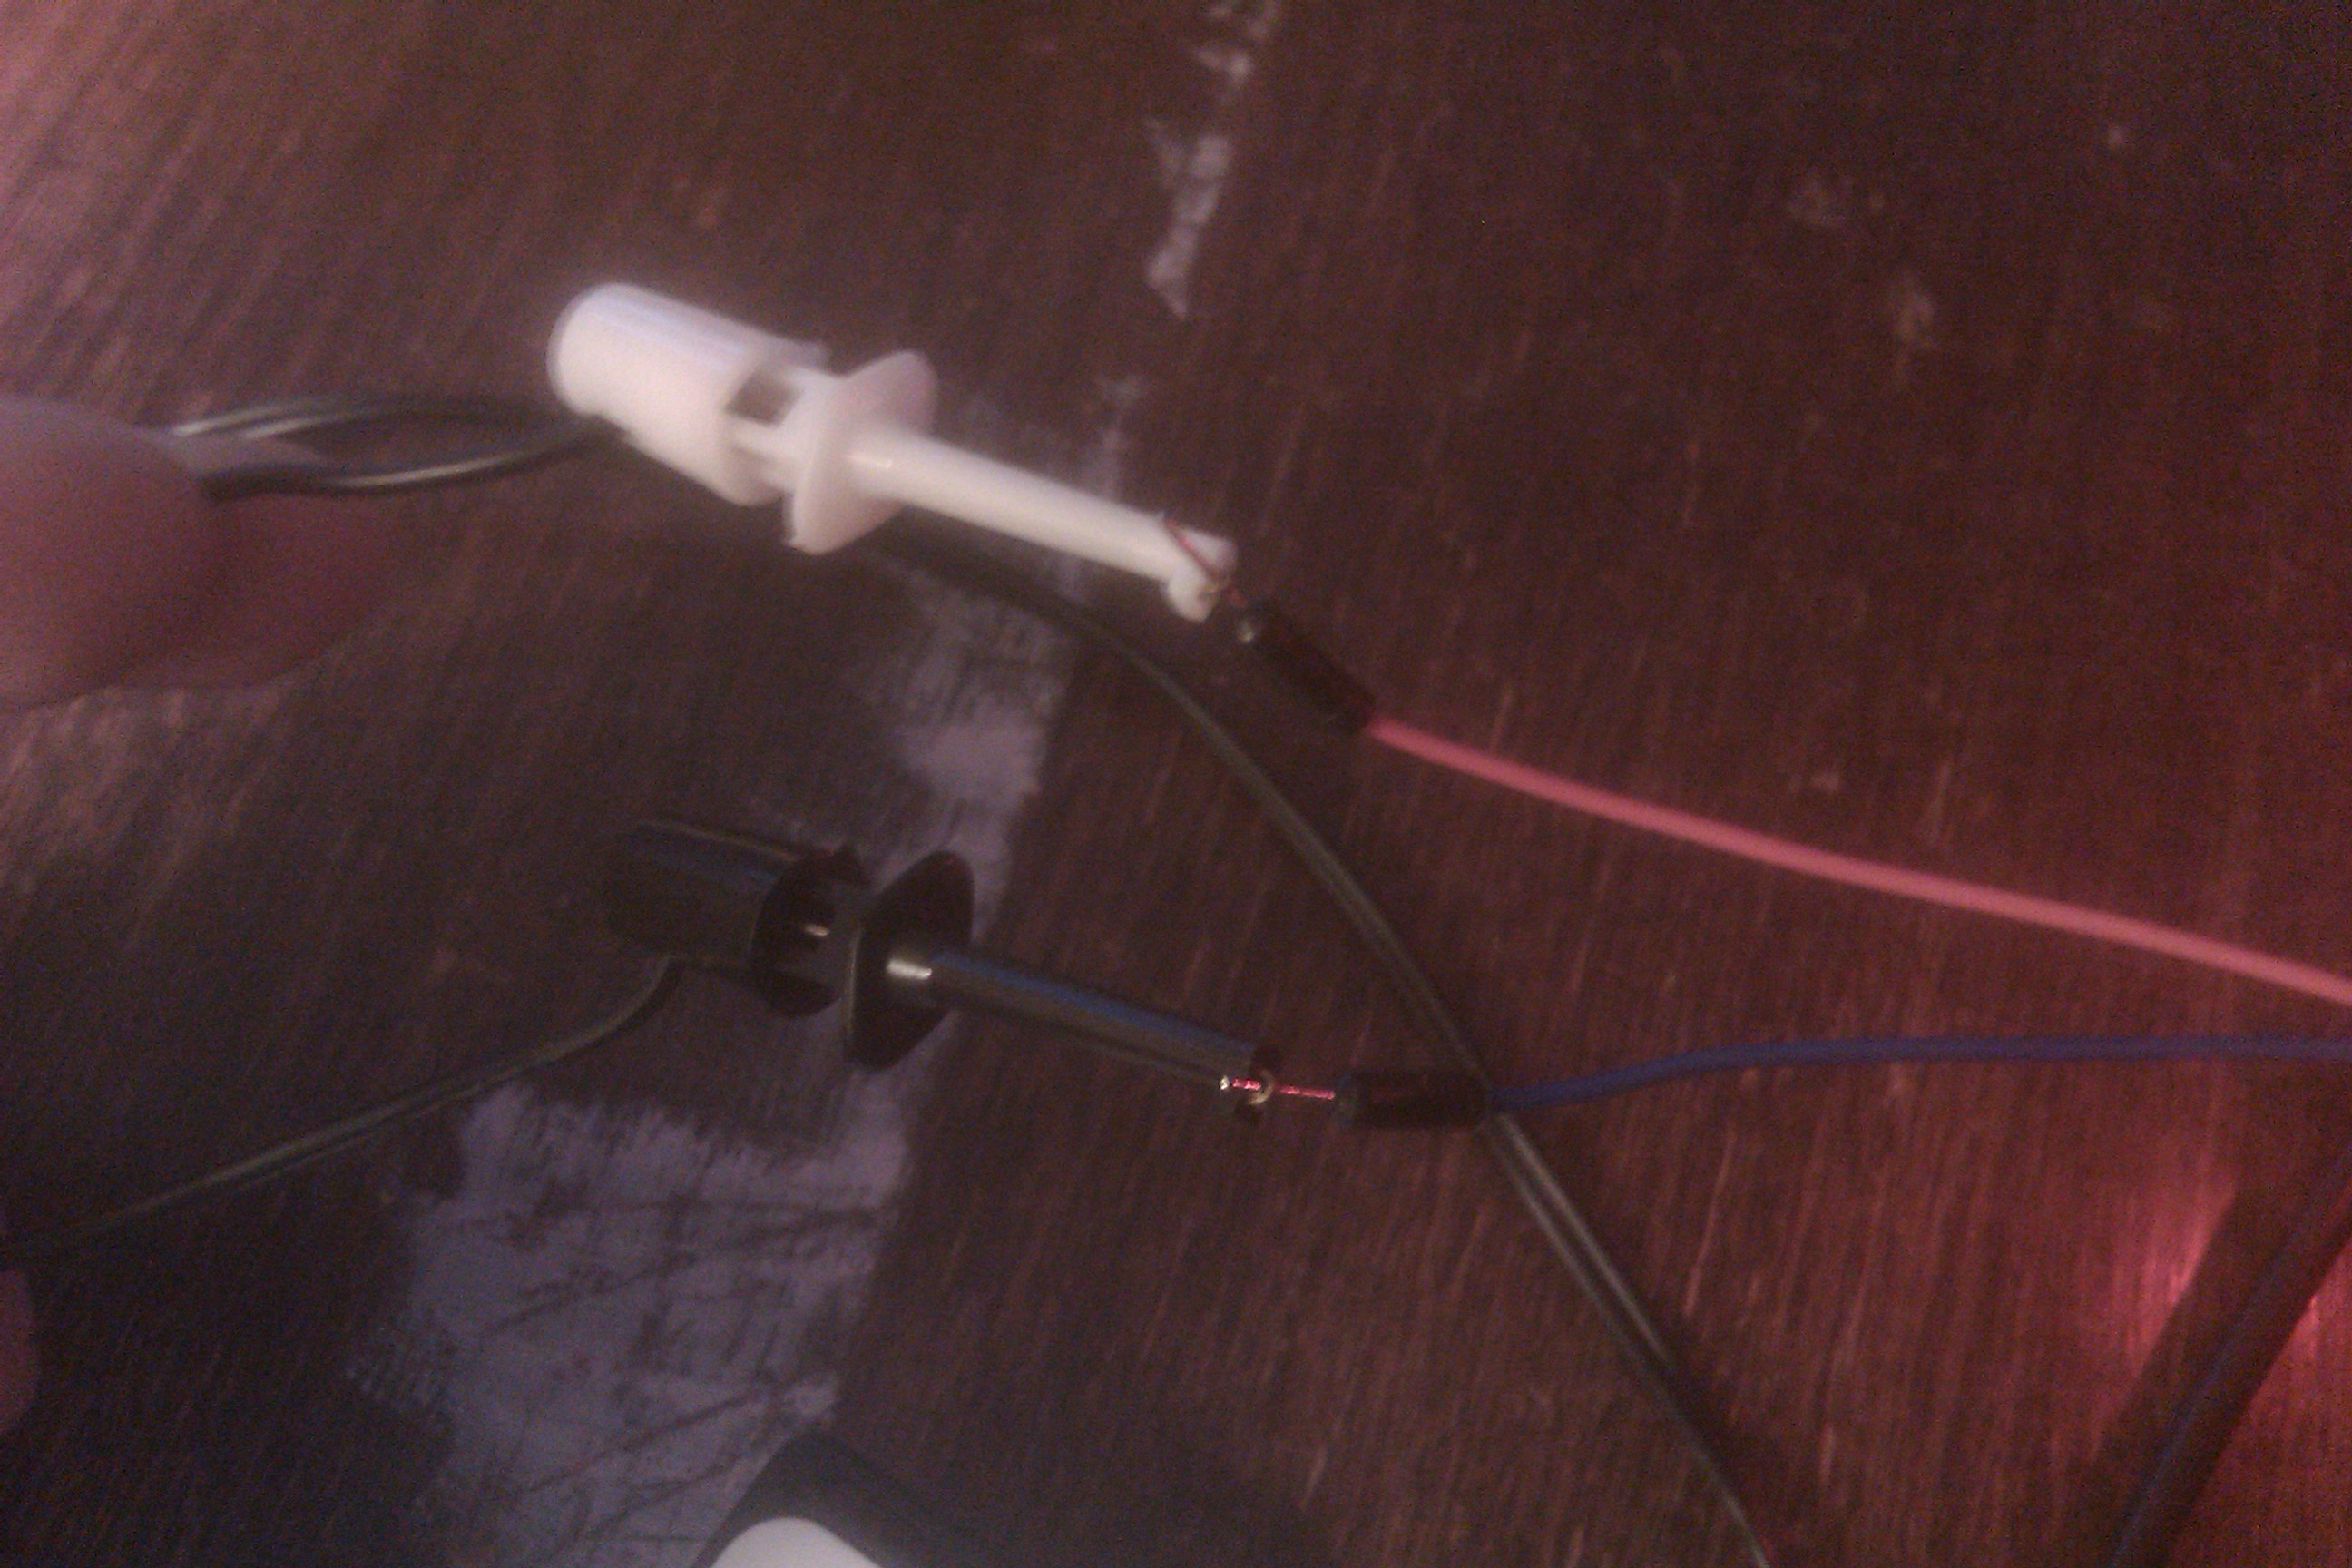
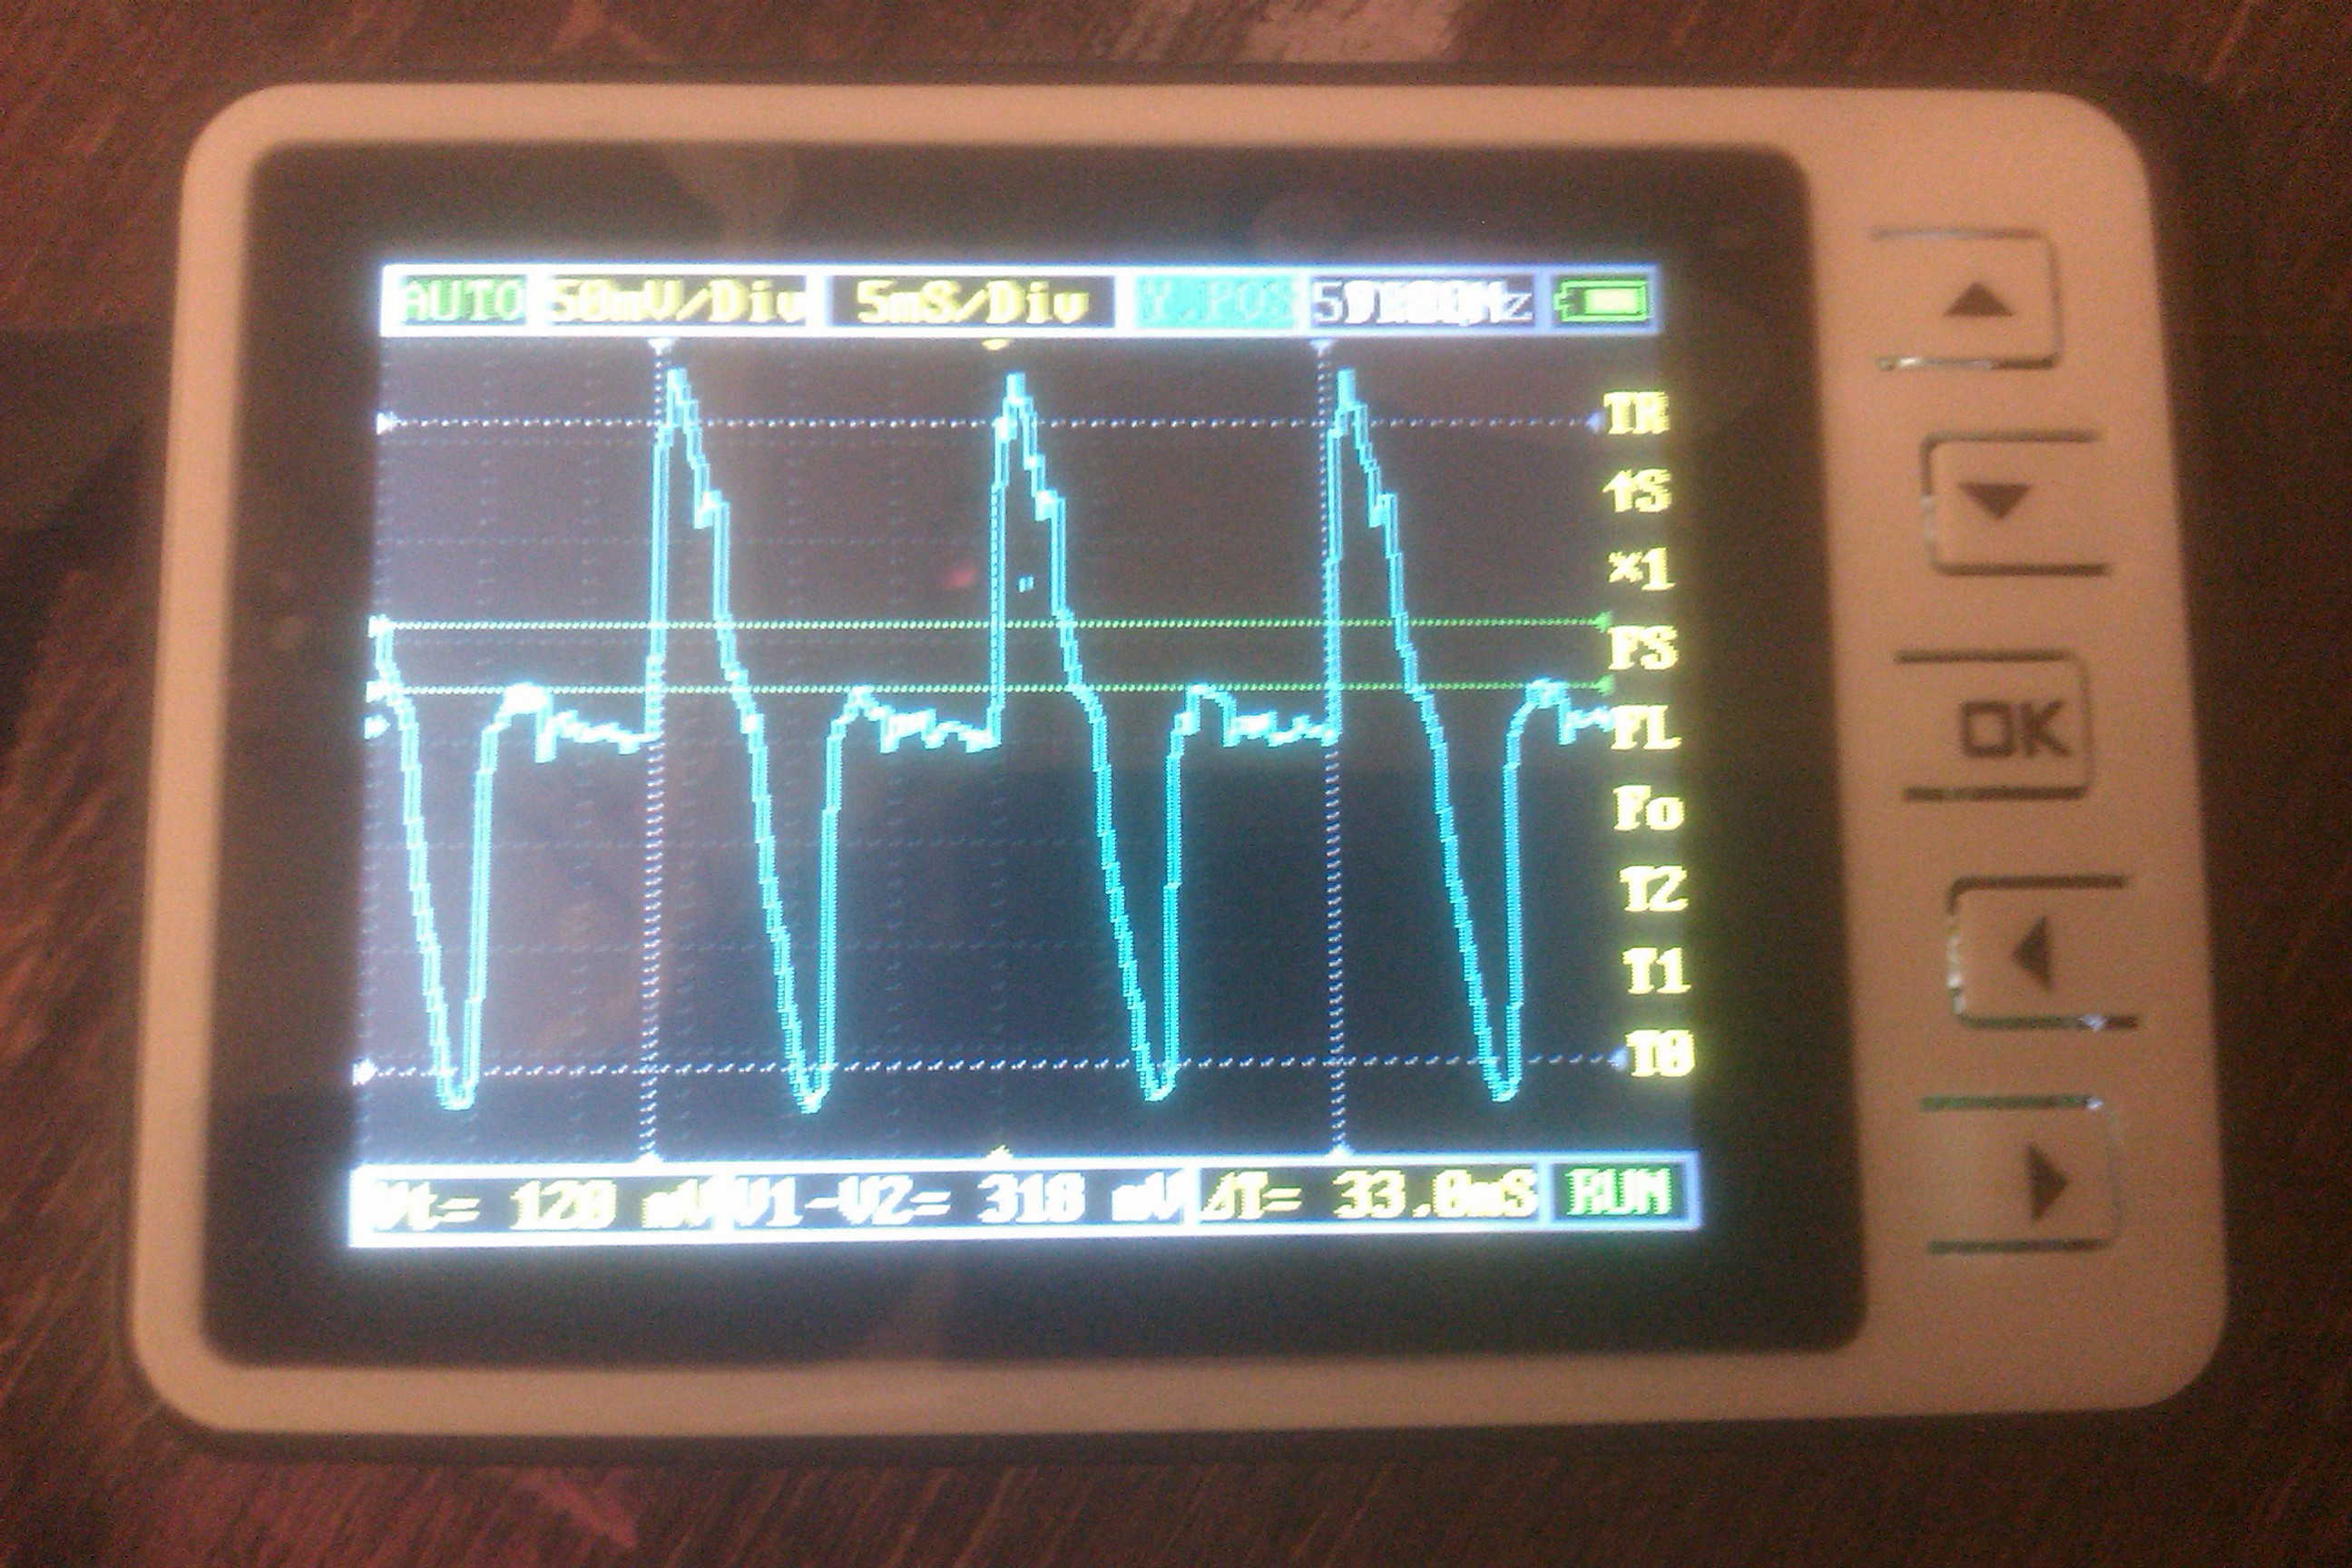
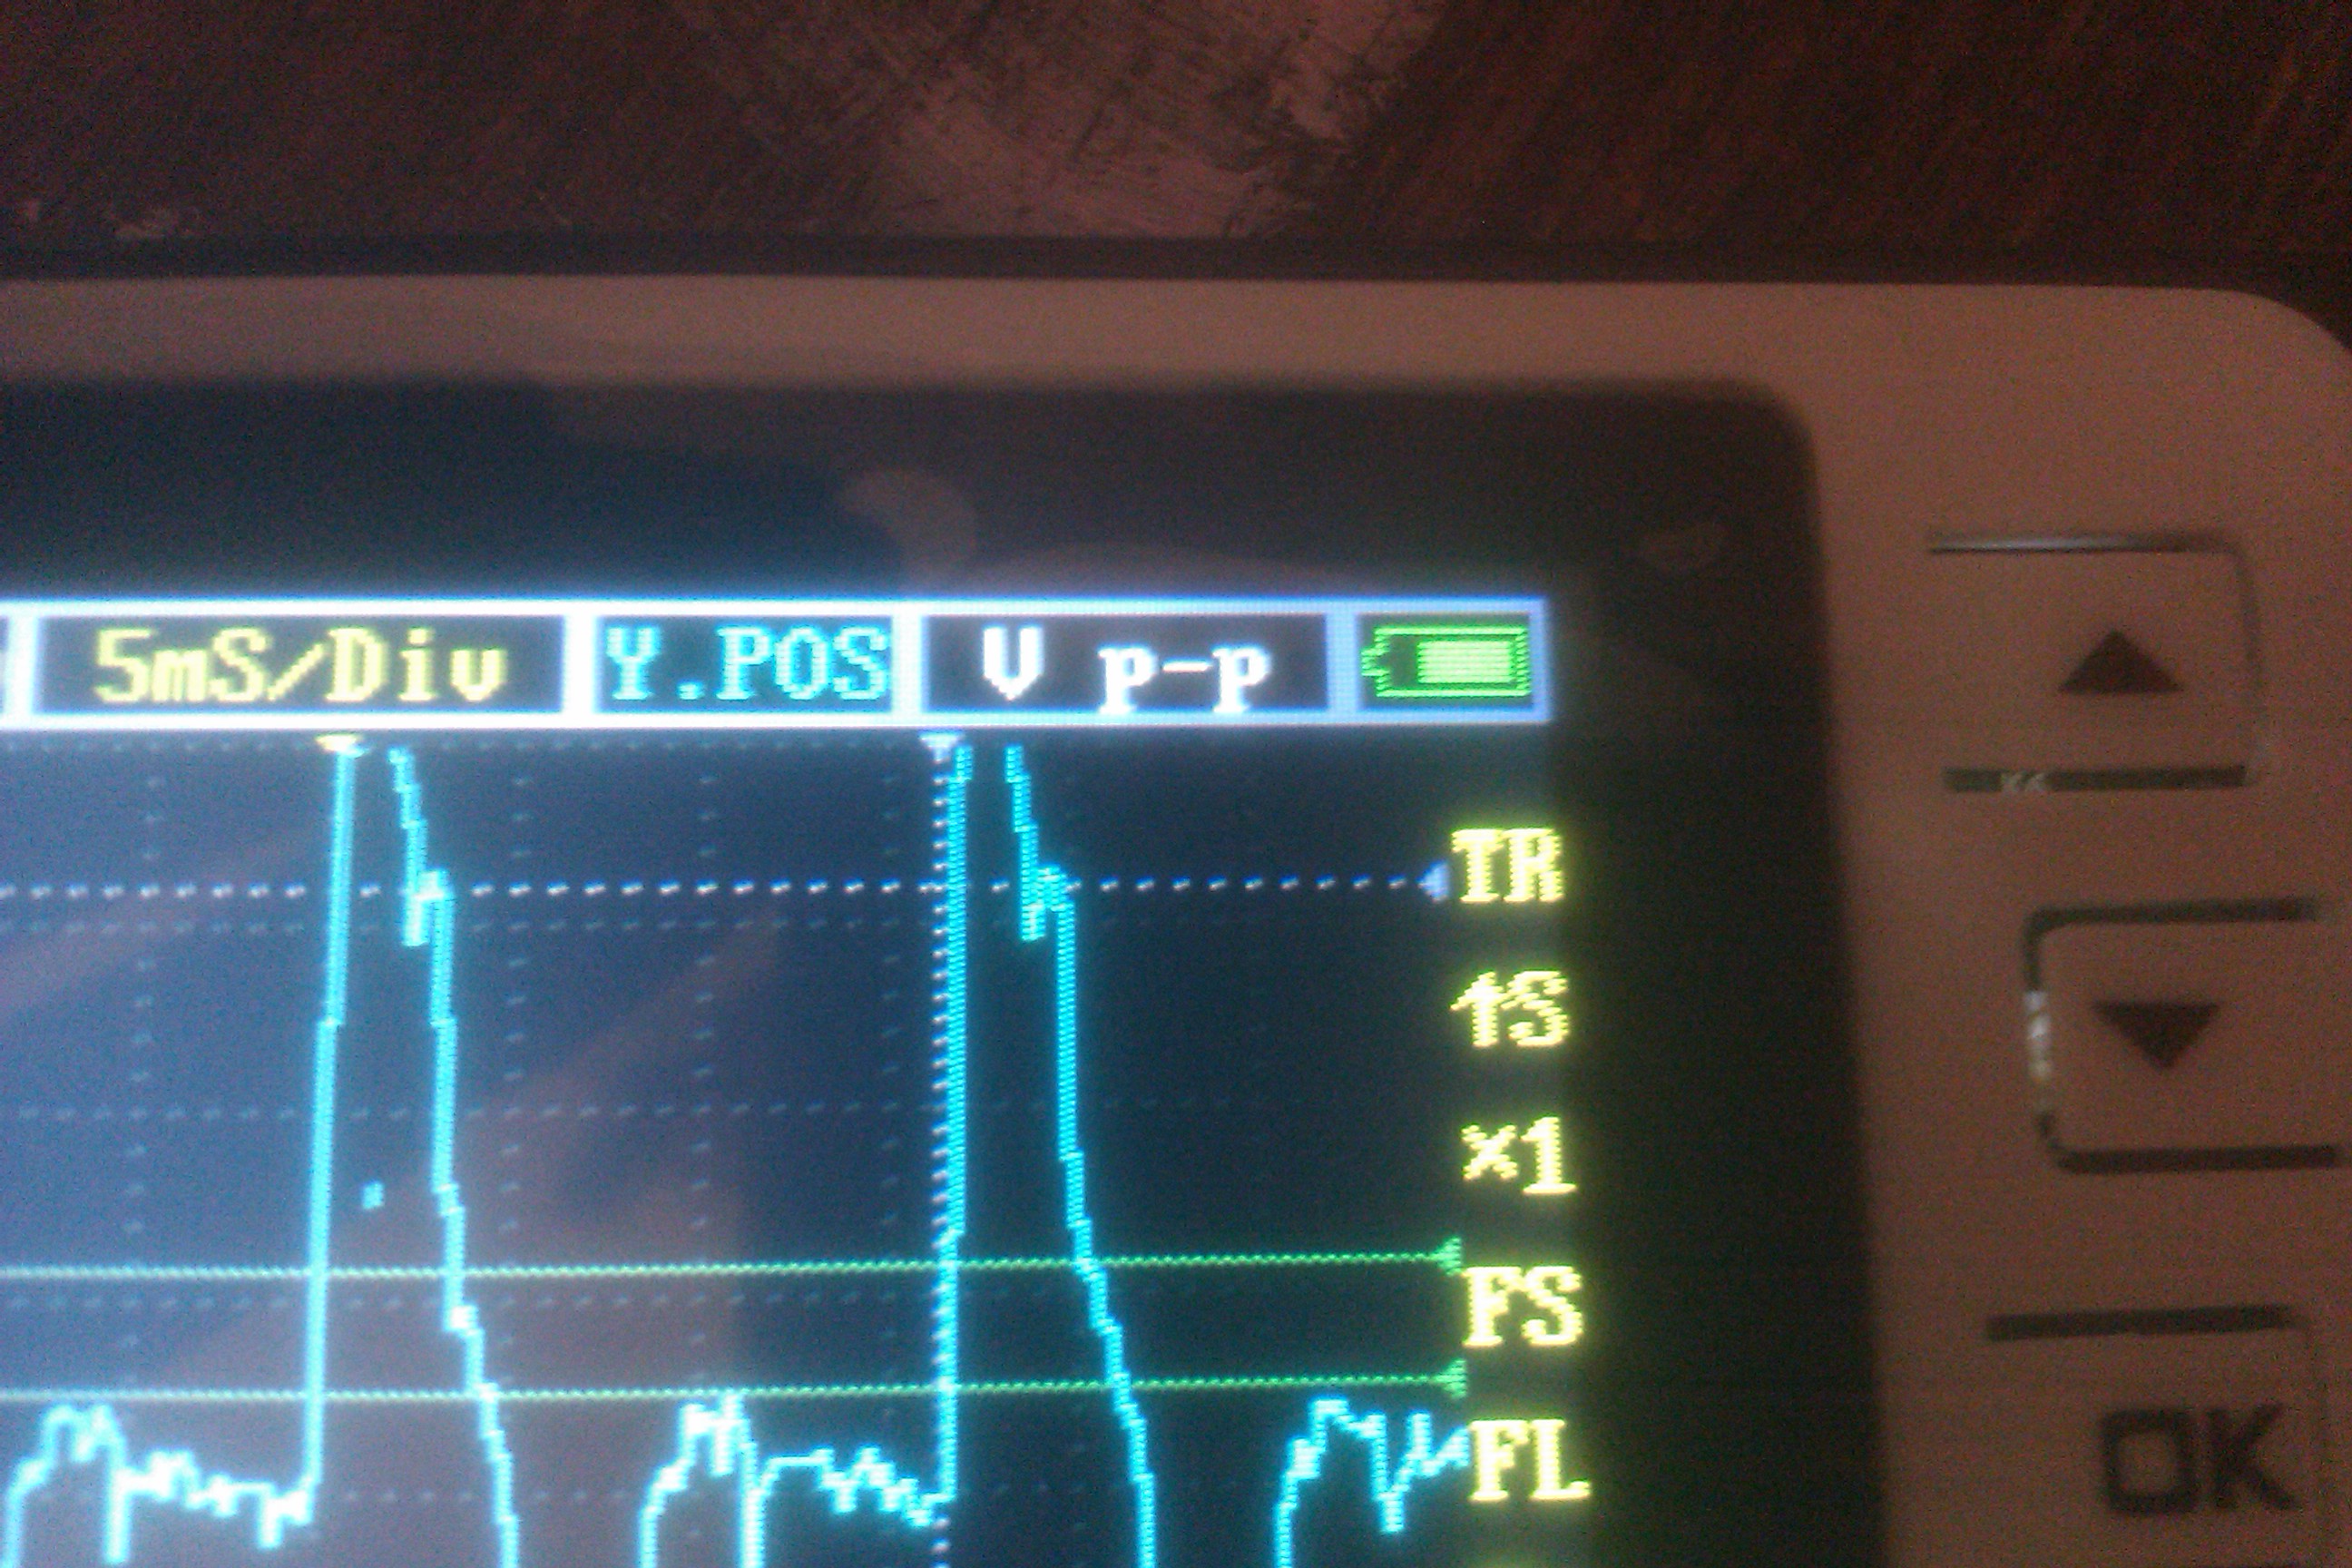
The following section will now demonstrate a few simple steps in how to set up and view a signal on your DSO Nano and view the peak to peak voltage of the signal. For this demonstration we will be connecting the probes to a microcontroller to output a waveform for viewing.
1. Turn your device on by sliding the power switch to the on position. You should see a boot-up screen with general information followed by the main screen. If your device does not power on your battery may be dead.
2. Insert the connection probes into the Probe Jack located on the side of the device.
3. Connect the probes to the point of the circuit you would like to test. Black is connected to ground and red/white is connected to the test point.
4. You should now see your device measuring the signal on the main screen. You may need to adjust the horizontal or vertical scales to get a better view or use the Auto Scale feature.
5. Use the left and right arrows to move to the auto measure window.
6. Use the up and down arrows to change the current measurement to Vpp and select OK
7. The peak to peak voltage will now be visible in the auto measurement window.
Saving an Image to the SD Card
While working on a signal it can be convenient to store an image of the screen for later analysis or reference. The DSO Nano has a built in micro SD card slot for doing exactly this. Waveforms captures can be stored on the SD card which can later be removed and inserted into a computer. To store and view waveform images on a SD card, first make sure the SD care supports SPI mode and format is as a FAT16 memory card. Create a new file named FILEXXX.DAT (where XXX is a three digit number) on the SD card or download the file from http://dso.seeedstudio.com/ and place it on the SD card. To store a screen capture, navigate to the FS option and press OK (confirm). To load a waveform navigate to the FL option and press OK (confirm).
I've also saved a rar file here that contains the first 39 FILEXXX.DAT files here.
I've also saved a rar file here that contains the first 39 FILEXXX.DAT files here.
Downloads
Signal Generator
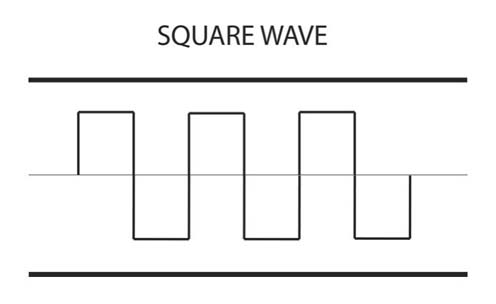
The DSO Nano v2 includes a built in signal generator to produce function waveforms. The signal generator is capable of producing signals between 10 Hz and 1 MHz frequencies. The DSO Nano v2 is only able to output square wave functions at 3.7 Vpp when powered by the battery (5 Vpp when powered by USB port). You can use the Ref. Square Wave Frequency (Fo) to adjust the frequency of the generated signal
WARNING!

Alright... here's my public service announcement....
1. Always be careful when working with electronics and circuitry.
2. Always remove power source when touching components of circuit.
3. Be careful when applying probes to circuit not to short any parts of the circuit.
4. Do not apply more than 80 Volts peak to peak to the input of the oscilloscope. Be careful when using attenuation probes (if on x10, only 8 Volts peal to peak can be applied).
Thanks everyone.
DN