DIY Real Energy Meter With Arduino and ESP8266
by mcmchris in Circuits > Arduino
48975 Views, 112 Favorites, 0 Comments
DIY Real Energy Meter With Arduino and ESP8266
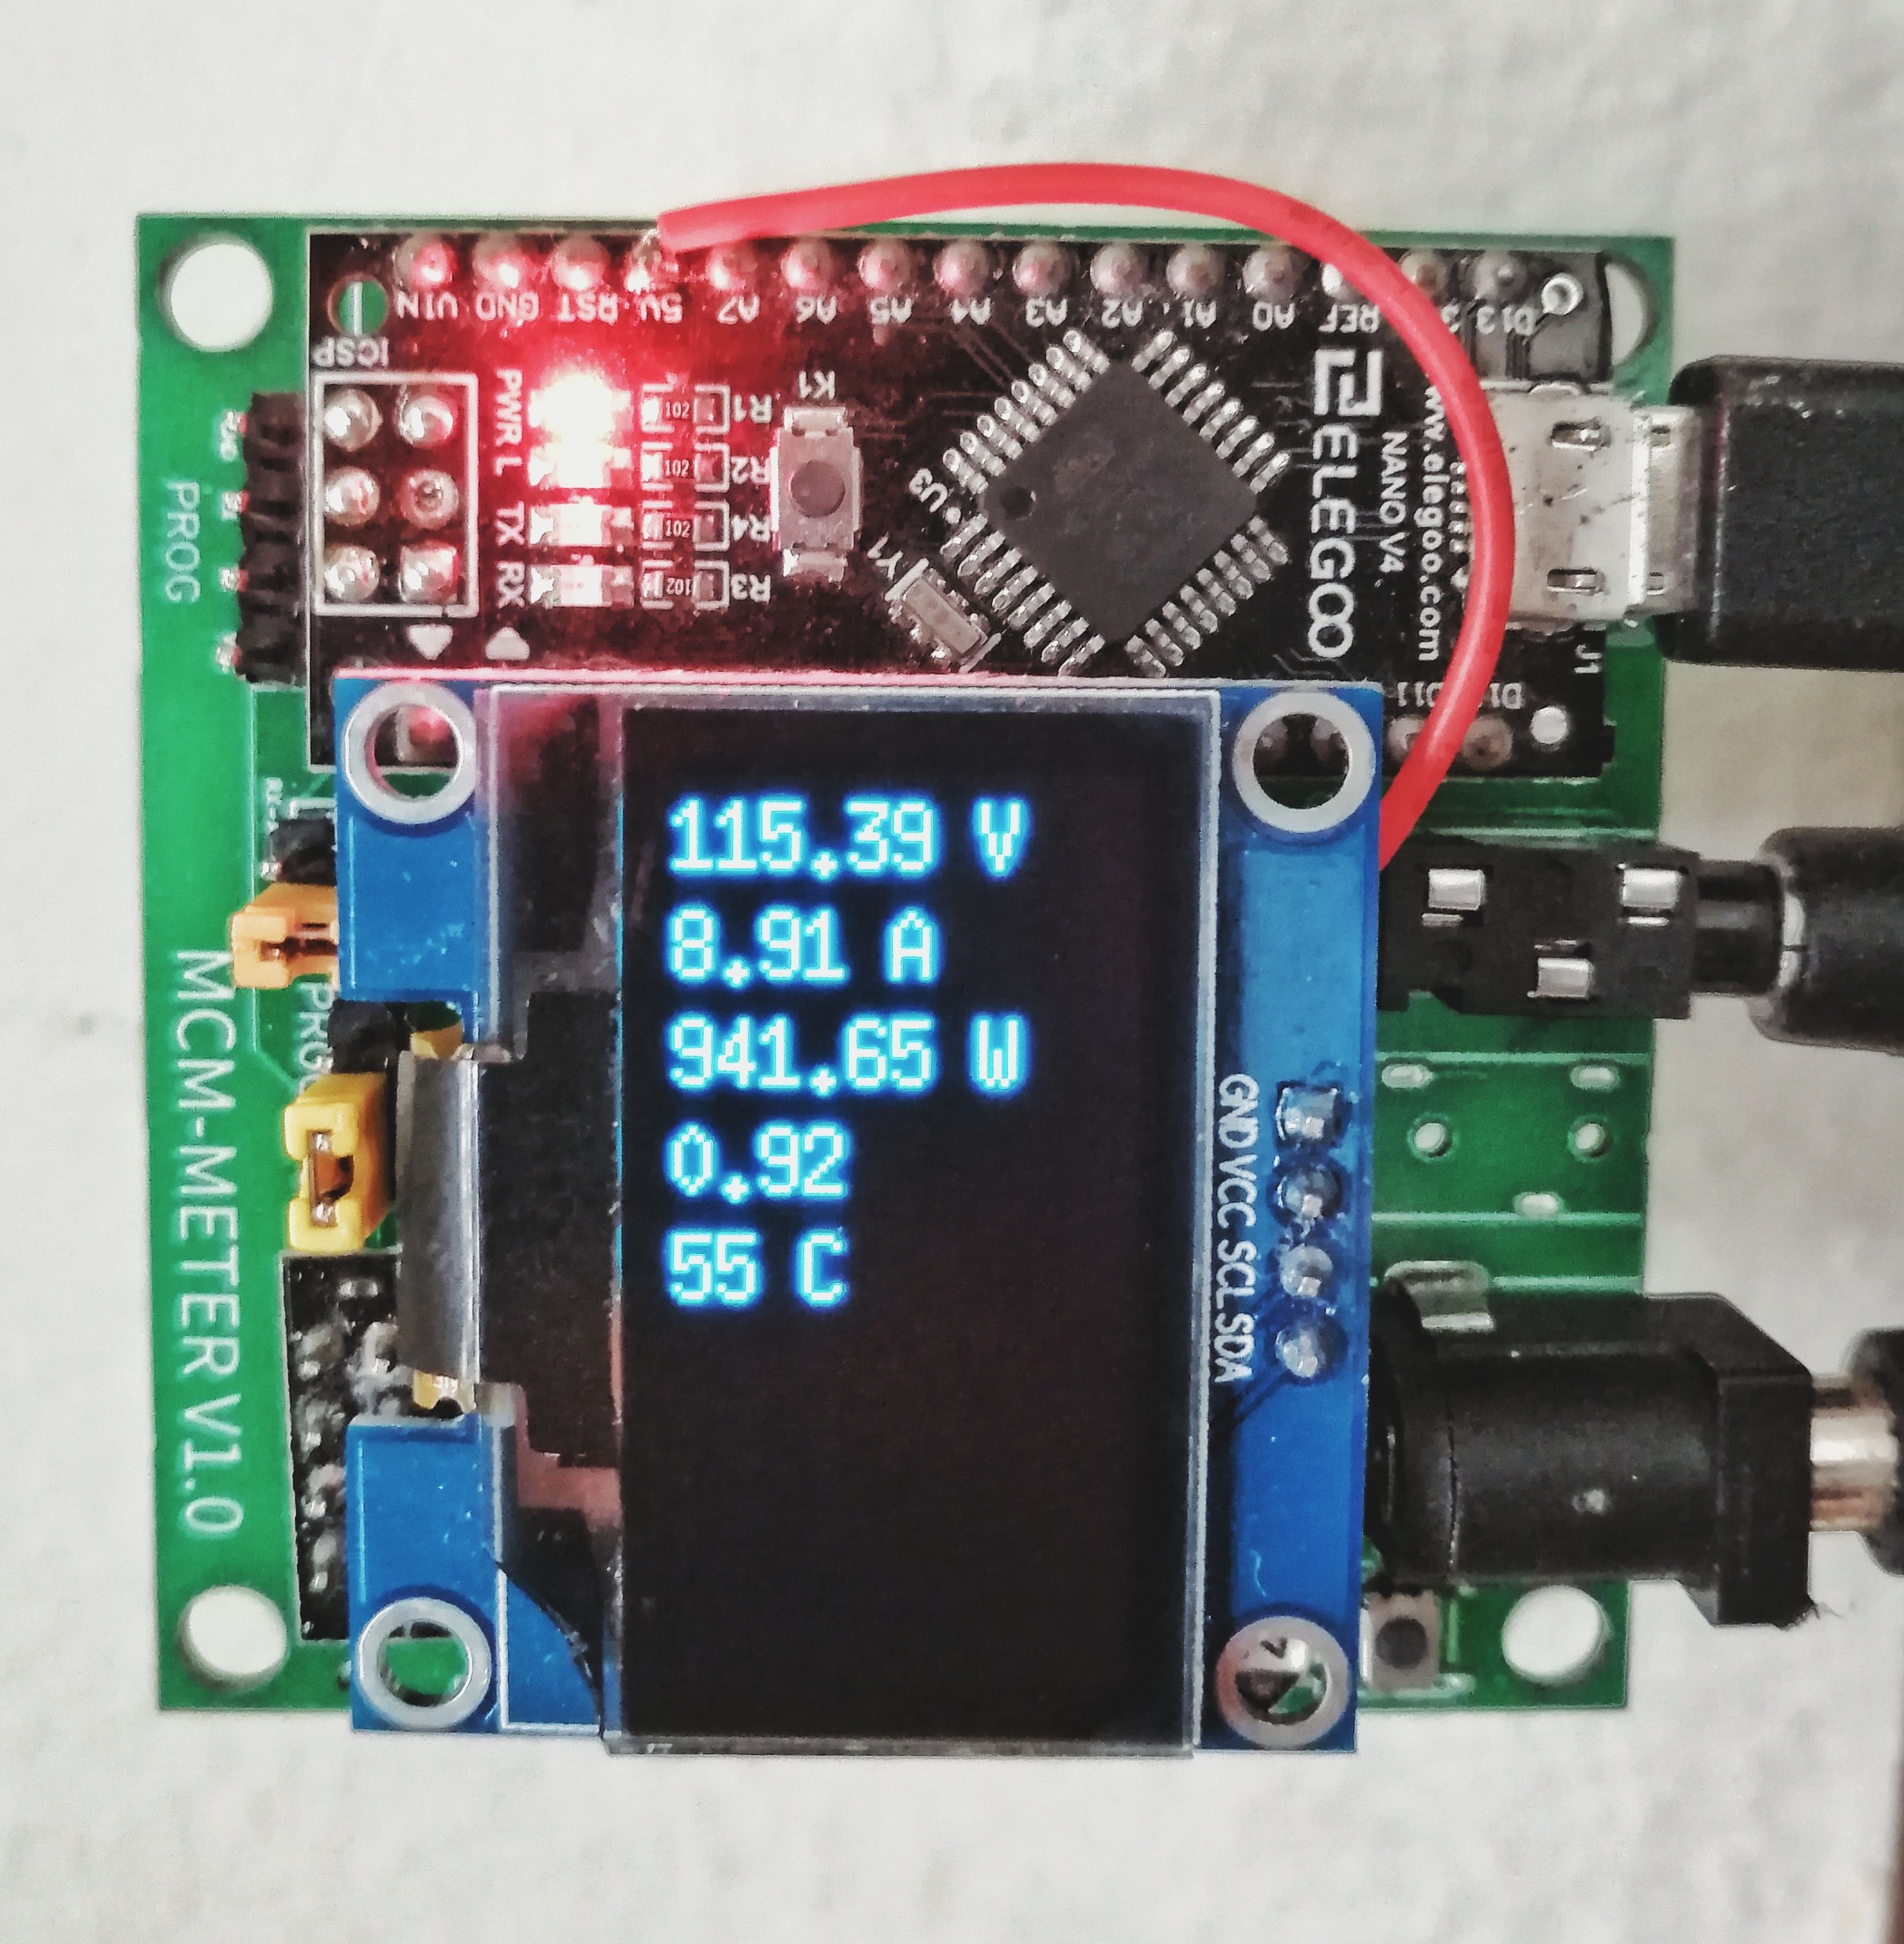
It is not a mystery that we usually have doubts about the energy consumption records presented by the bills.
For this reason I set out to create my own energy meter to be sure of what is really happening, if we are being lied to and if we are really being deceived.
Here I leave you a tutorial with all the information so you can make your own version.
If you are a visual learner I know that a video worth more than 1000 words, so here is a 2 parts Tutorial video. (I am a Spanish speaker, so please consider turning on English subtitles):
Skills Required:
.png)
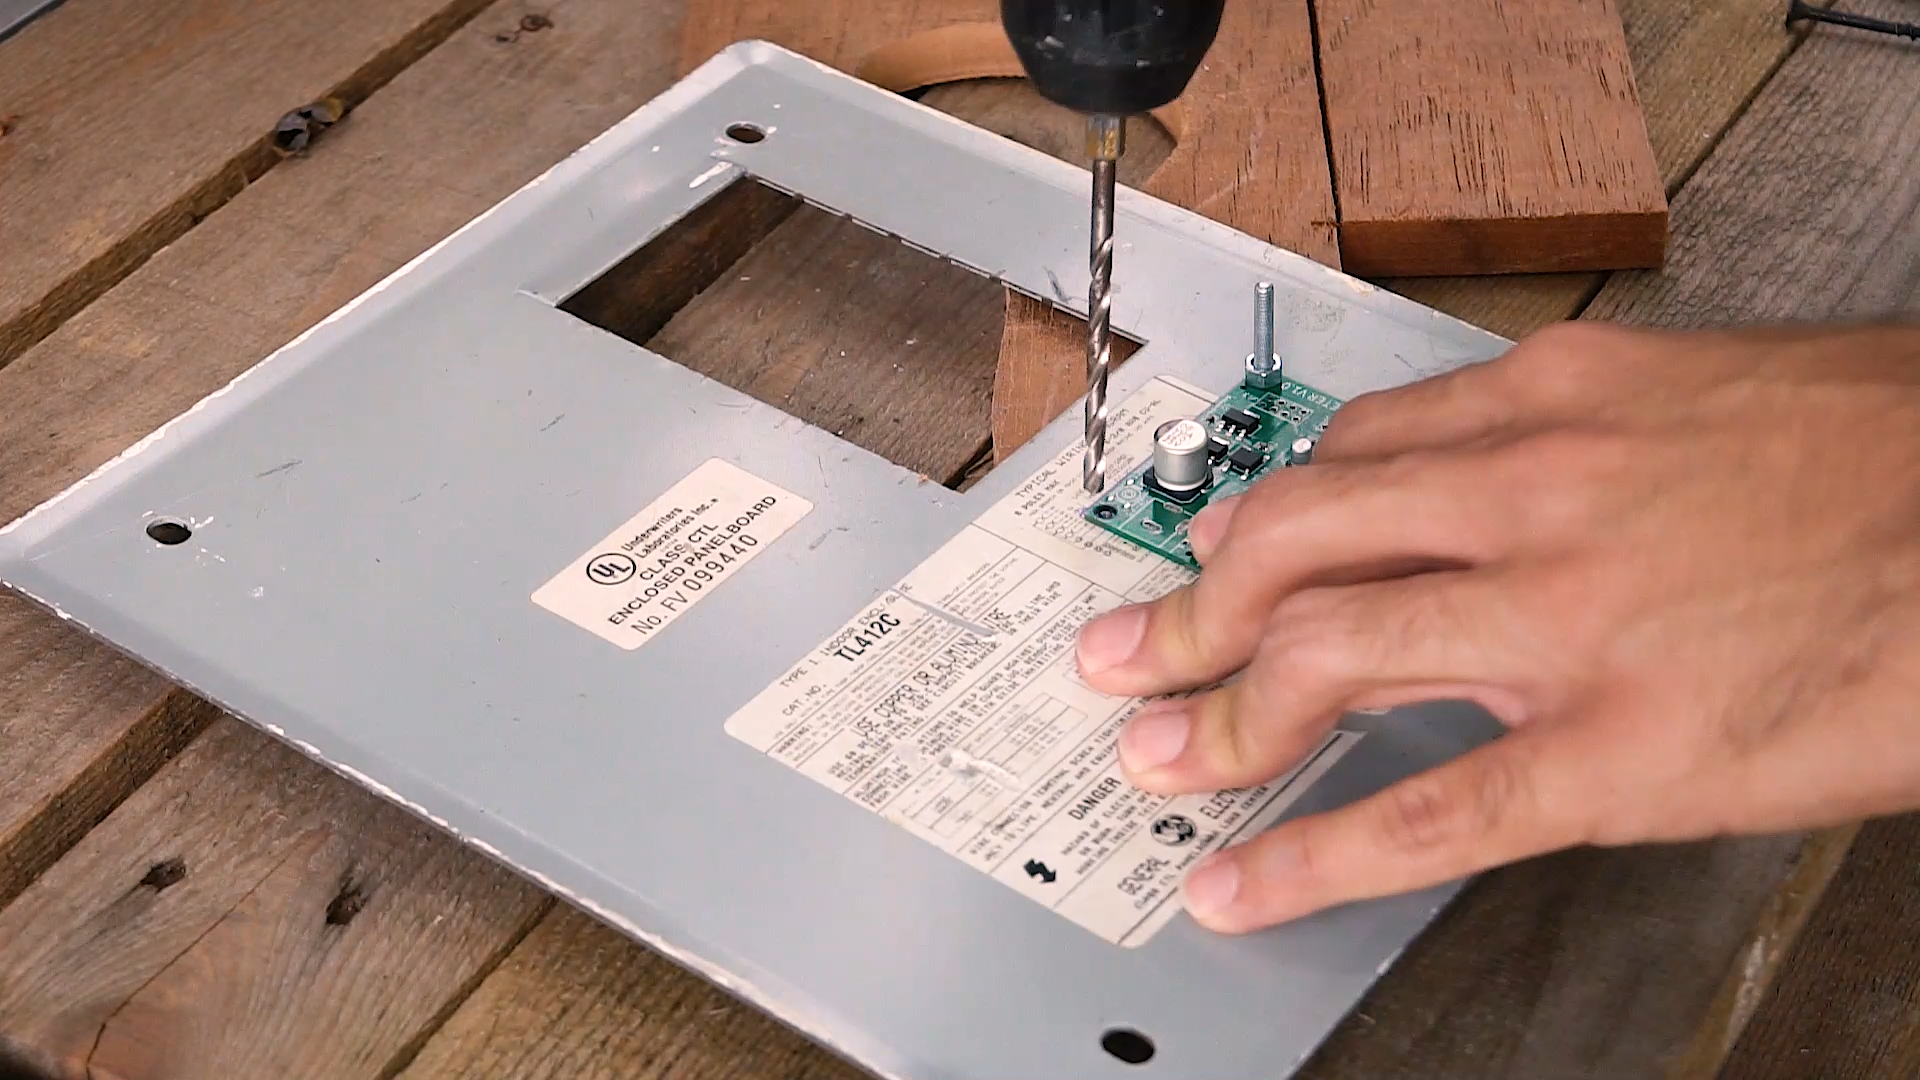
This project may seem difficult or very complex, but it is definitely not completely, since you will have all the guidance for the construction, it was difficult for me to design it to make life a little easier for you. Any conceptual doubt, you are free to ask it without problems.
You should have an understanding of:
- Basic electronics. (We are going to be using some electronics principles that are good to know to understand how this meter works).
- Handling of cutting tools and drills.
- How to solder. (To place the components we need).
- How to use a meter intruments as multimeters and clamp meters.
- Writing code in C. (if you want to make any modification to the main code that is provided).
Components and Parts List
.png)
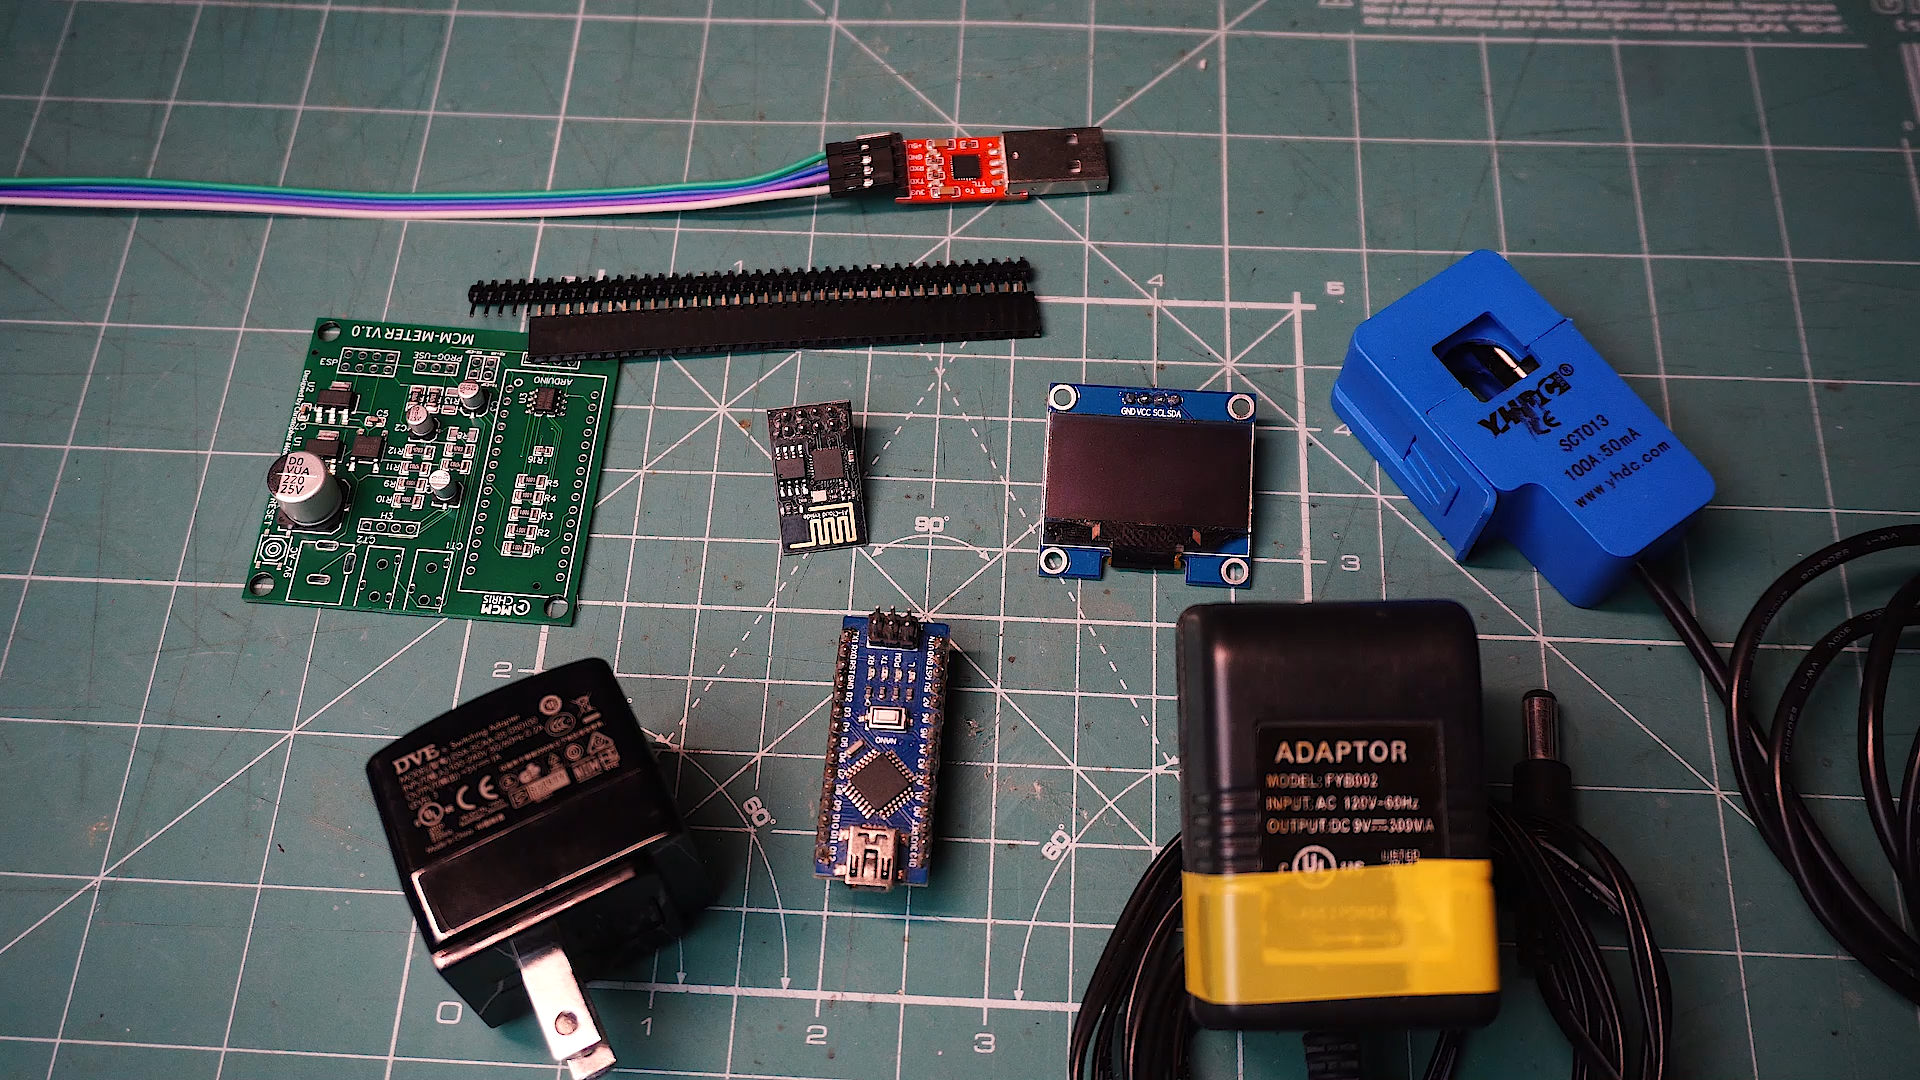
The Electronics discrete components as resistors and transistors will be attached in a BOM file in the PCB Step.
- Here is the list of what you will need for the whole process:
-OLED Screen: https://www.digitspace.com/1-3-oled-display-modul...
-ESP-01: https://www.digitspace.com/esp-01s-8266-serial-to...
-Arduino Nano: https://www.digitspace.com/esp-01s-8266-serial-to...
-PT Power Jack: https://www.digitspace.com/esp-01s-8266-serial-to...
-3.5mm CT Jack: https://www.digitspace.com/esp-01s-8266-serial-to...
-CT (Current Sensor): https://www.digitspace.com/esp-01s-8266-serial-to...
-PT (Voltage Sensor): https://www.digitspace.com/esp-01s-8266-serial-to... --
-3D printer: https://www.digitspace.com/esp-01s-8266-serial-to...
-USB to TTL: https://www.digitspace.com/ft232-module-usb-to-ttl...
Circuit Diagram
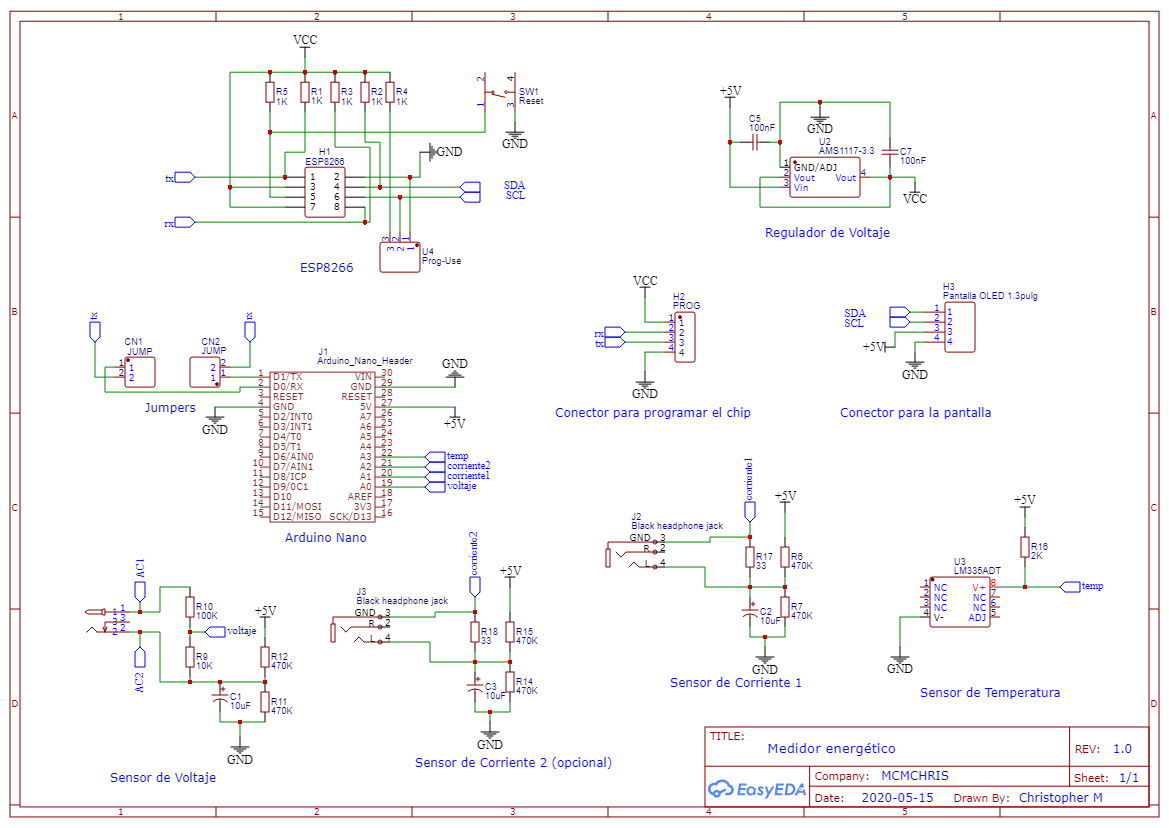
Here is the Circuit Diagram of our project:
It has all the internal conections of the circuit that will us allow to create the PCB design later.
I also attached the PDF of the Schematics so you can see it better.
PCB Design and Ordering
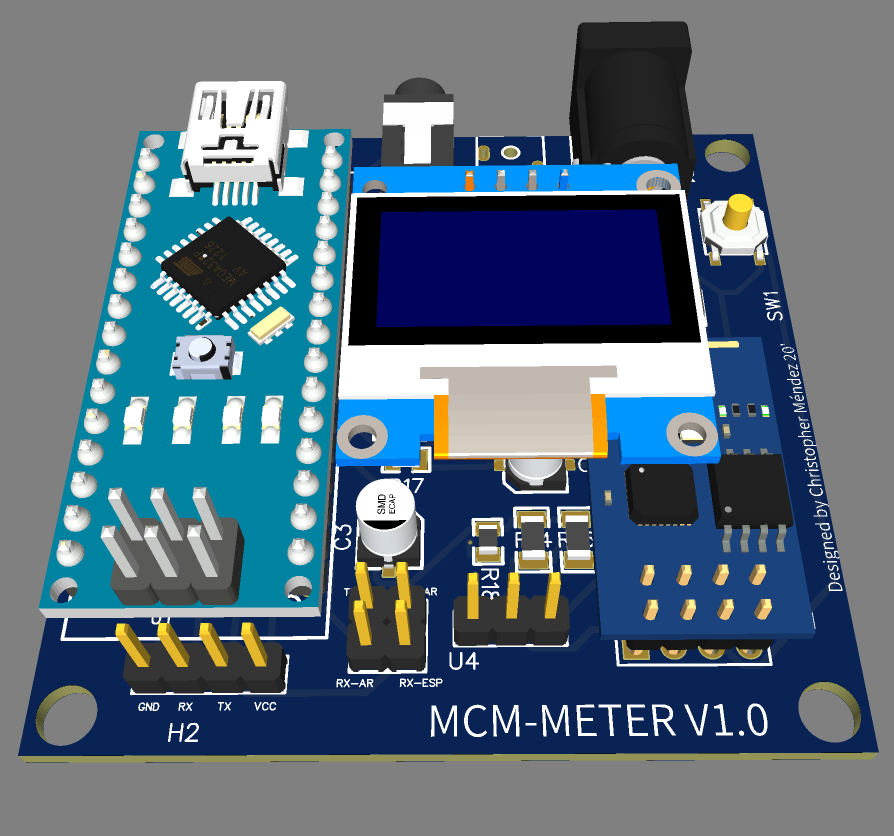
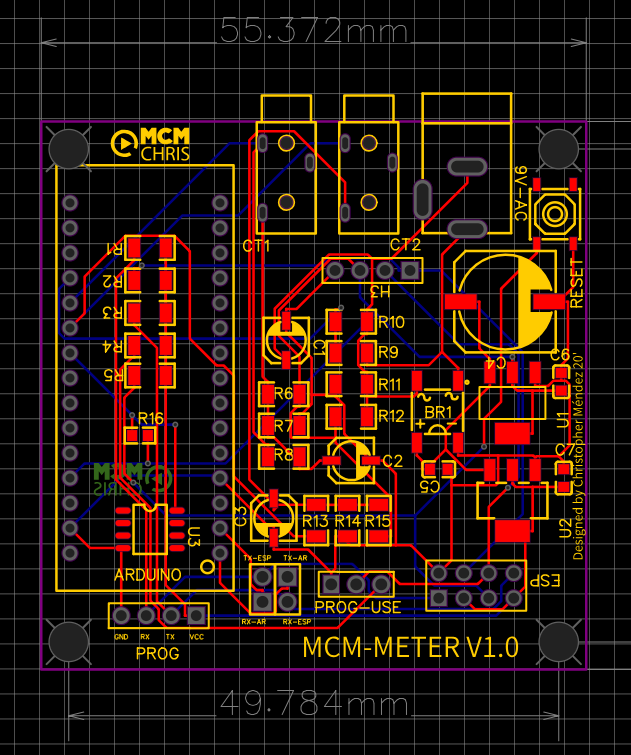
.png)
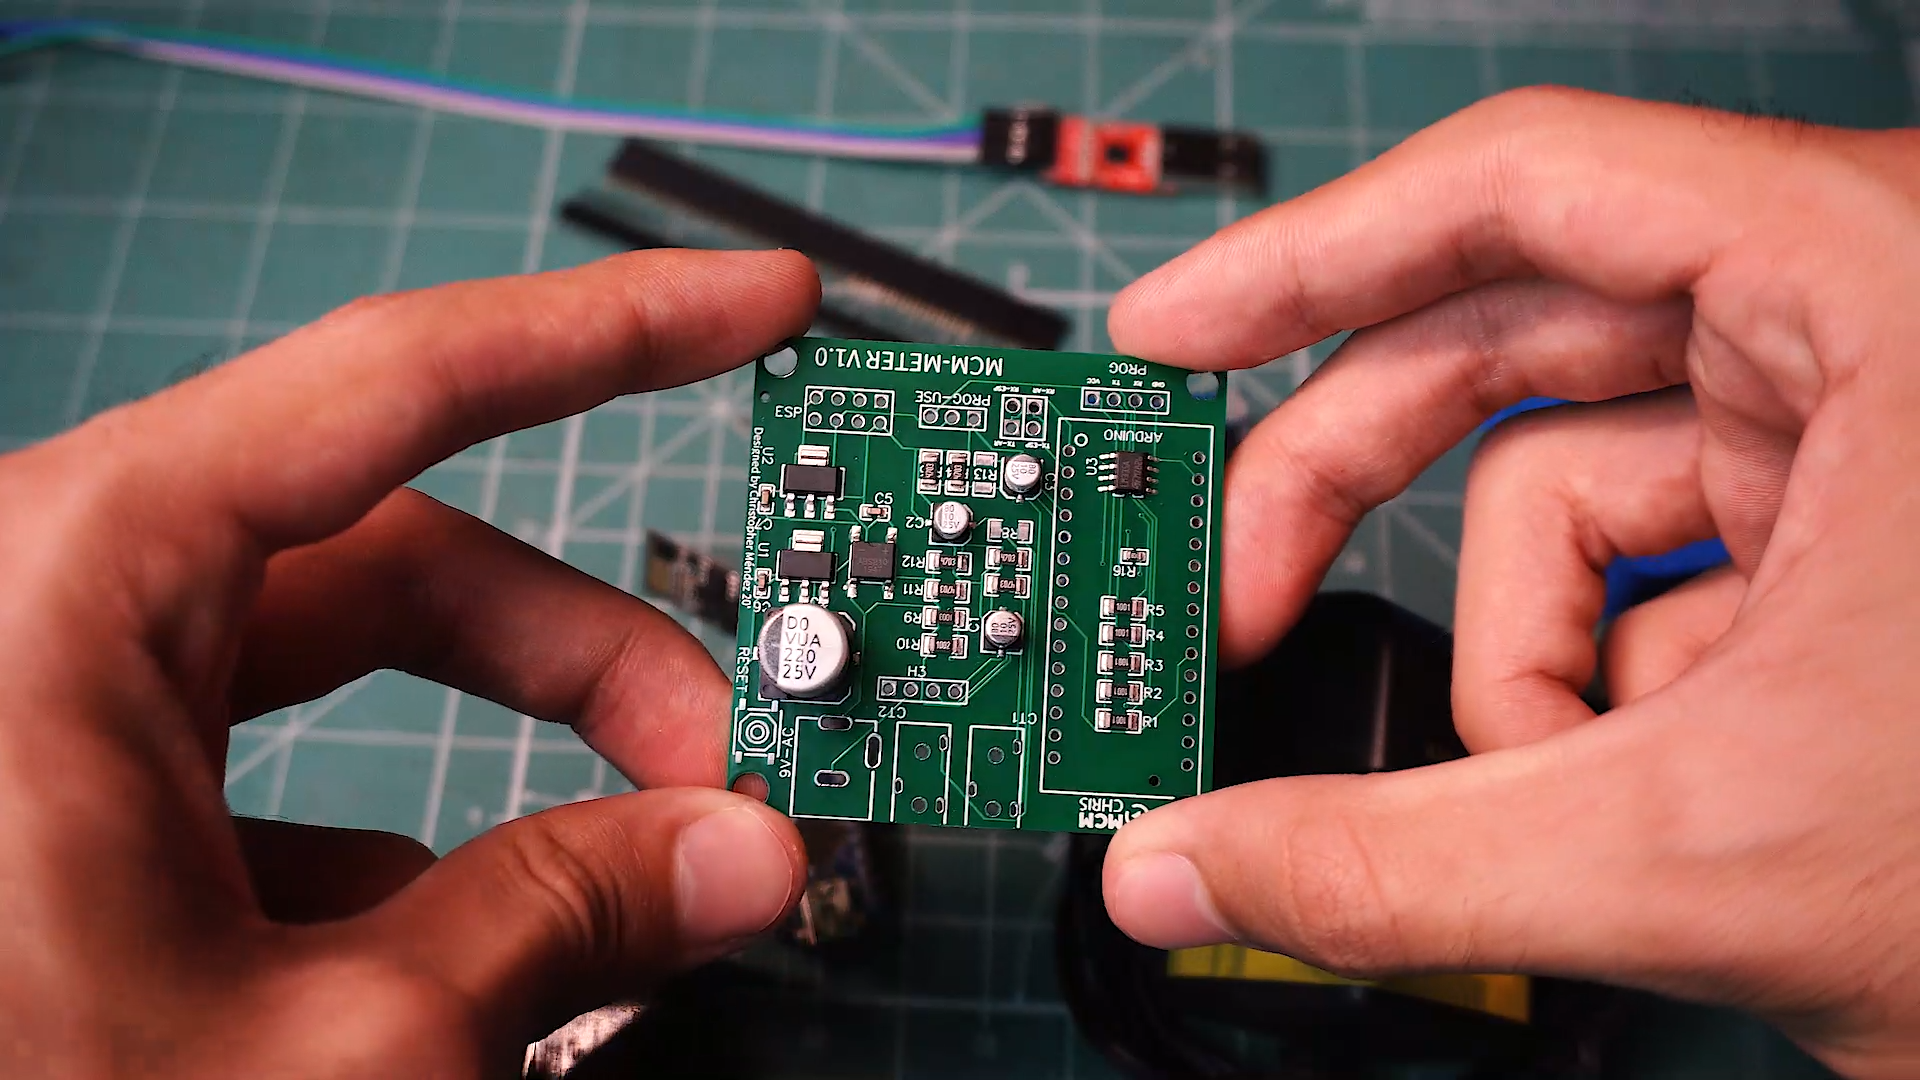.png)
For the implementation of a good project we need a reliable assembly for the circuit that makes it up, and there is no better way to do it than with a good PCB.
Here you can download the Gerber, BOM and Pick & Place Files, the ones you need to order your PCB on your PCB manufacturing company.
I suggest JLCPCB:
📦$2 for 5 PCBs & cheap SMT (2 Coupons)
Un Zip de .rar file with a software like WinRar or any other.
Downloads
3D Base for the Circuit
.png)
.png)
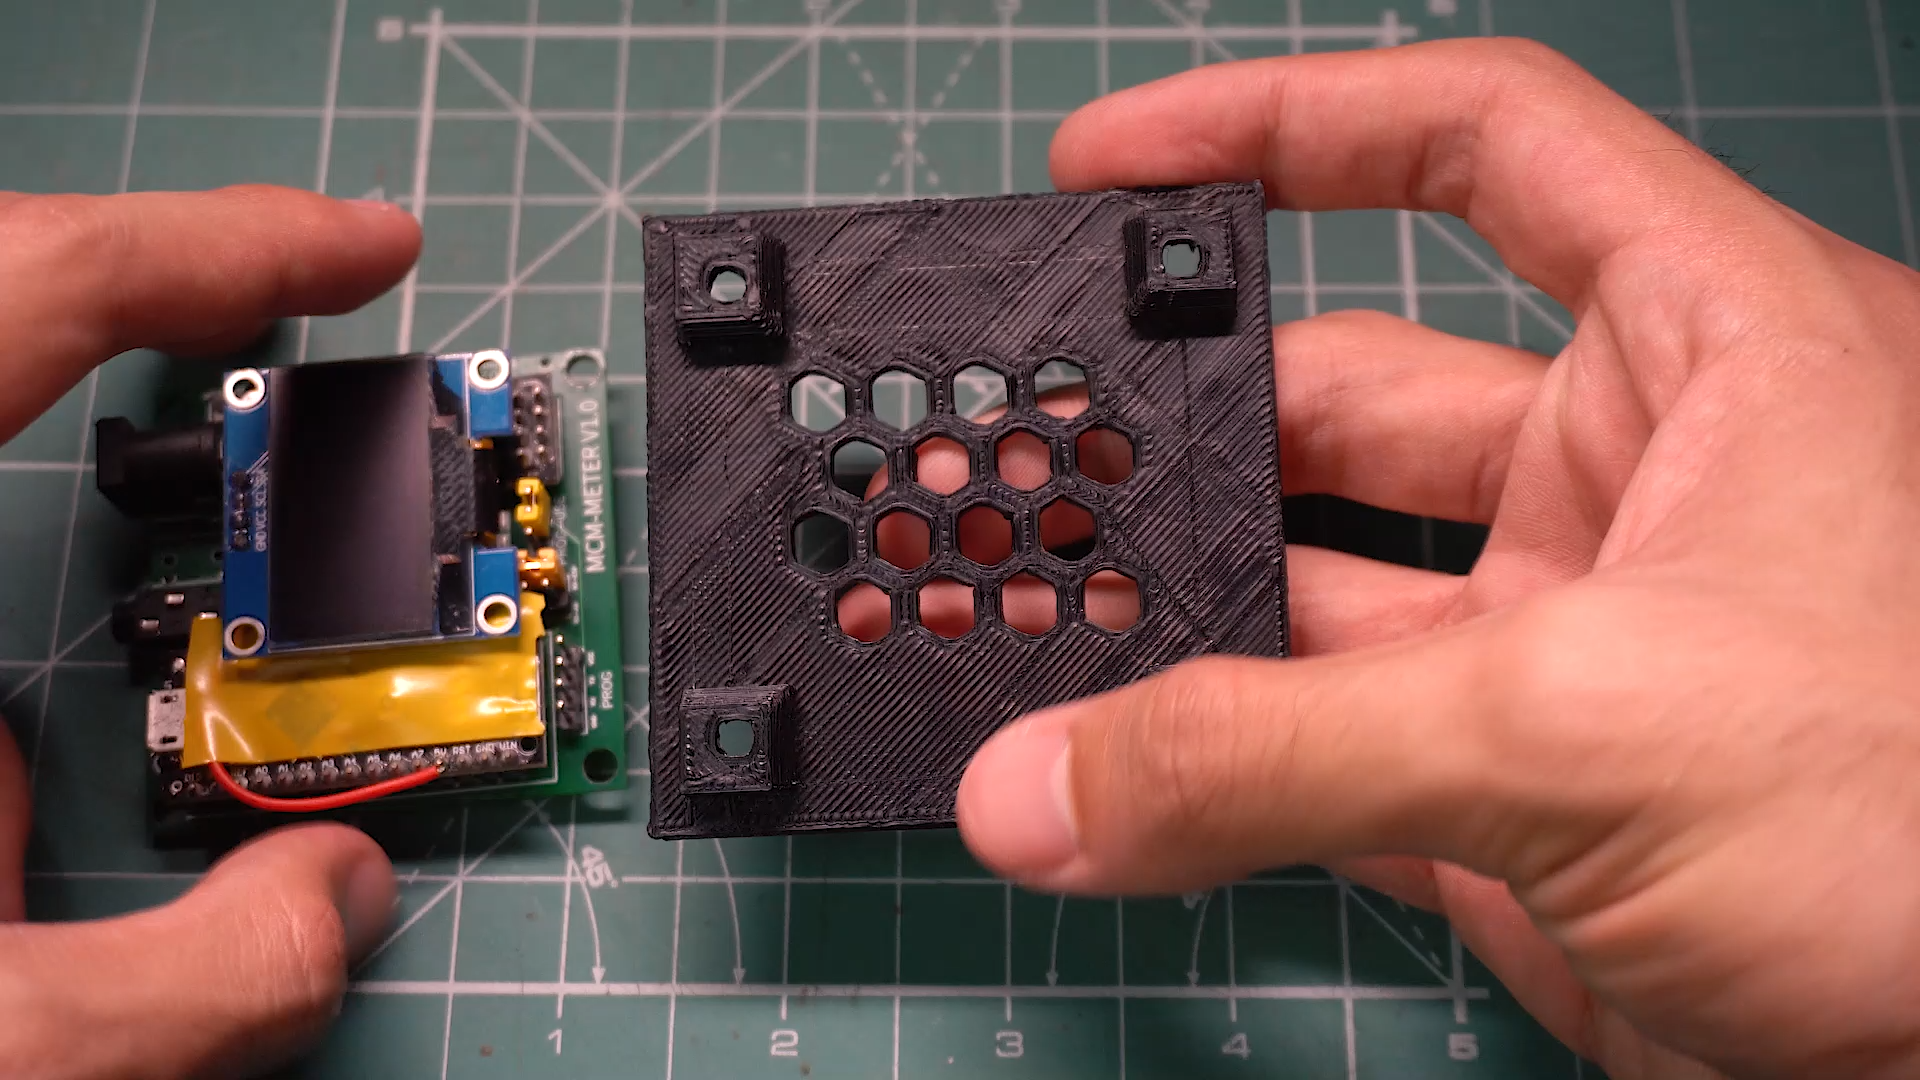
We are going to put (well, in my case), the circuit inside the Breakers box of my house, so I designed a plastic protection base for the circuit to be apart of the metal parts and wires that are inside the panel.
You can download the STL file to print your own if you have a 3D printer o Hand make it with plastic, cardboard or something that isolate electricity.
Downloads
Programming the Arduino Board and the ESP8266
.png)
We are using an Arduino nano because of it ADC pins, pins that we don't have on the ESP, so we first need to upload the program into the Arduino board that will be reading the data from the sensors and making all the maths that will allow us to get the Real Power, Power factor, Current, Voltage, and on.
1- To program the Arduino we need to connect it directly to our PC through the USB cable, open the Code "Arduino-Code", install the libraries that I also attached and click on upload.
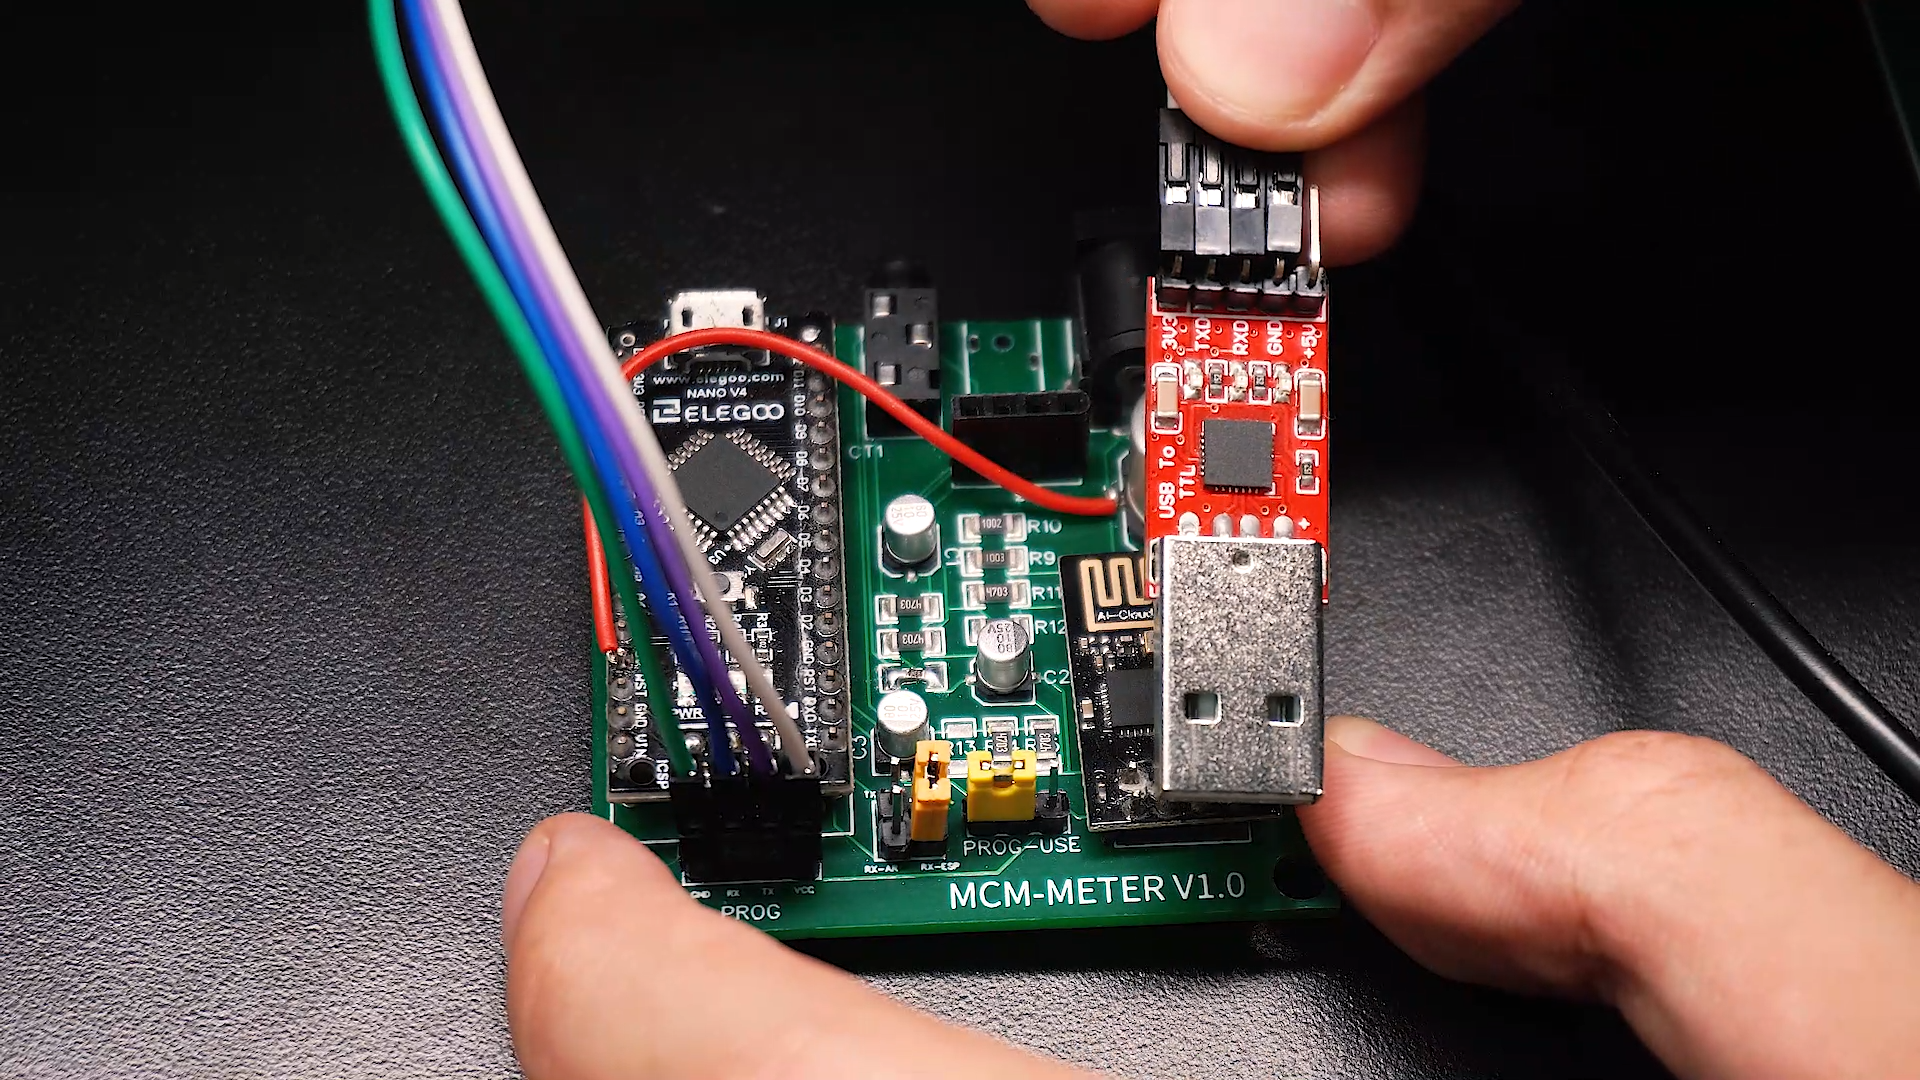
2- To program the ESP8266 we need to place the jumper on (PROG position), connect the USB to TTL converter to our PCB on it respectives pins and then to our PC, install the libraries and then upload. (Need to have the ESP8266 Packaje installed on your IDE).
Install the APP and Set It
.png)
.png)
.png)
.png)
.png)
.png)
.png)
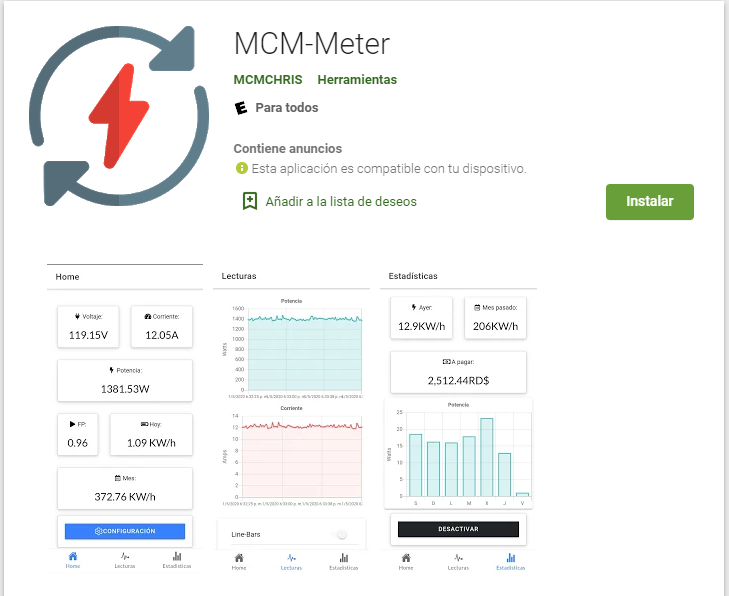
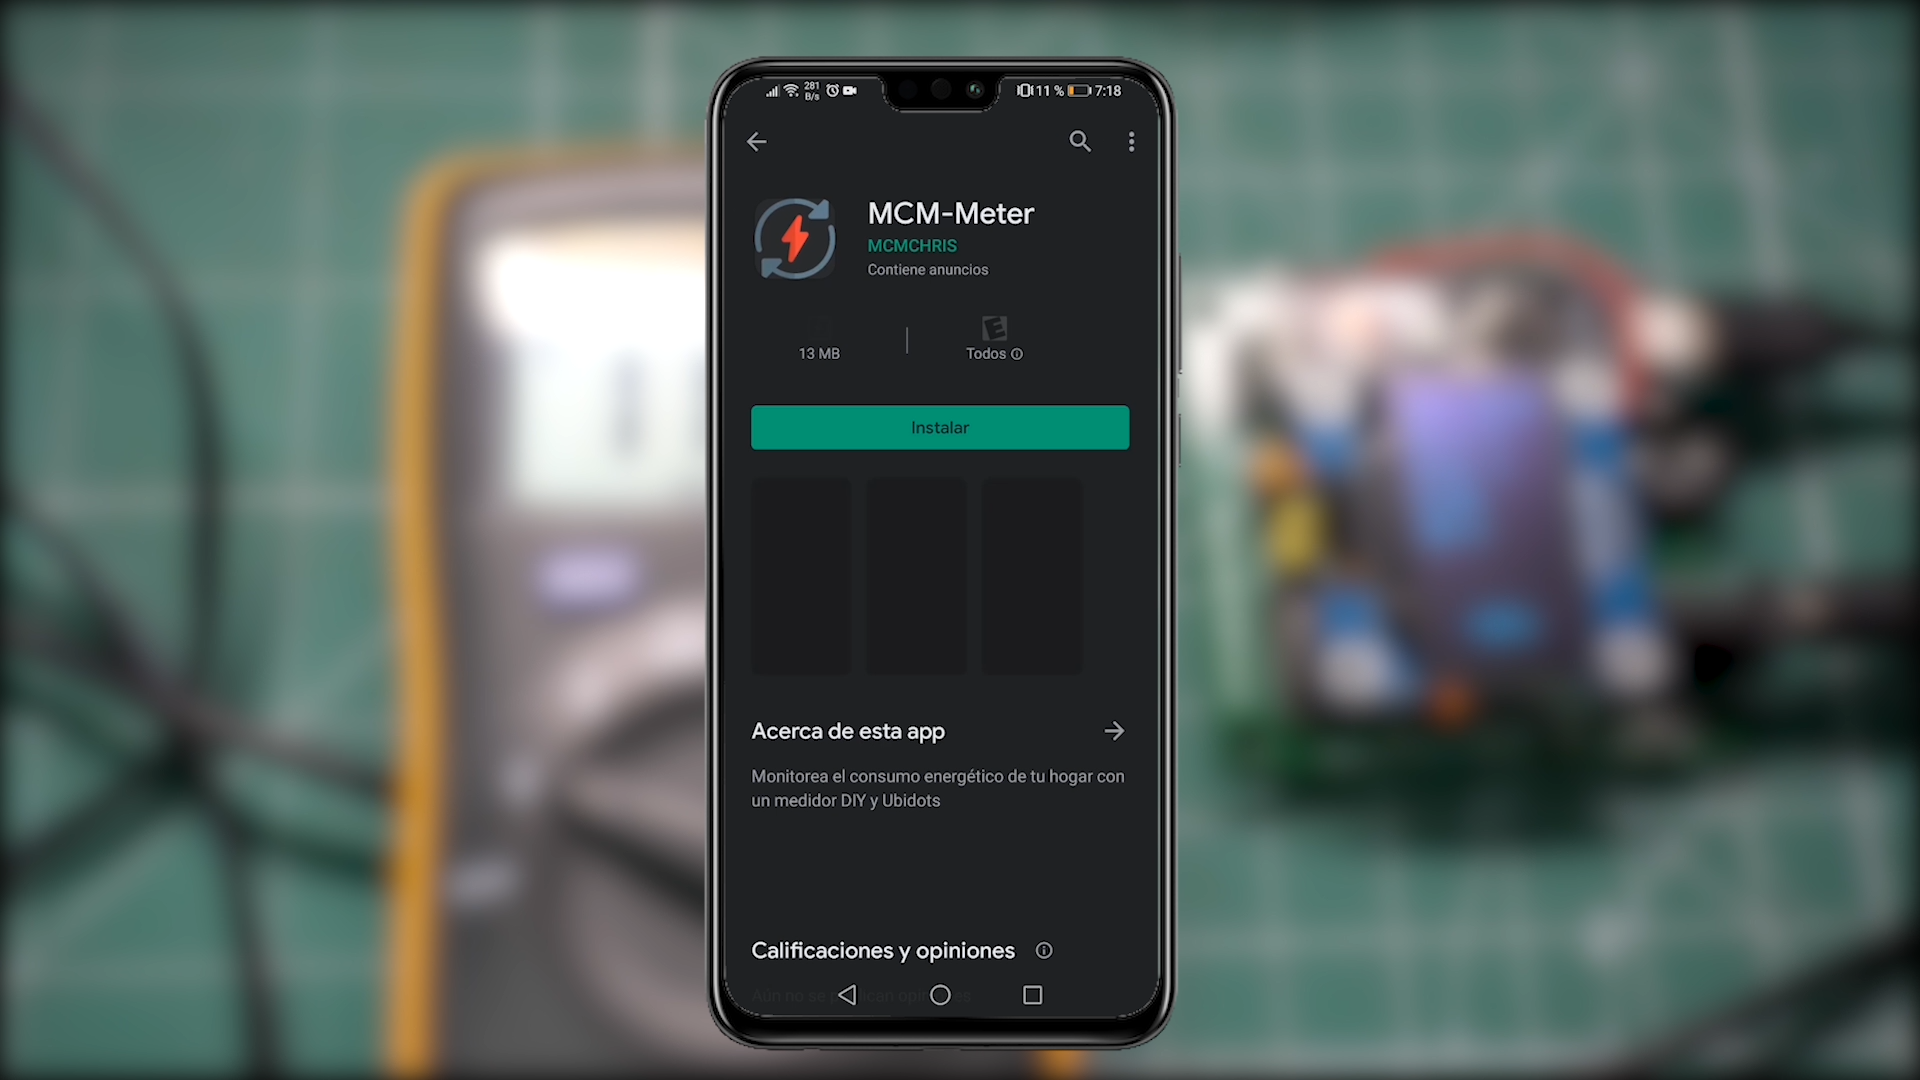
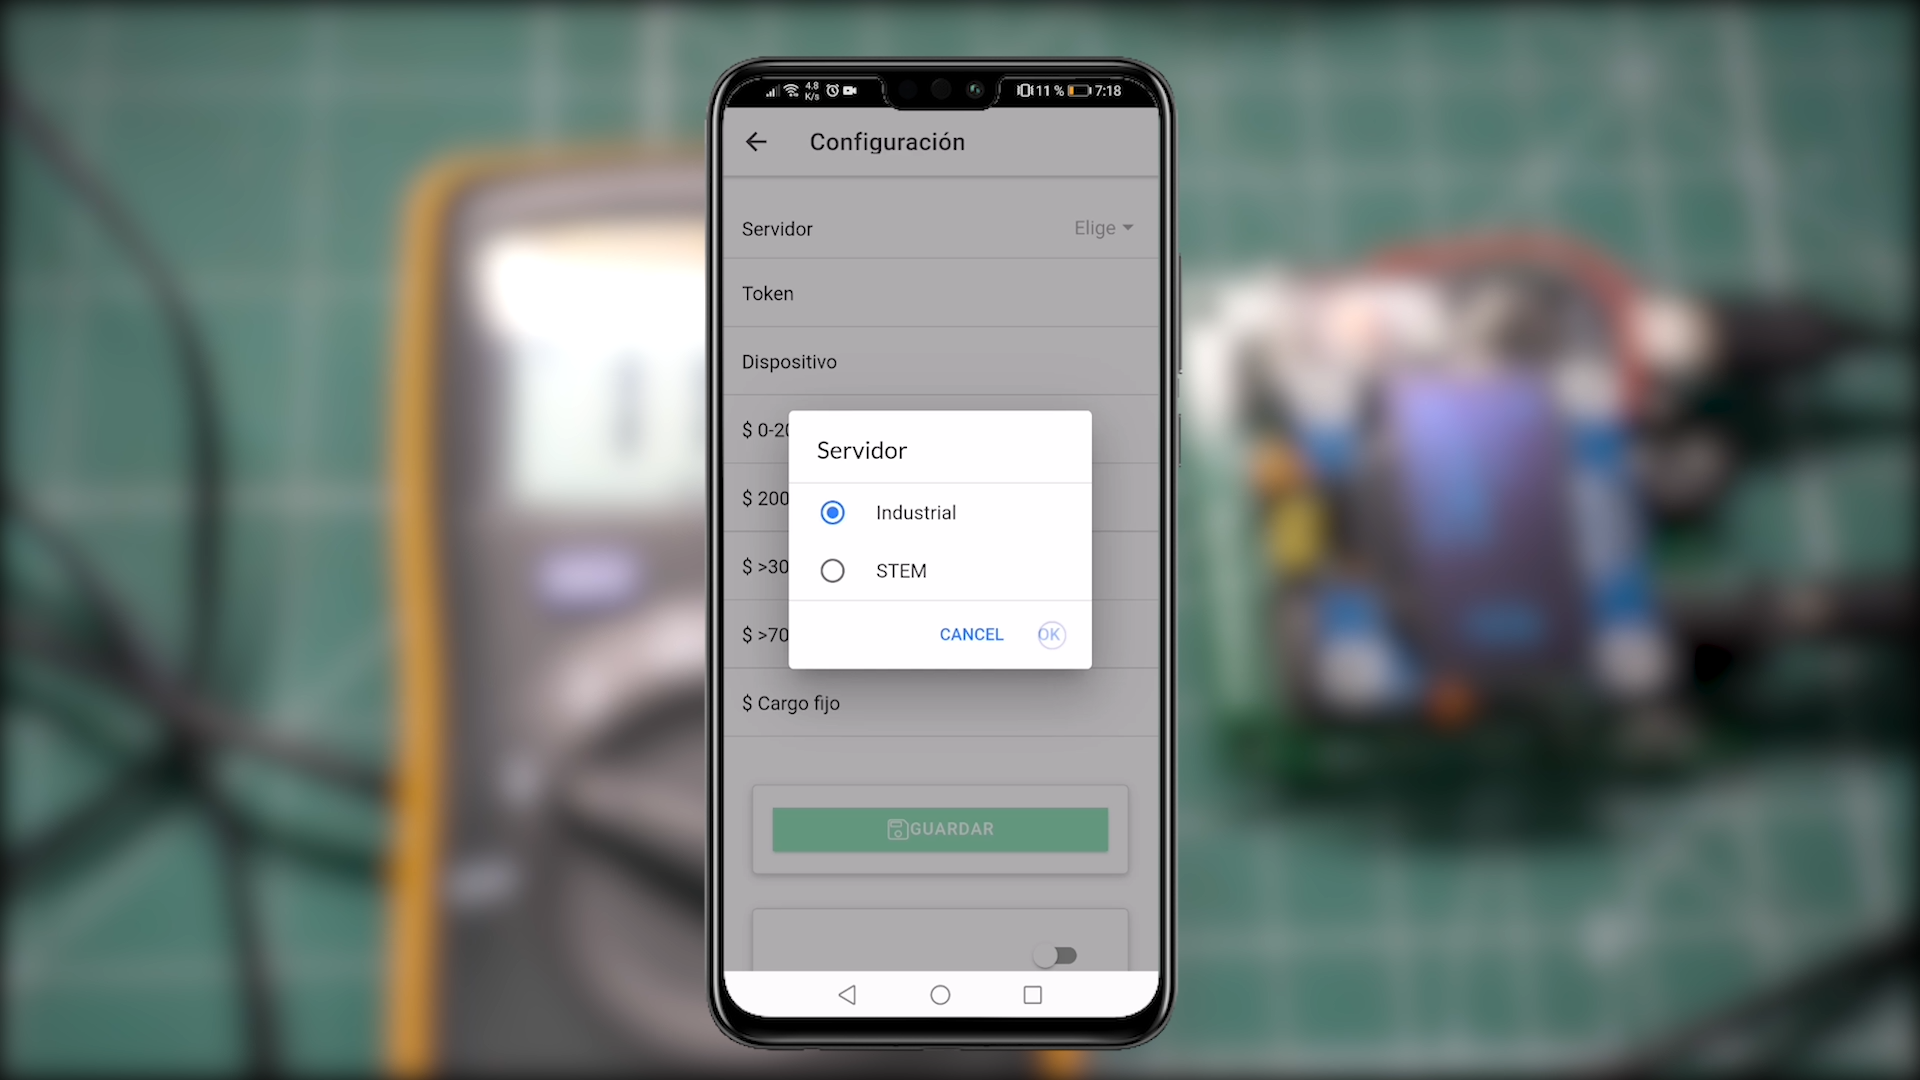
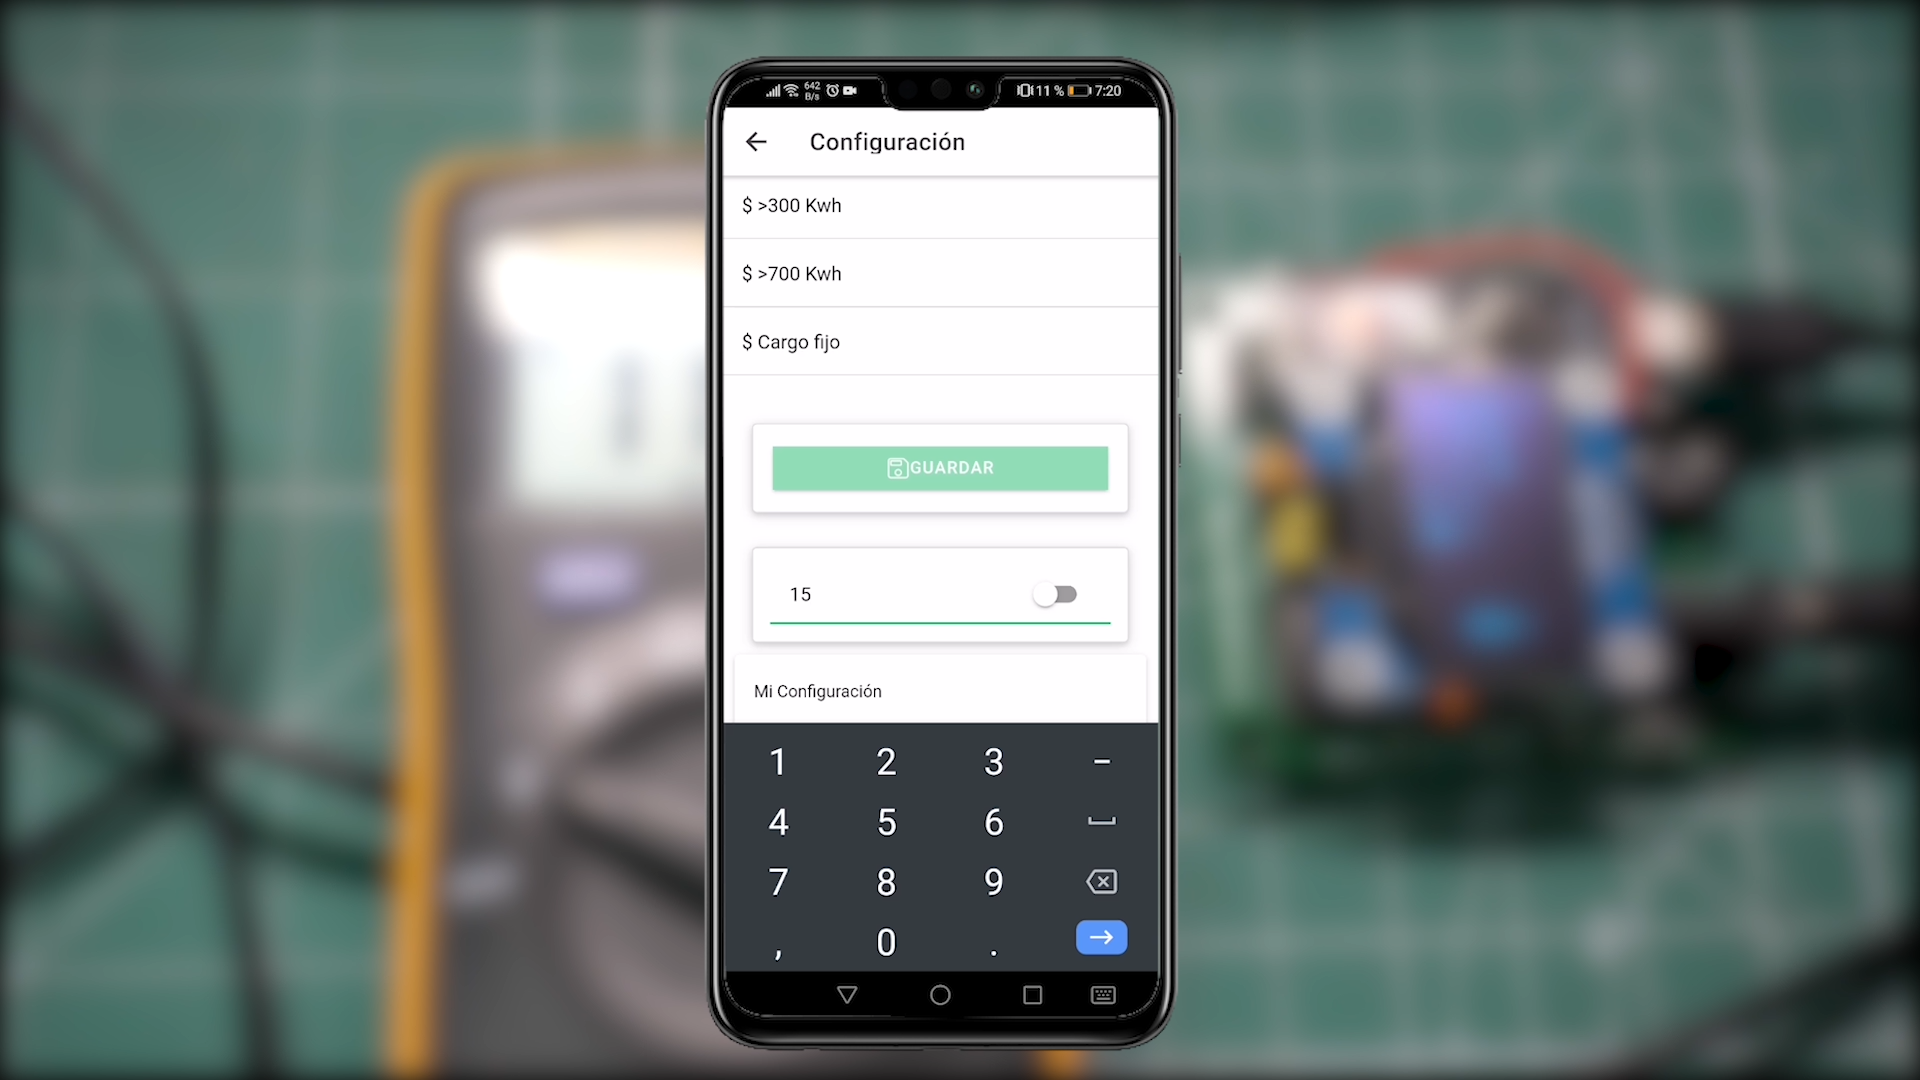
- Go to Google Play Store and install the app (Just for Android by now, Apple Developer Fee is high for me).
- Open it and it will show you a big blue button (Config), click on it.
- Select your Ubidots Plan.
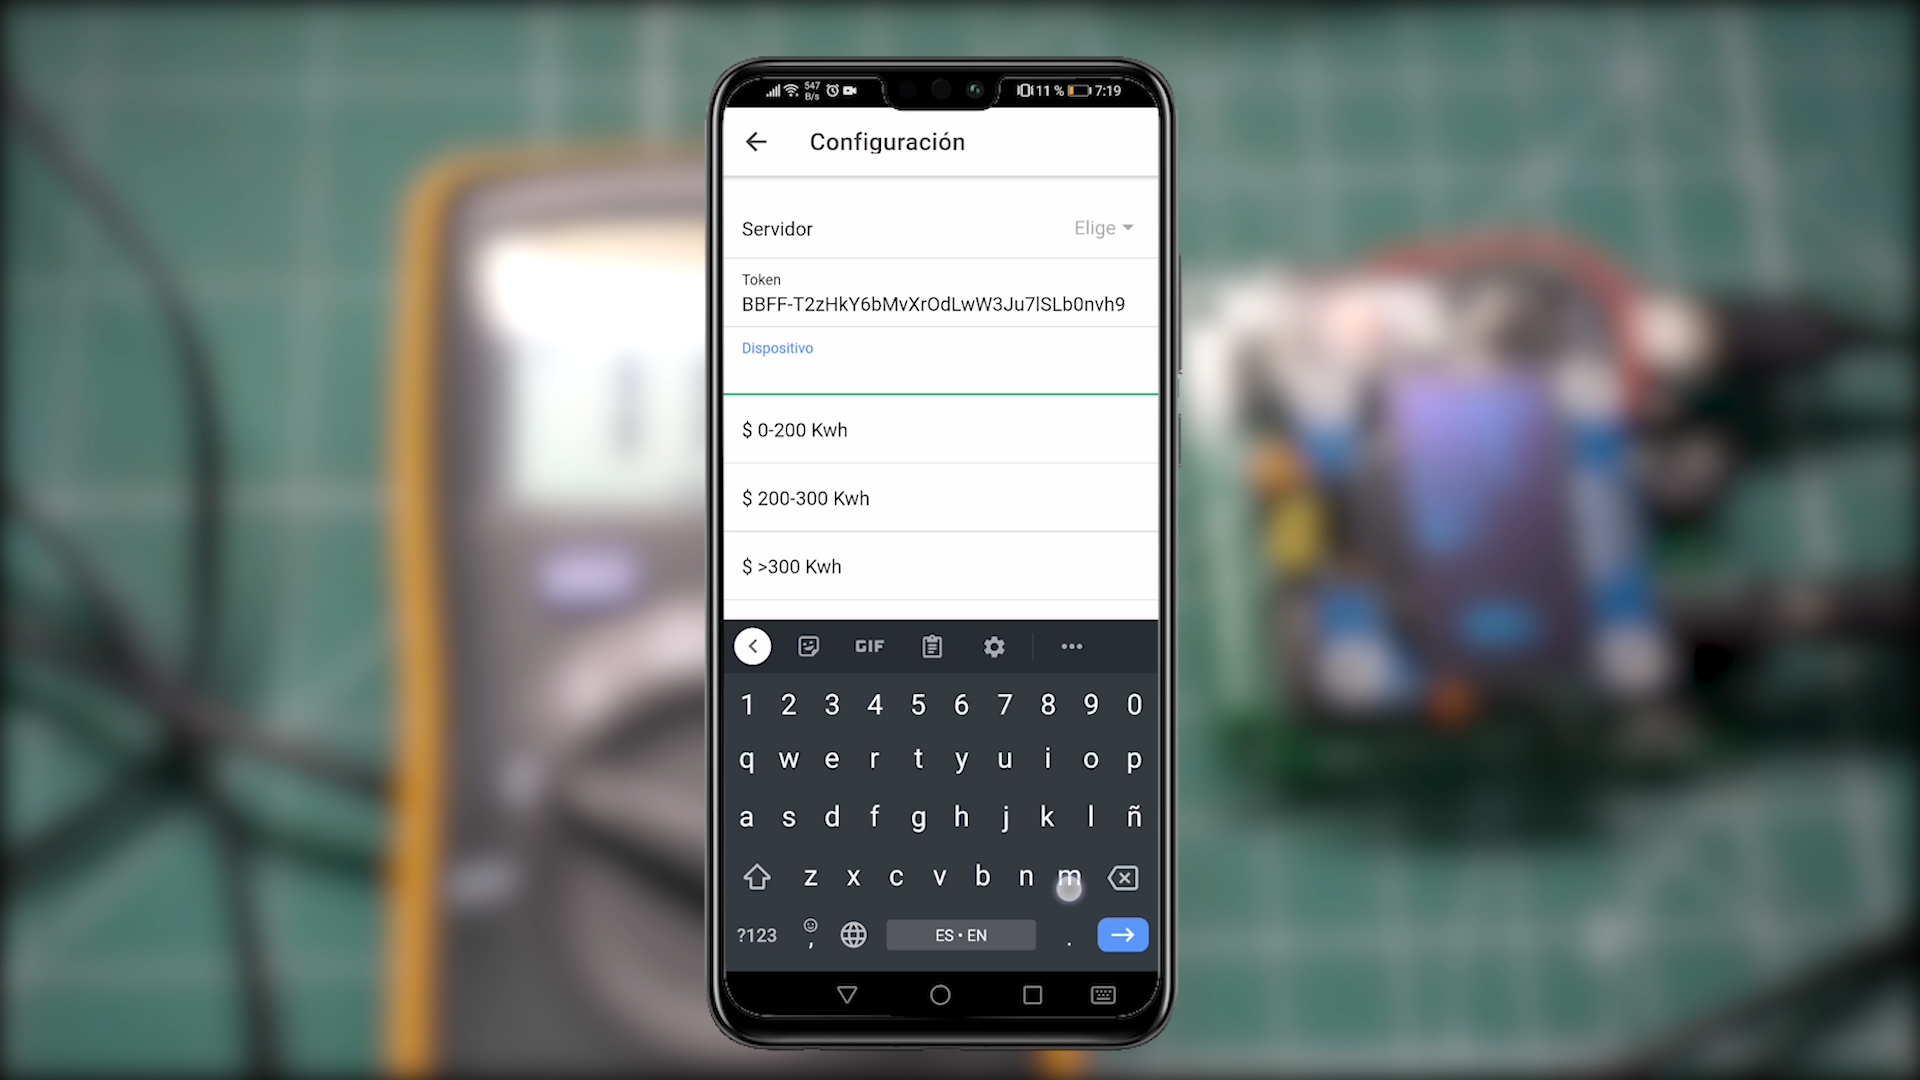
- Intro your Ubidots Token.
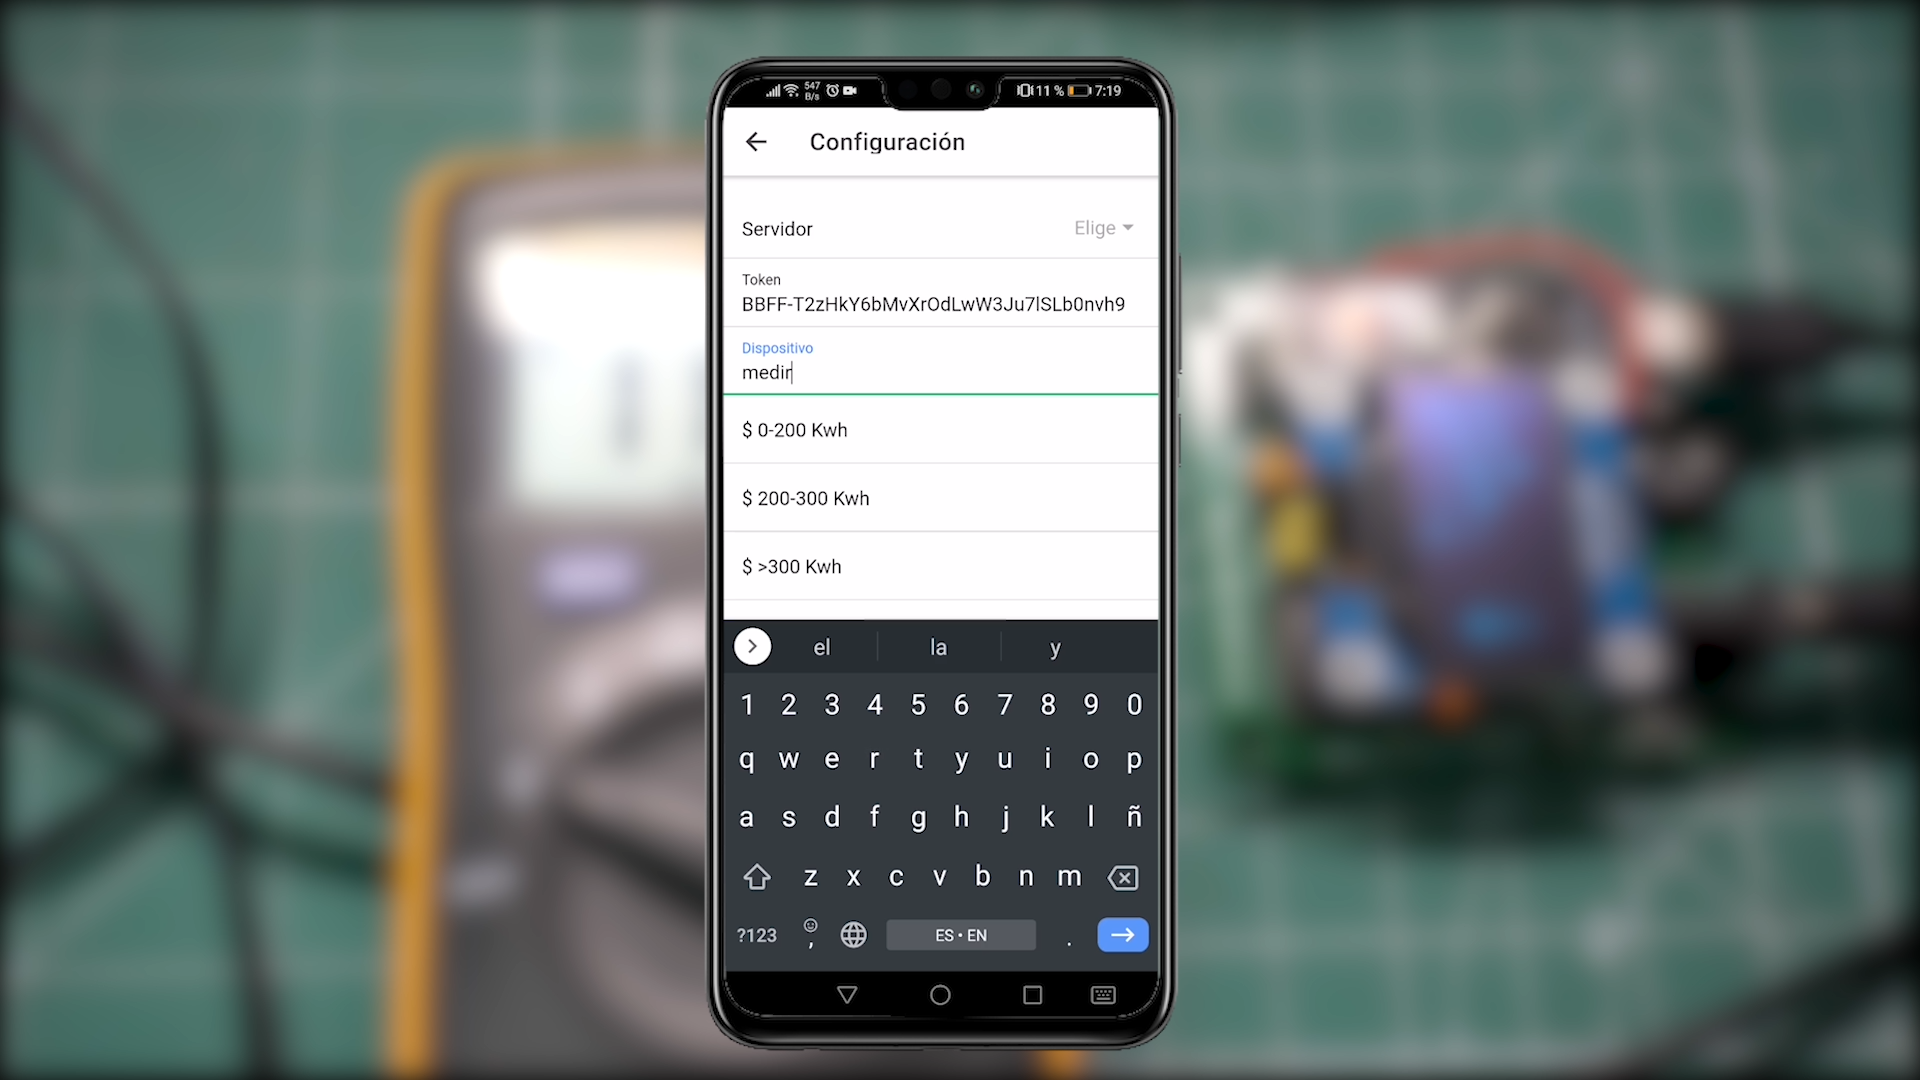
- Write the name of your device ("This device will be created automaticaly on Ubidots when you hit save button").
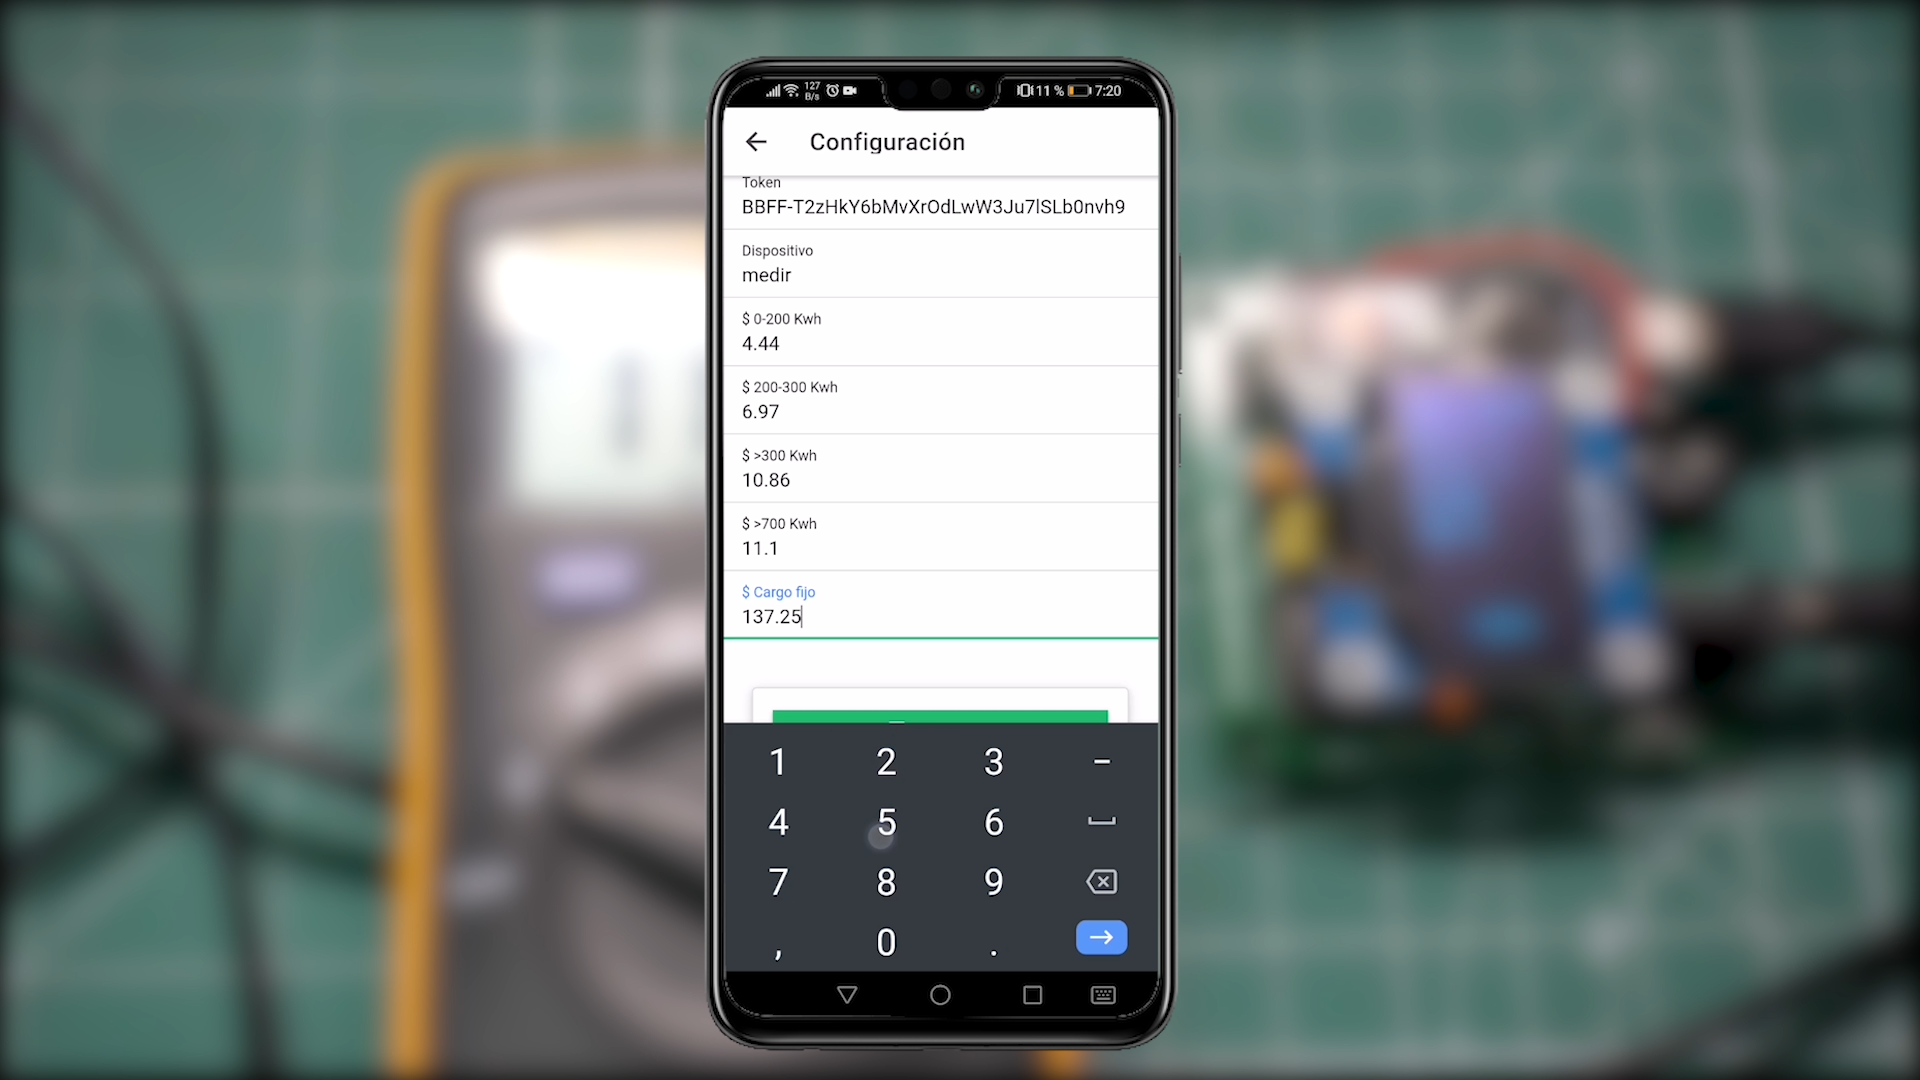
- Intro your Electric rates. (it's in dominican pesos by now because I don't know how other countries count your consumtion of energy, let me this in the comments about your country for an App Update).
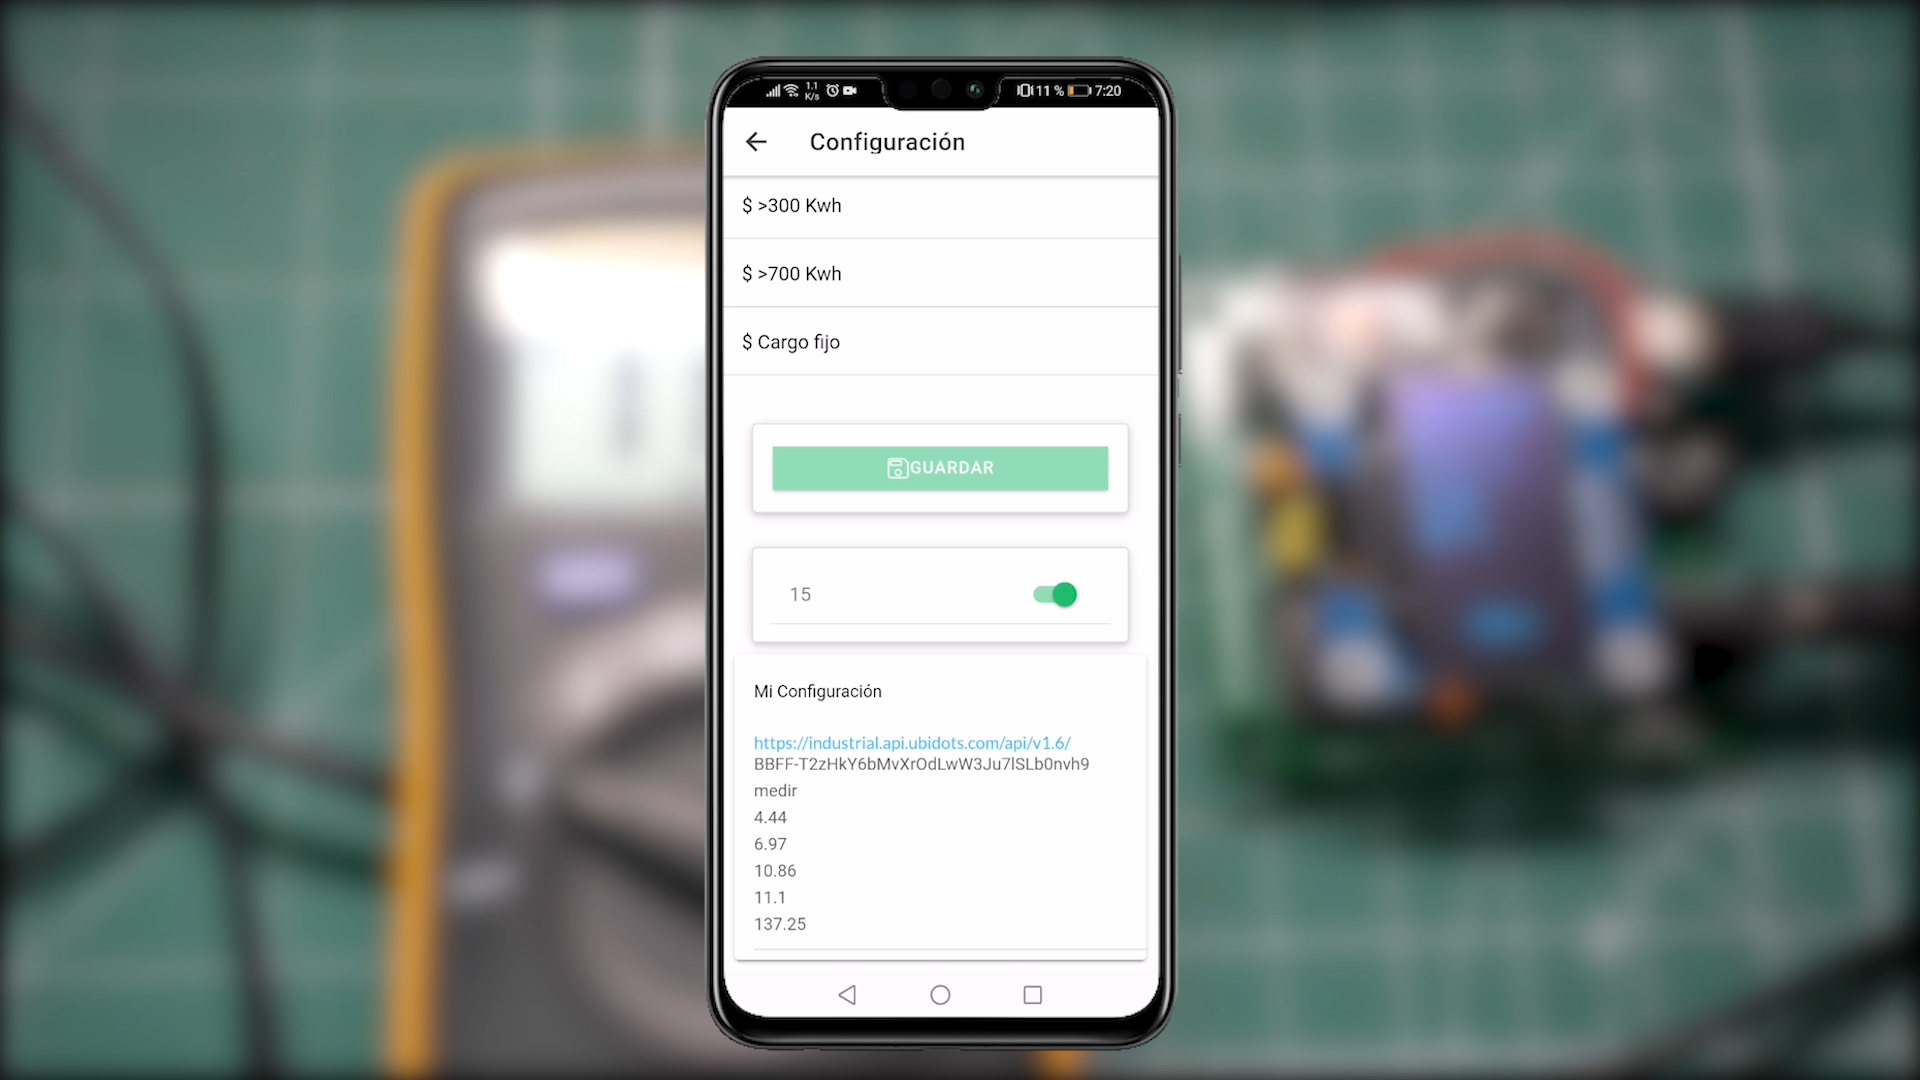
- Place the Alarm Kwhs number and activate the toggle button (when the energy used this day exceed this number, you will get a notification).
- You will be able to see all your configurations down in the screen, and you are able to change it or delete it swiping the configs to the left and clicking "delete".
Turning the Meter On
.png)
.png)
.png)
.png)
Before turning on the device, change the prog-use jumper to use mode.
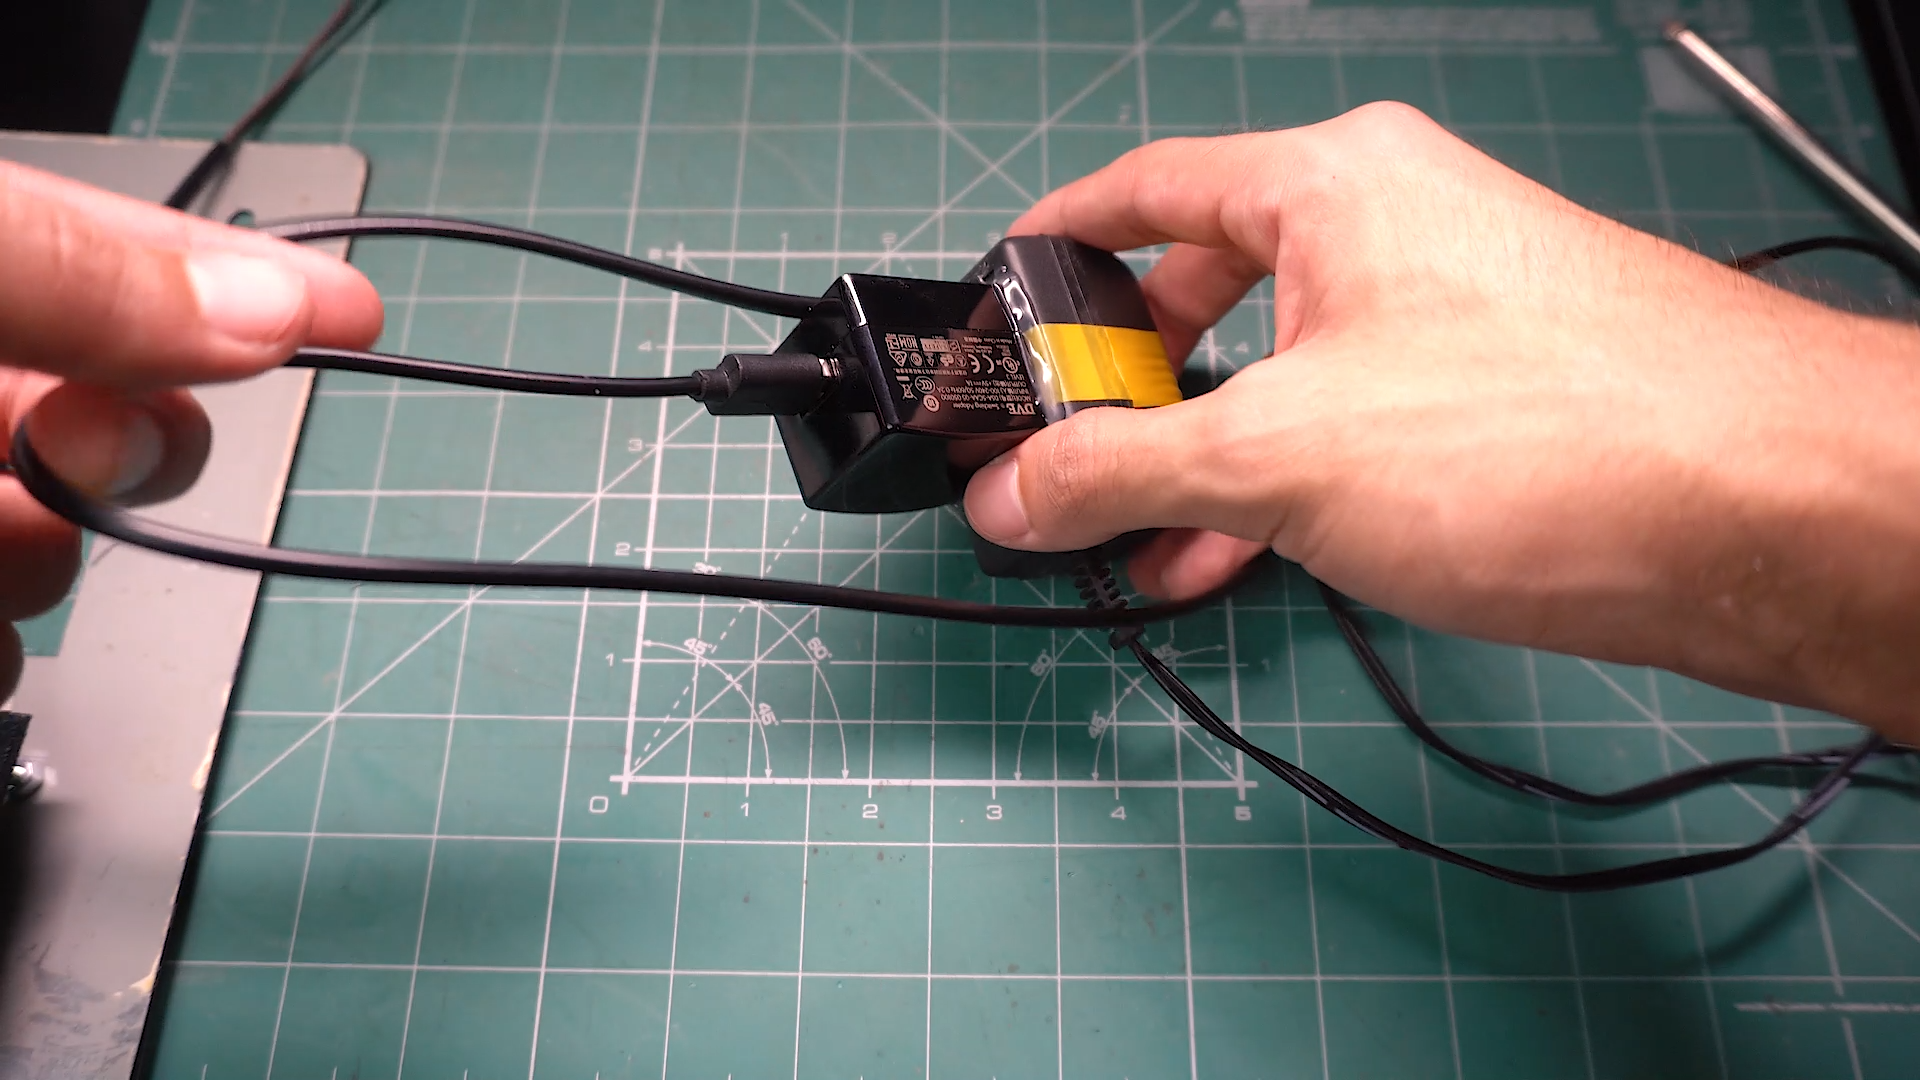
The board is powered by the micro usb arduino connector. (connect it to a 5v usb adapter).
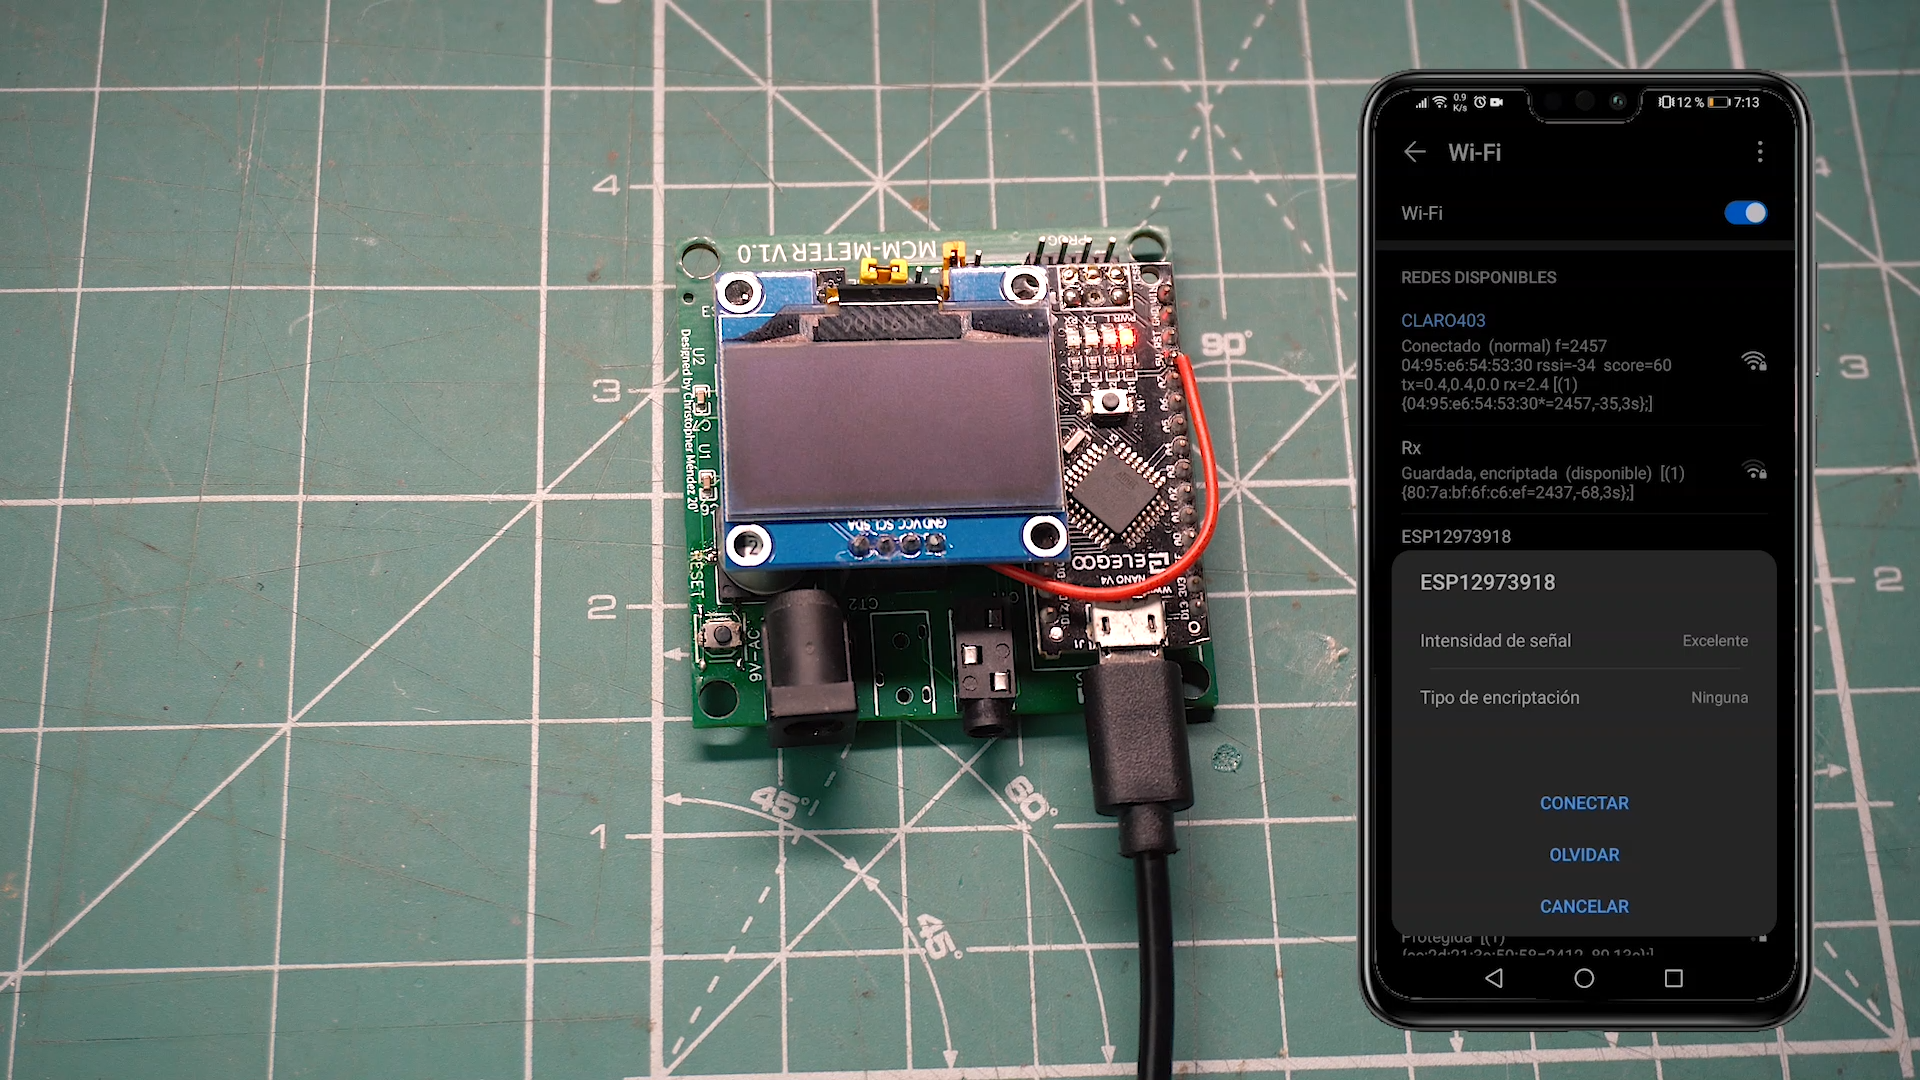
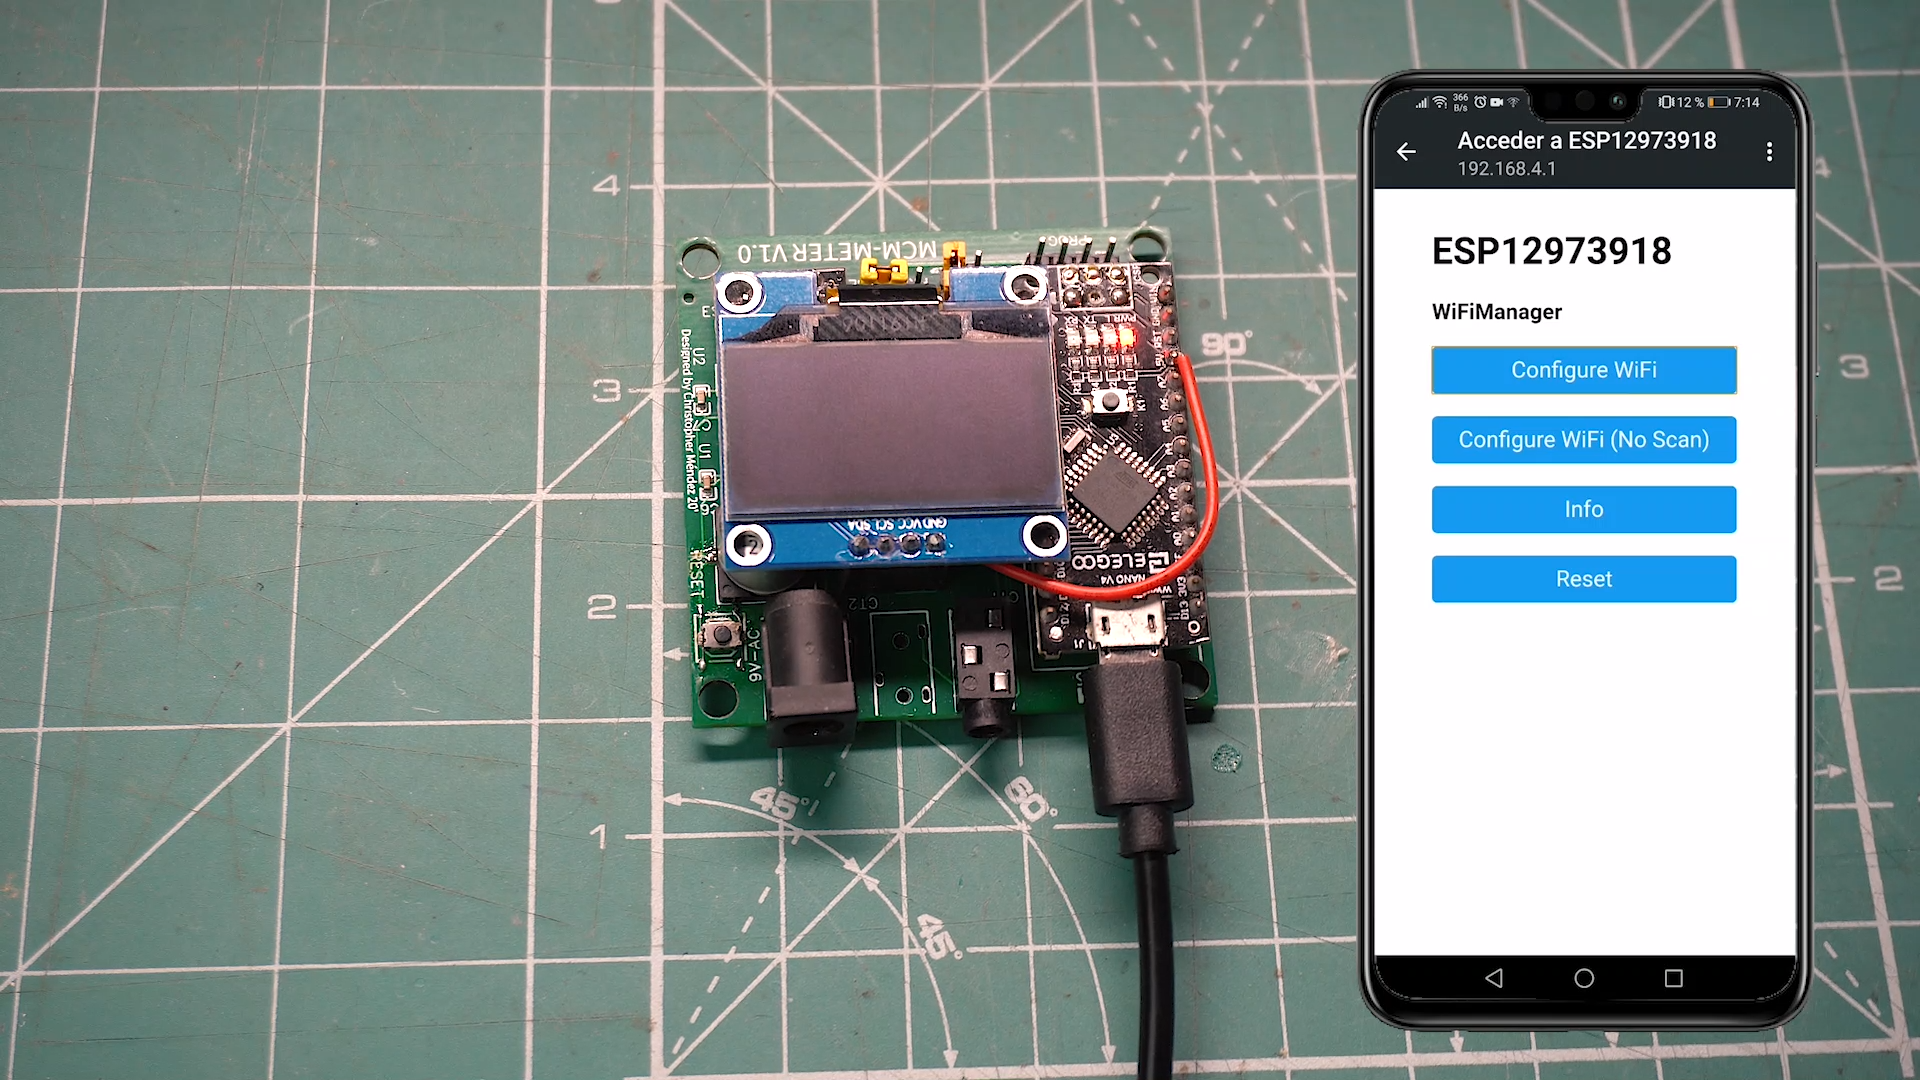
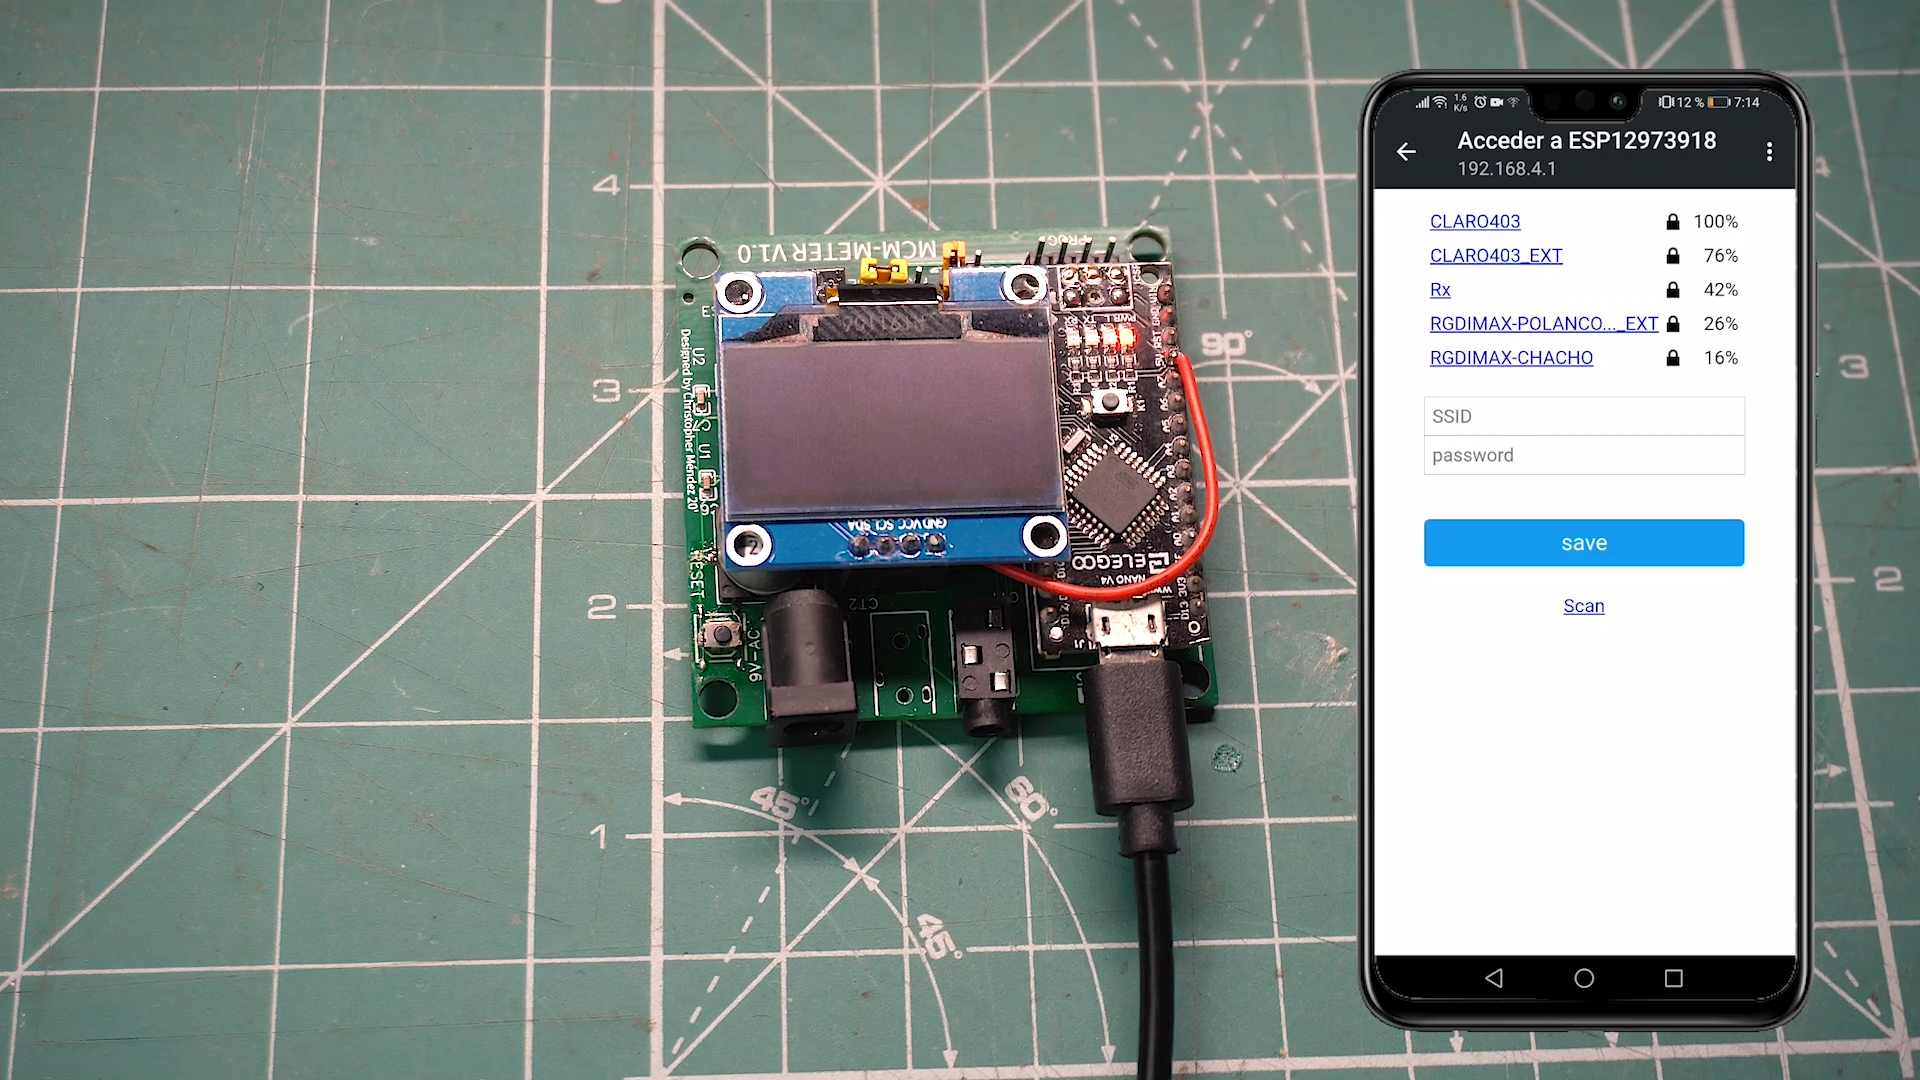
The board will automaticaly generate a Wifi network called ESP#######, click on it, and a WiFi manager will appear.
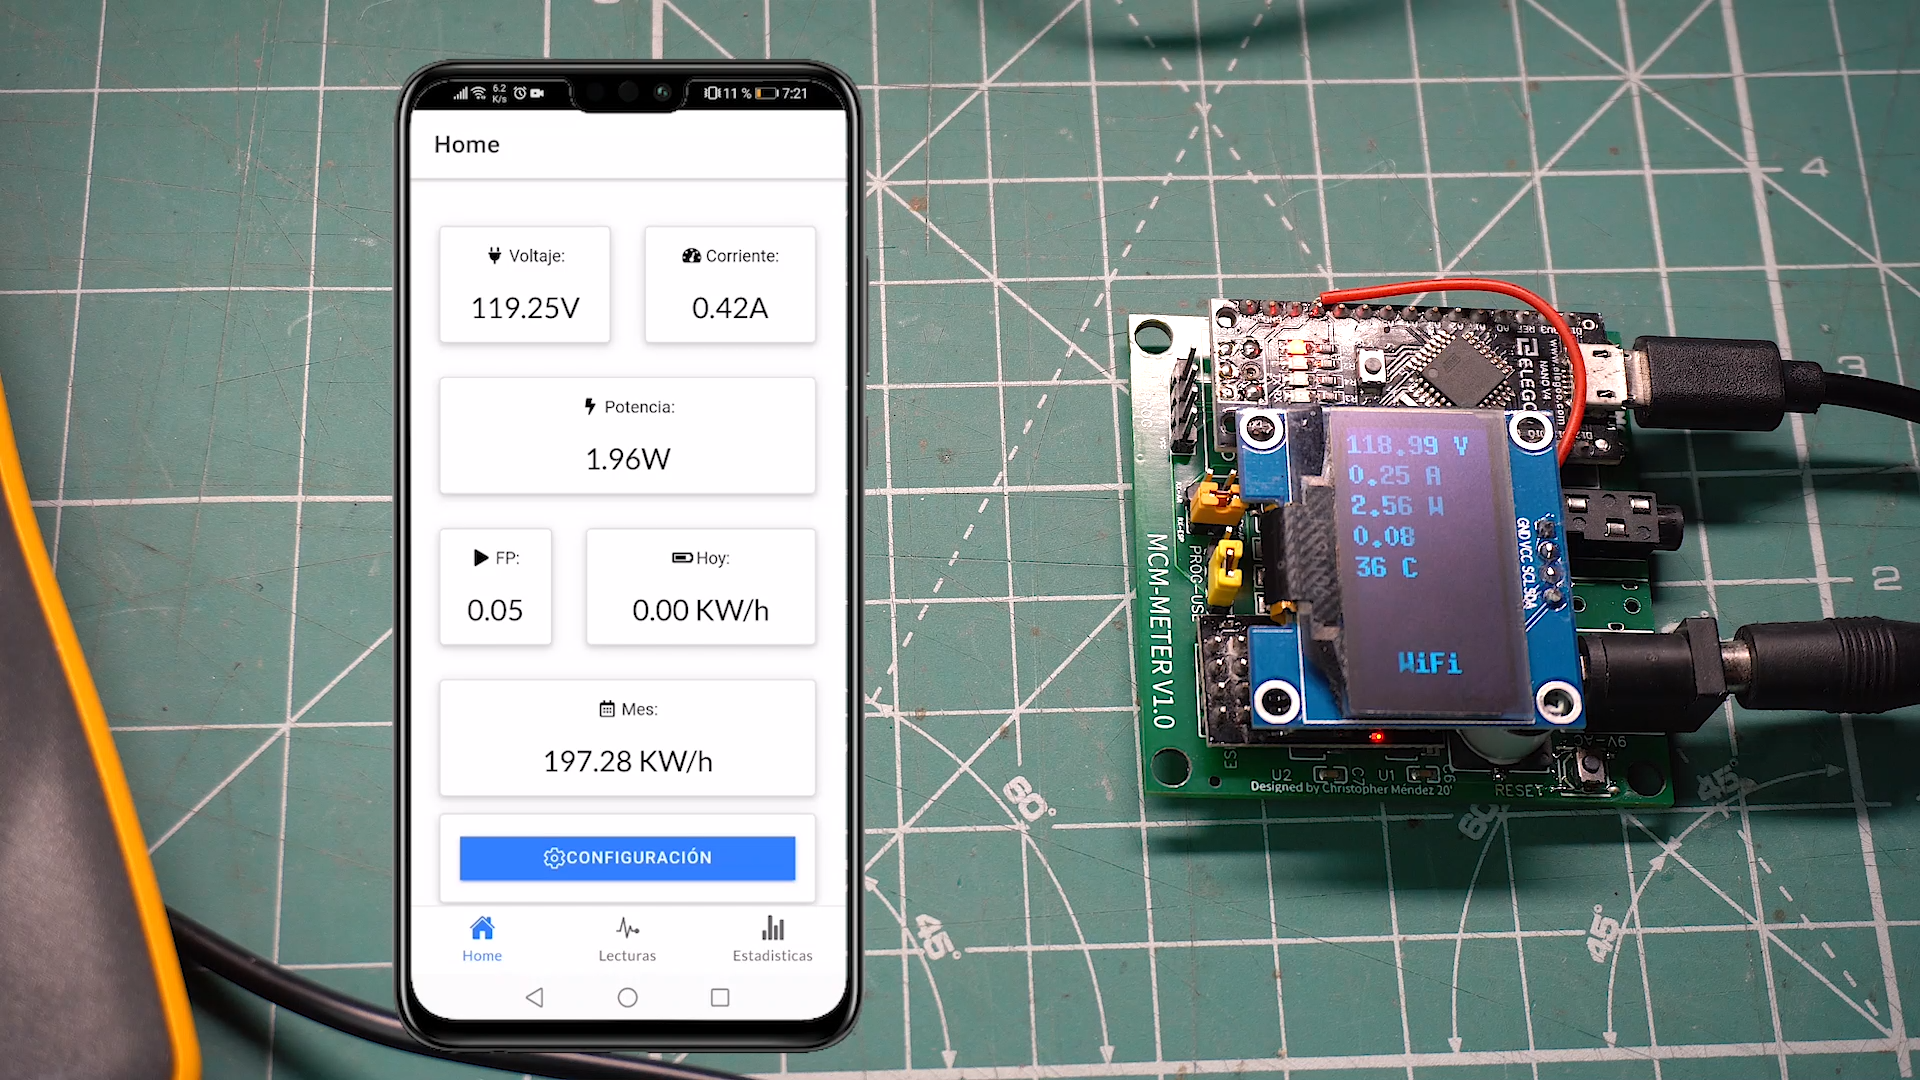
Scan and select your house network and you will be able to see that the screen will start showing data, and the App too.
They won't be real measurements because we don't have our sensors connected yet.
Placing the Device
.png)
.png)
.png)
.png)
.png)
.png)
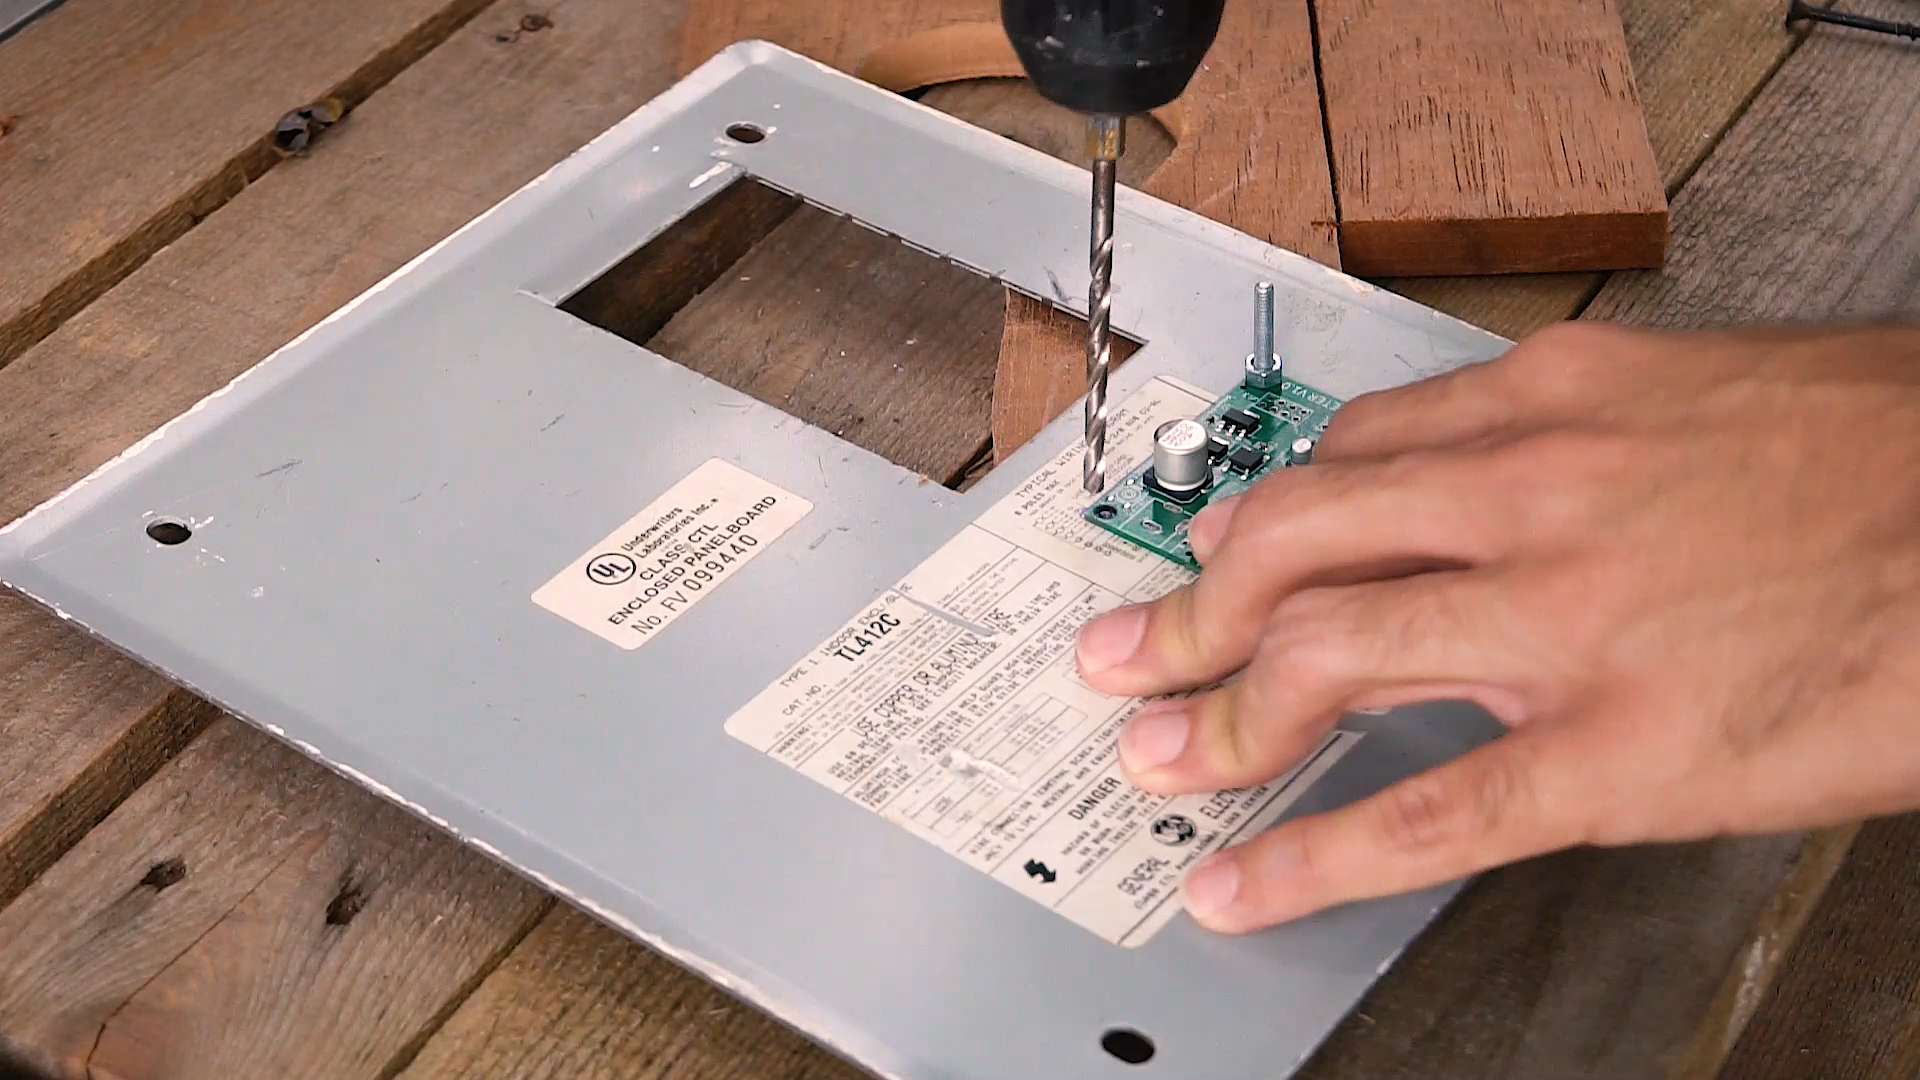
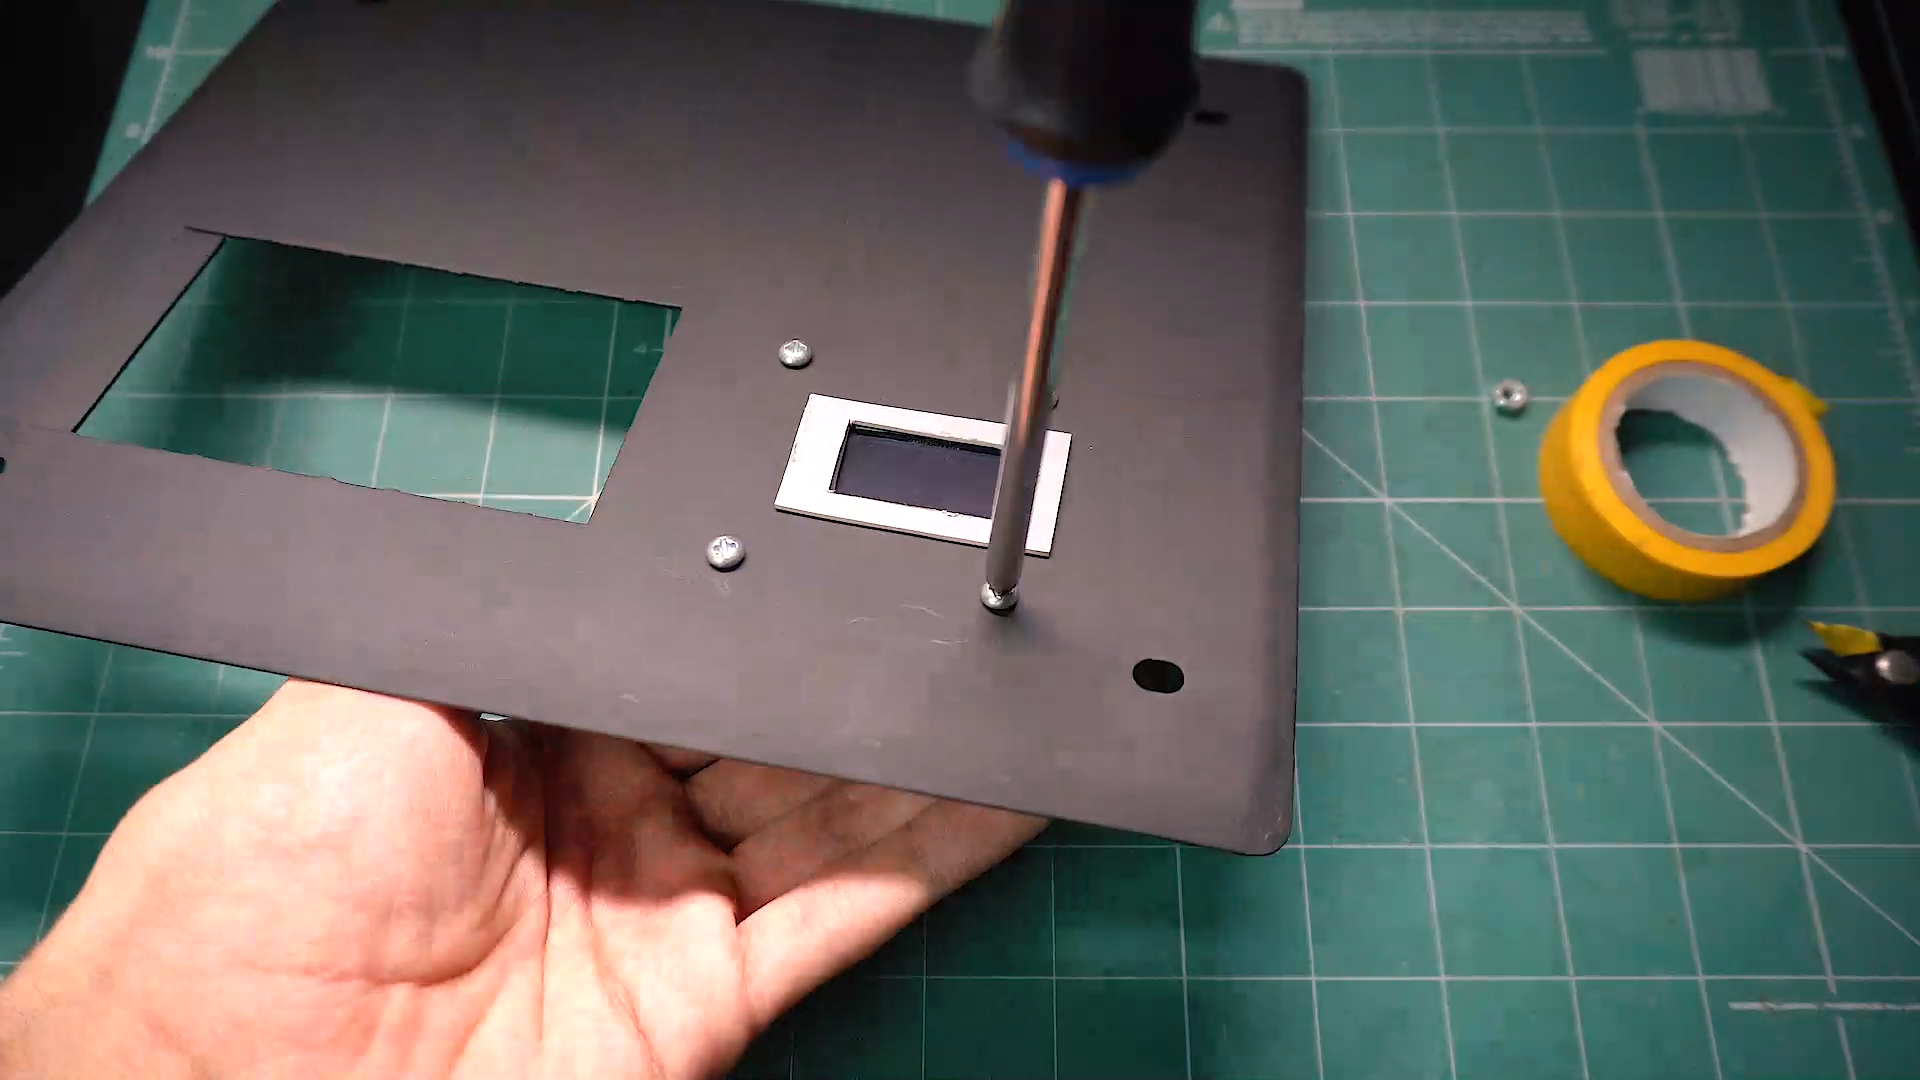
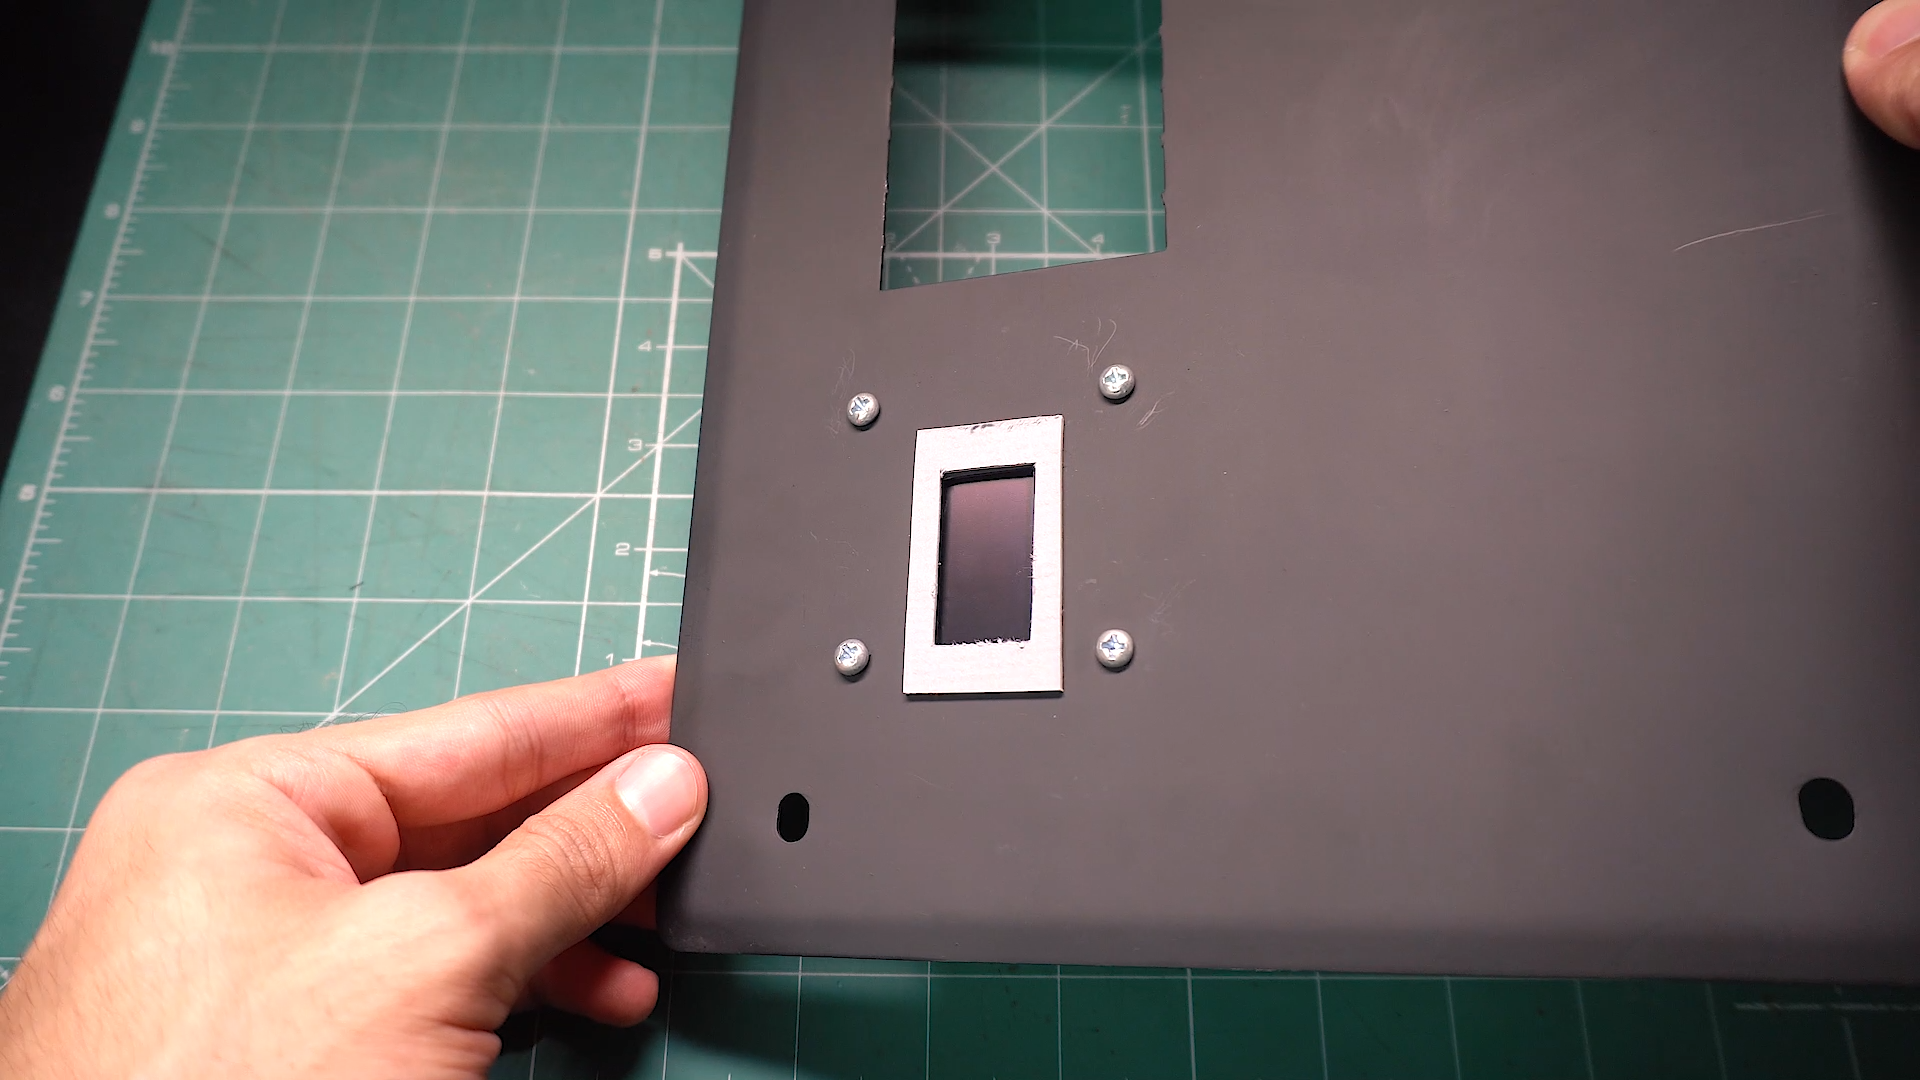
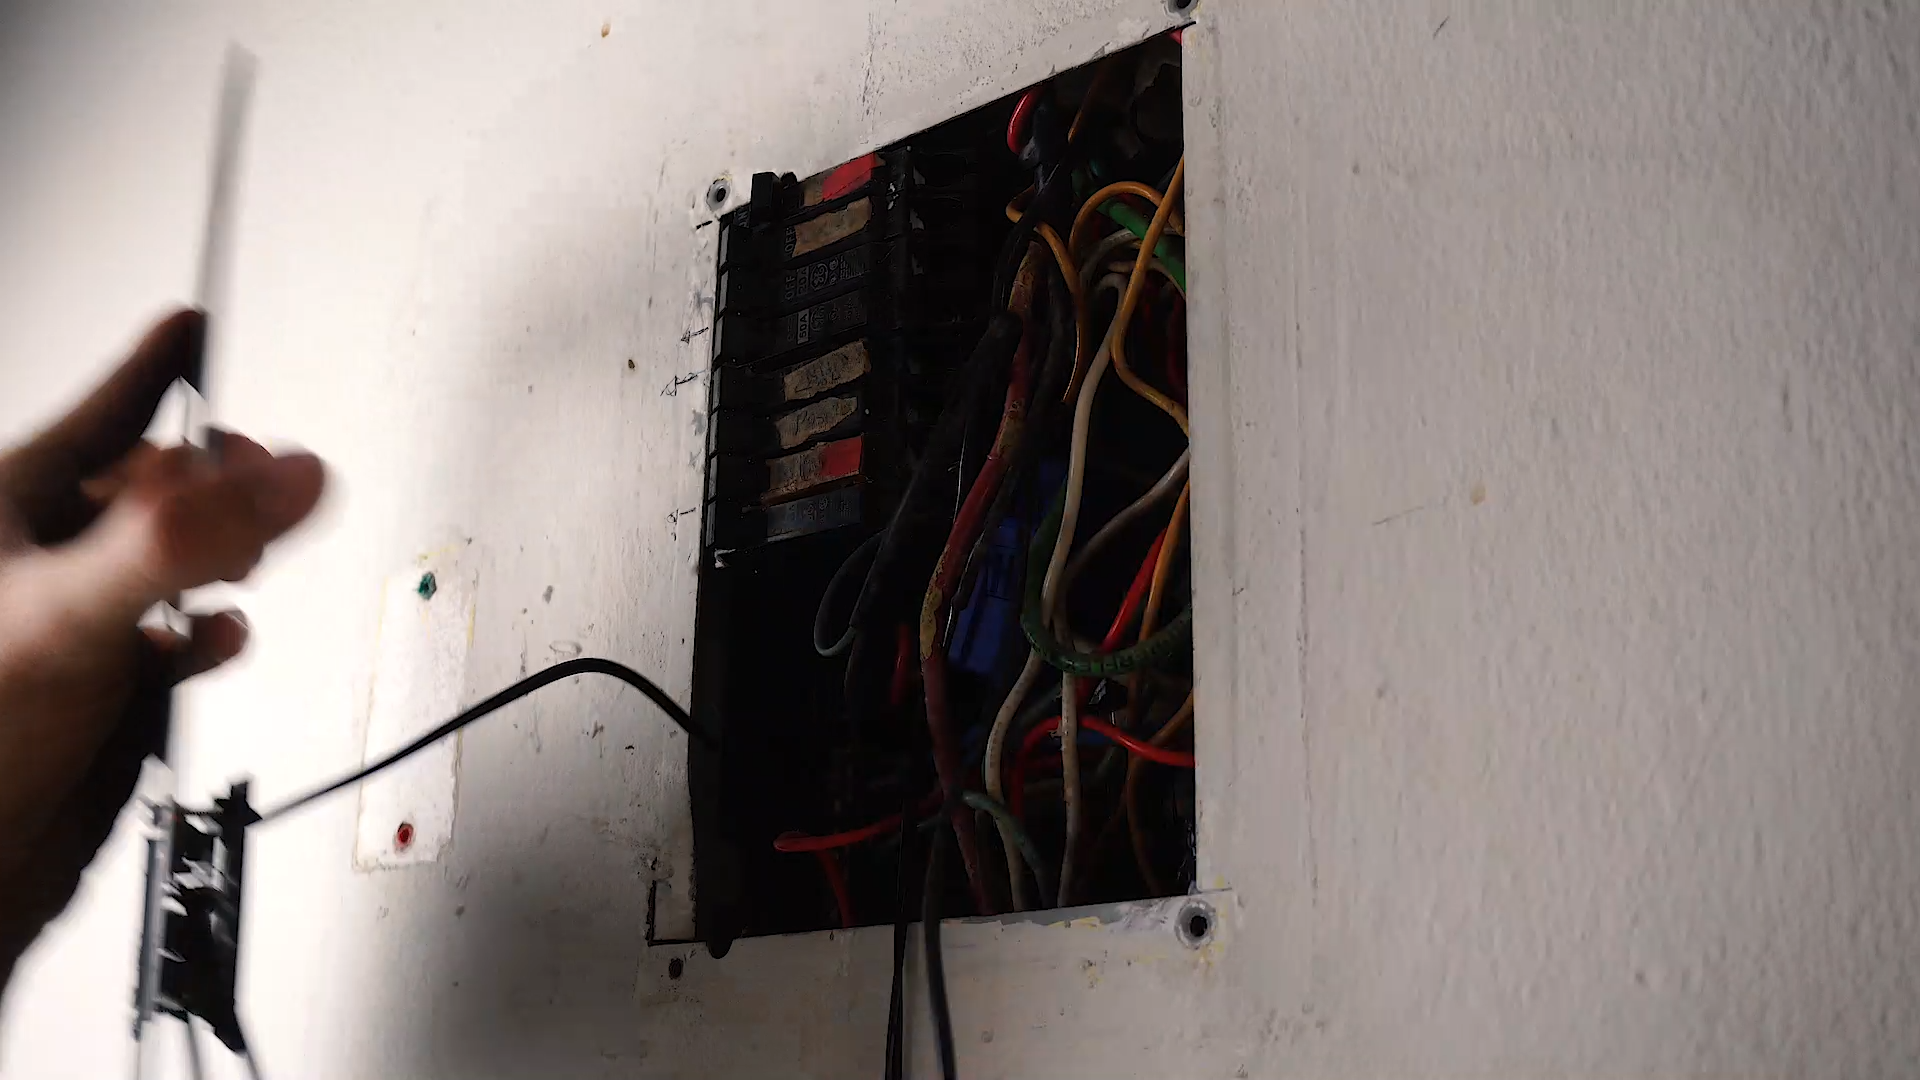
- Measure and drill some holes to the metal cover of the breakers panel.
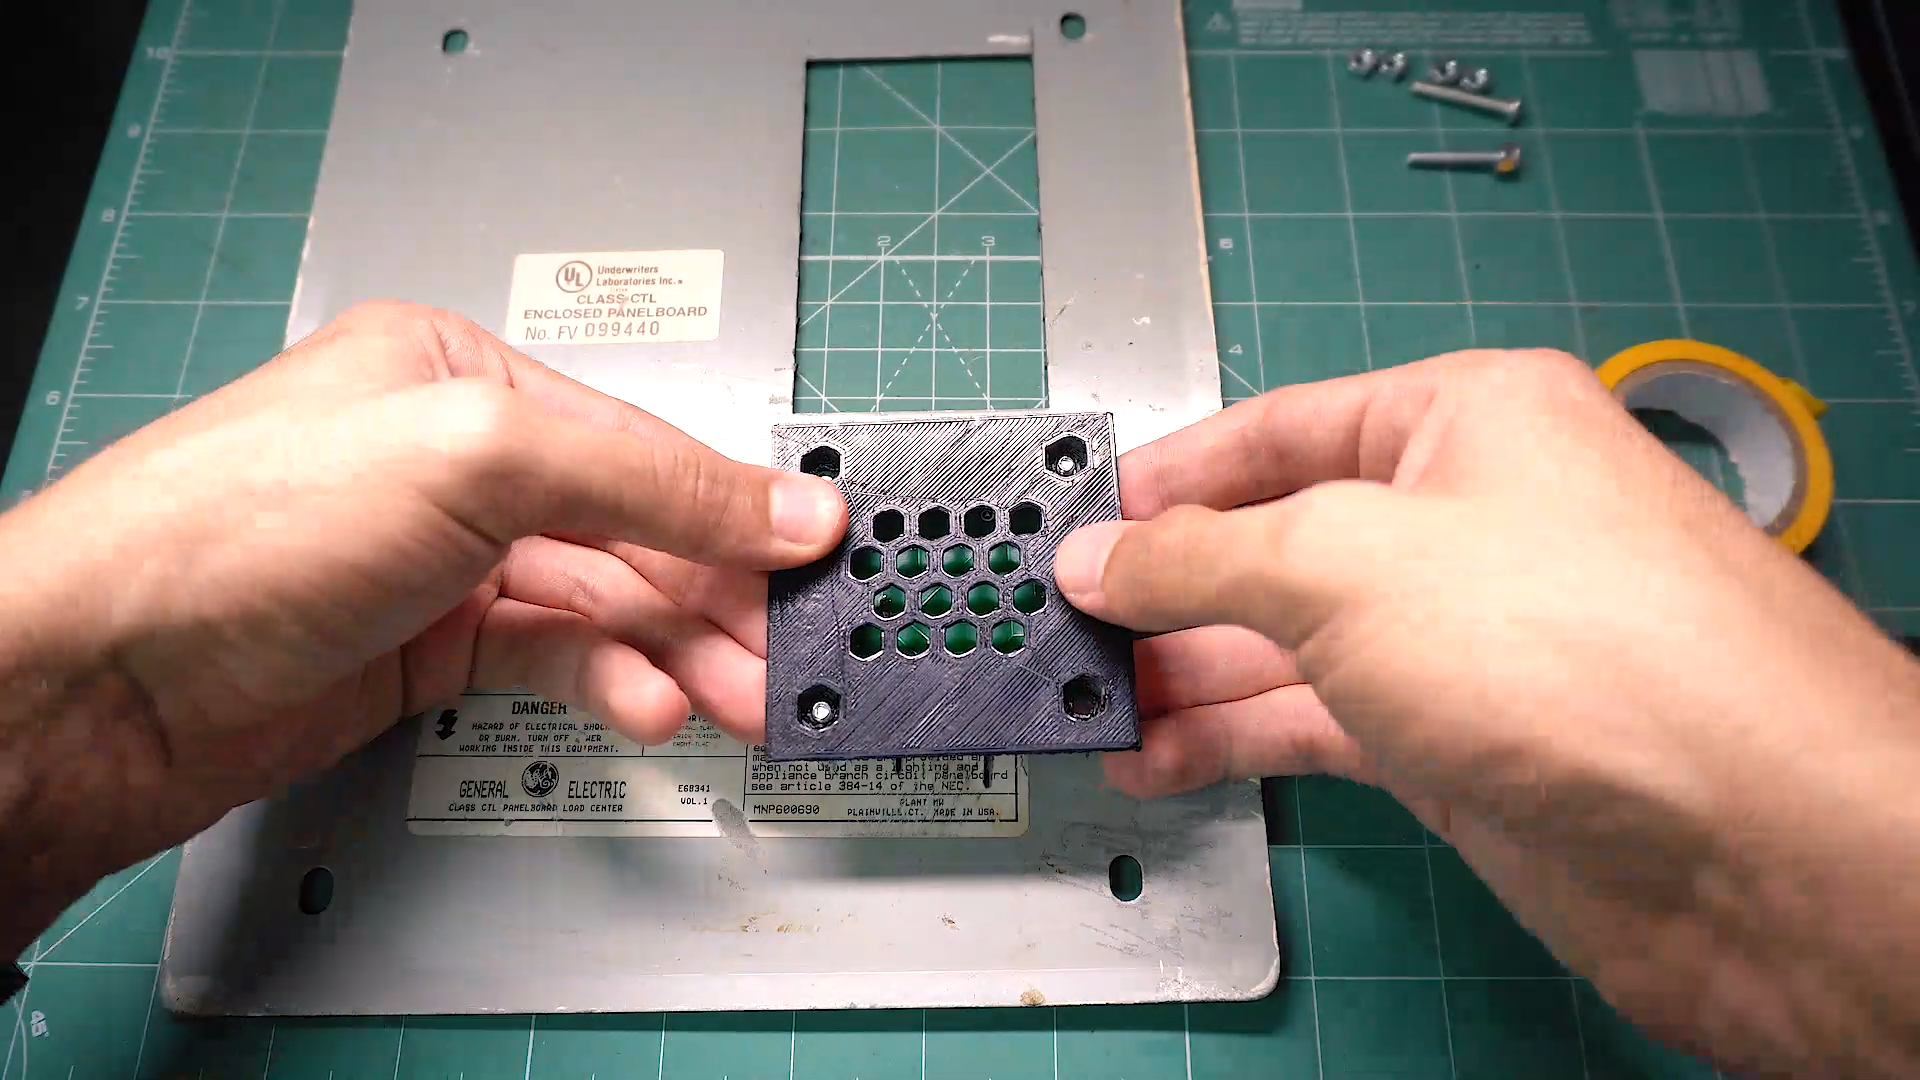
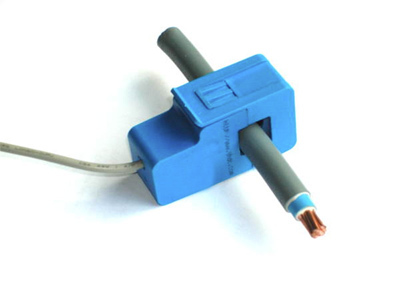
- Screw the board with the 3D printed protector, place the sensors inside the box and connect them to the board.
Ubidots Enviroment
.png)
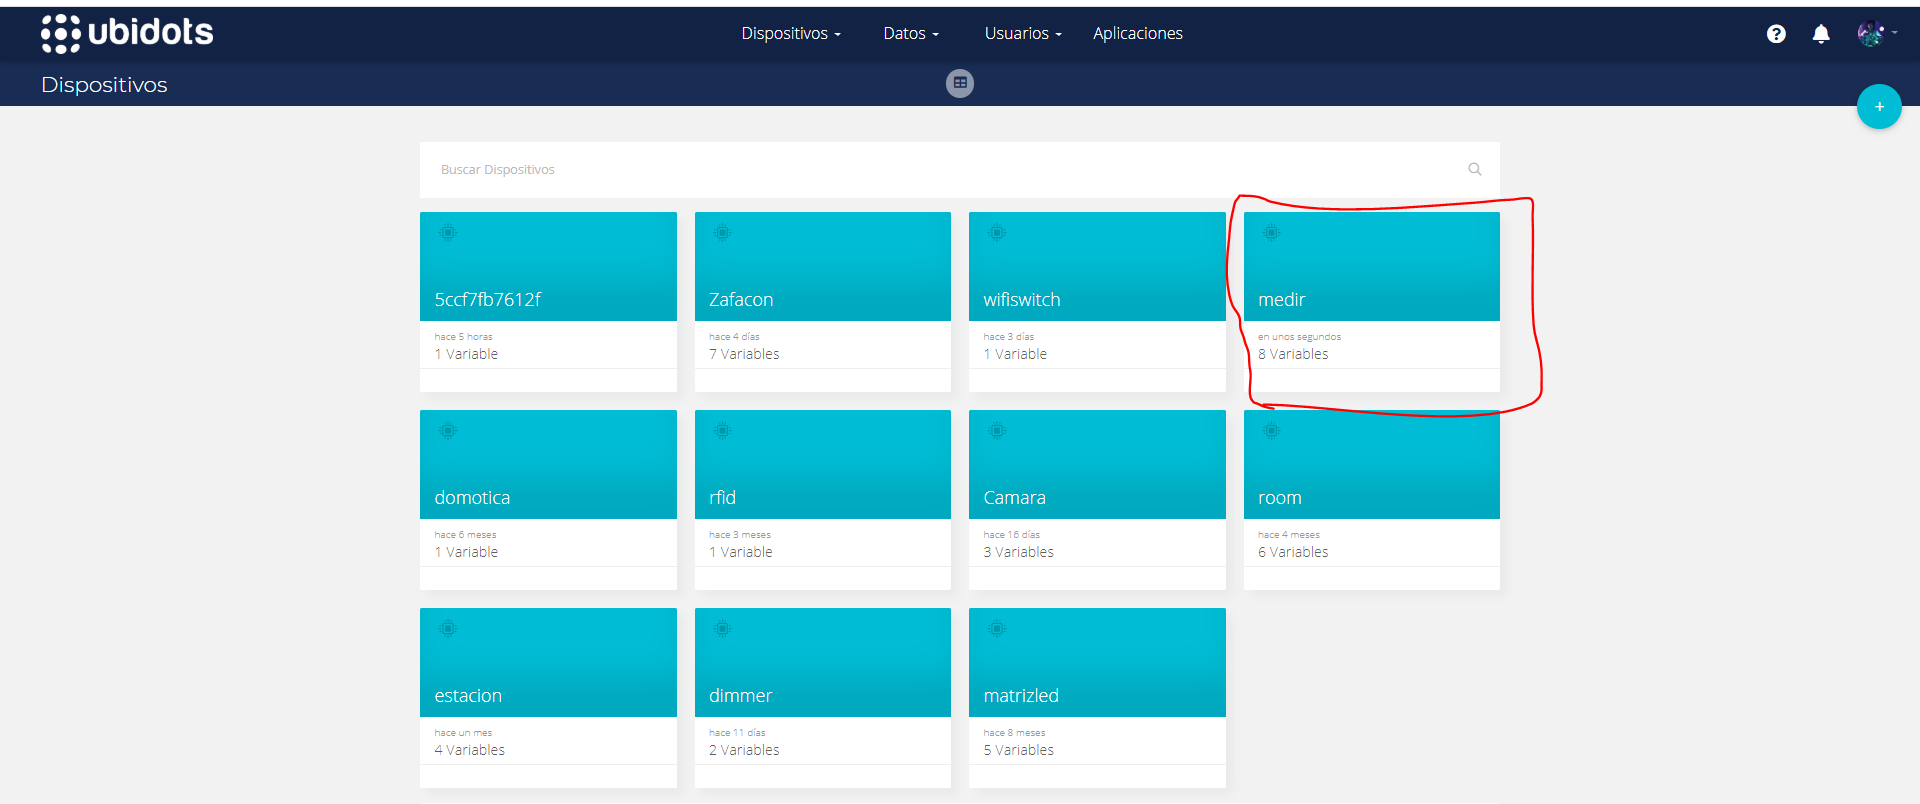
Once you have installed the app and set all your credentials, "TOKEN" and "Device Name".
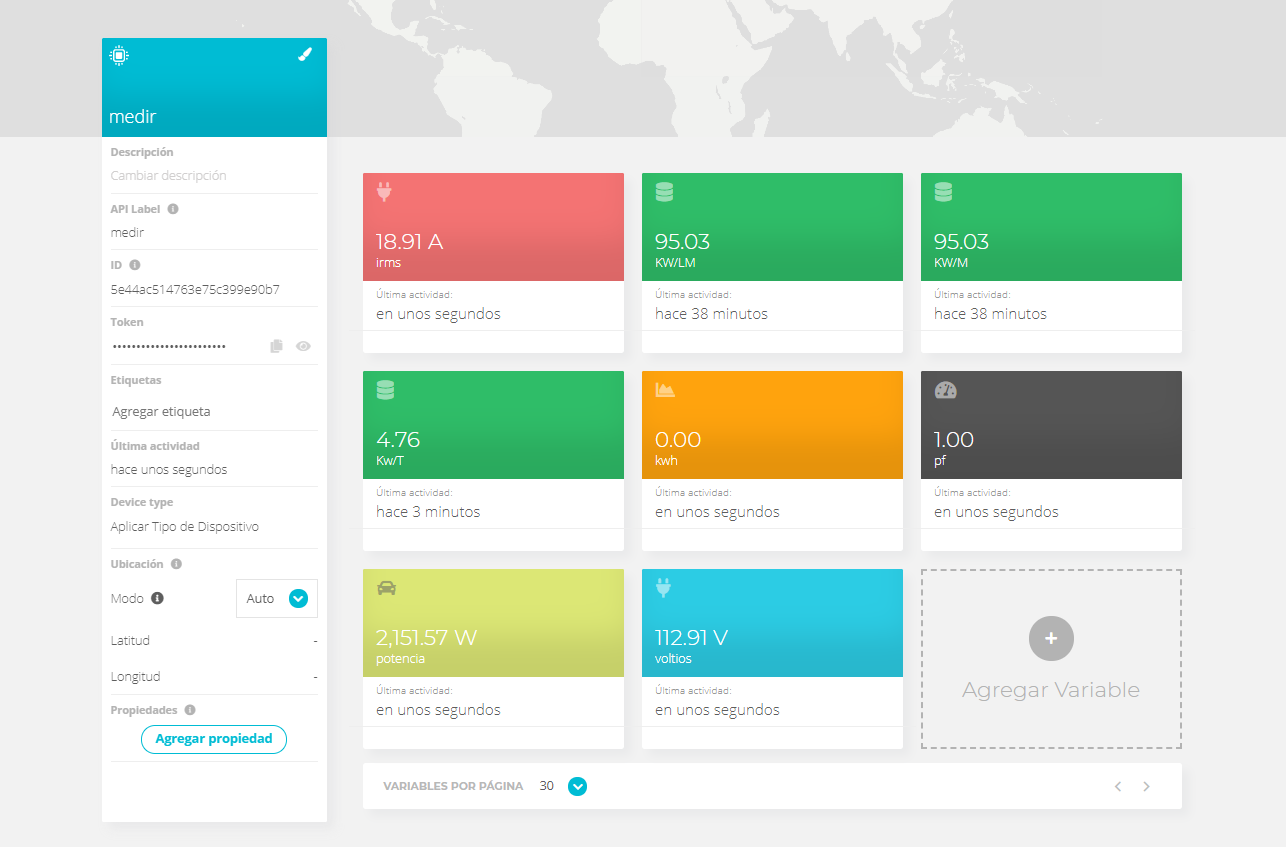
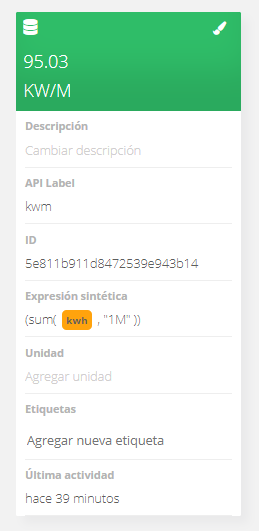
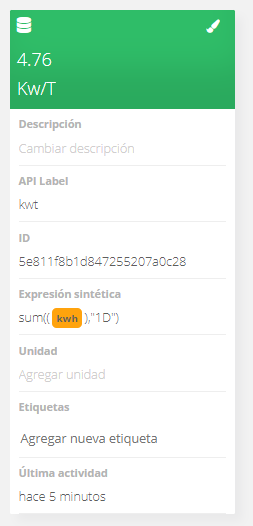
In your Ubidots device section will appear the device you called before and a bunch of 8 variables organized as you can see in the picture (It's important tha they are in this order).
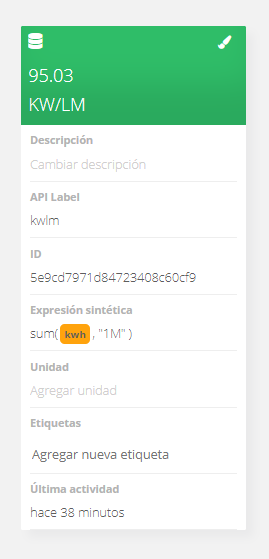
There are 3 especial variables, the Green ones, that won't be green in your screen, but you will need to click on them, take note of their "api label", delete them and click on "add variable" > "synthetic" > name it as the green ones I showed you, and in the synthetic expression textbox add the text you see in the pictures in the respective textbox.
For kwlm = sum( {{kwh}}, "1M" )
For kwm = sum( {{kwh}}, "1M" )
For kwt = sum( {{kwh}}, "1D")
Note if this changes mess up the order of the variables, please delete them all and start creating them in order:
- "irms" (Raw).
- "kwlm" (synthetic). = sum( {{kwh}}, "1M" )
- "kwm" (synthetic). = sum( {{kwh}}, "1M" )
- "kwt" (synthetic). sum( {{kwh}}, "1D")
- "kwh" (Raw).
- "pf" (Raw).
- "potencia" (Raw).
- "voltios" (Raw).
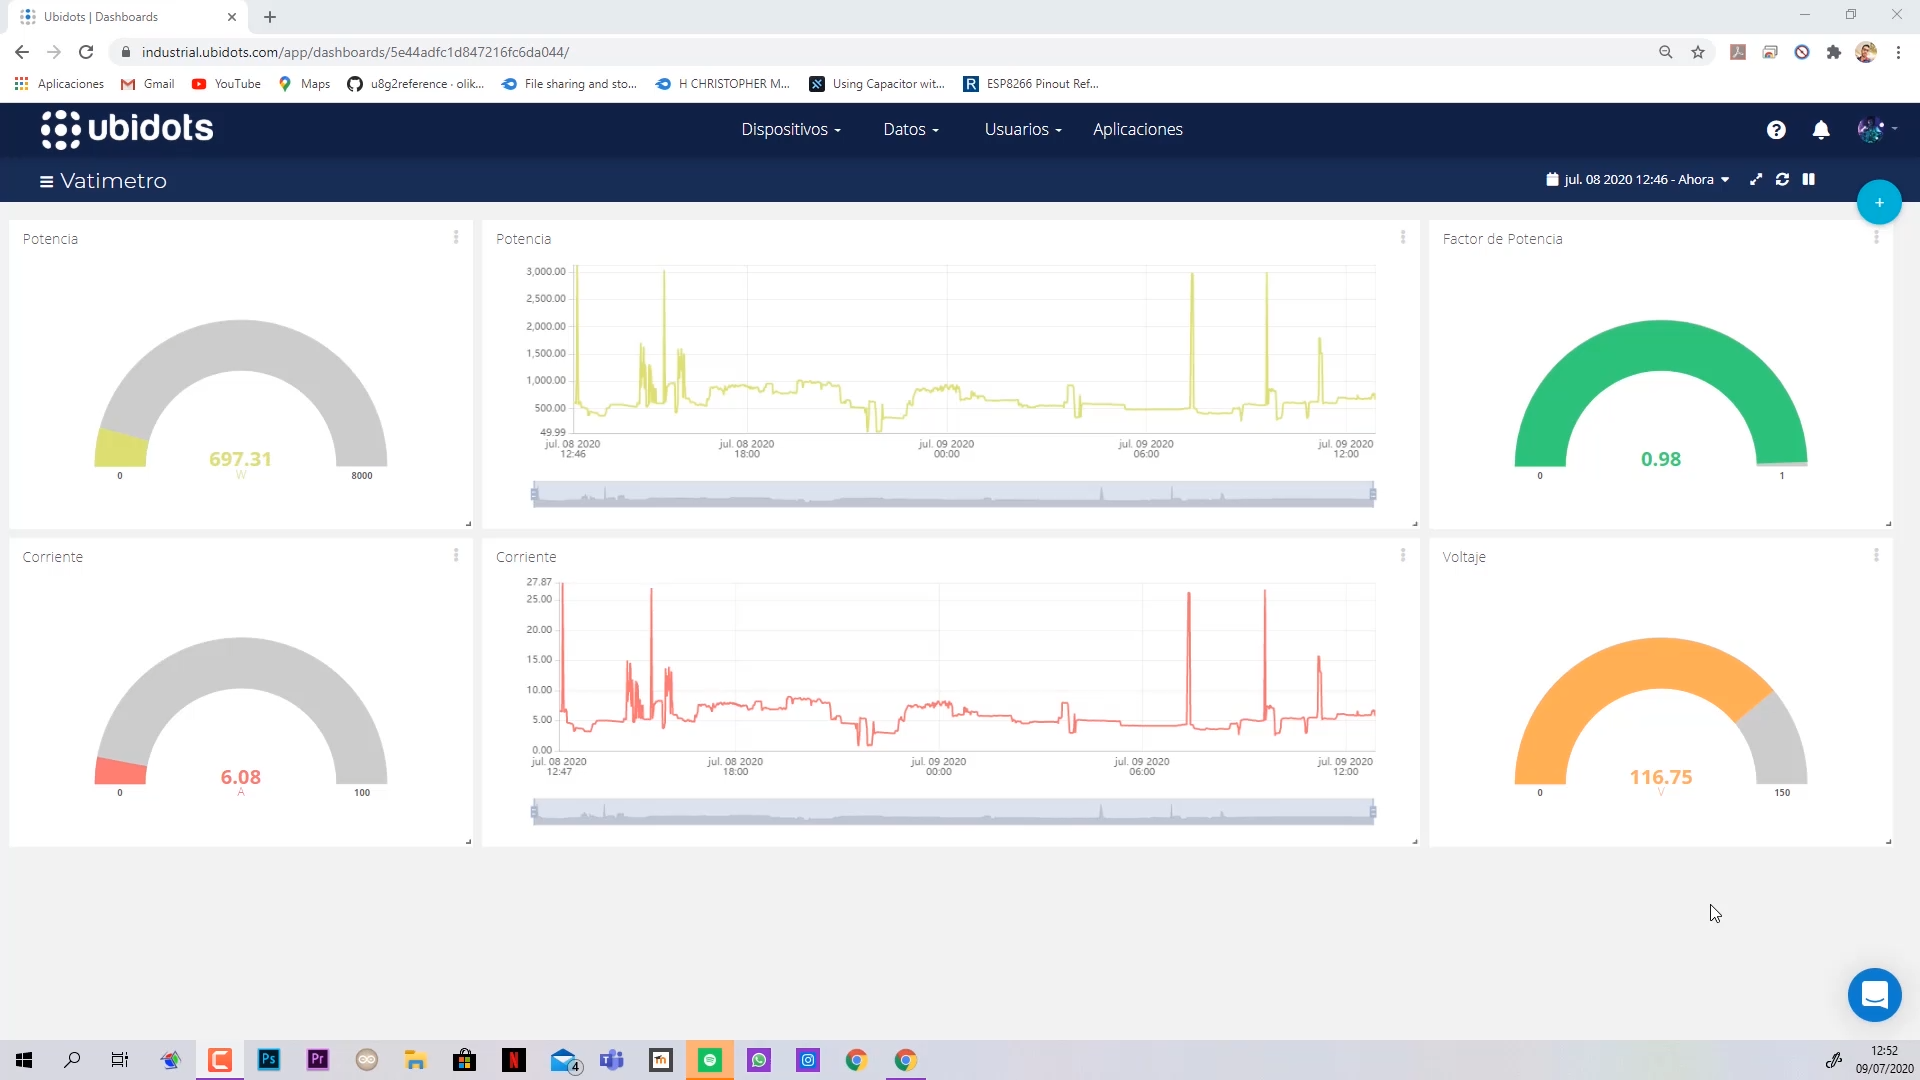
Then you can create an Ubidots Dashboard with the charts and widgets you want, showing the data of your variables.
Testing It
.png)
.png)
.png)
.png)
.png)
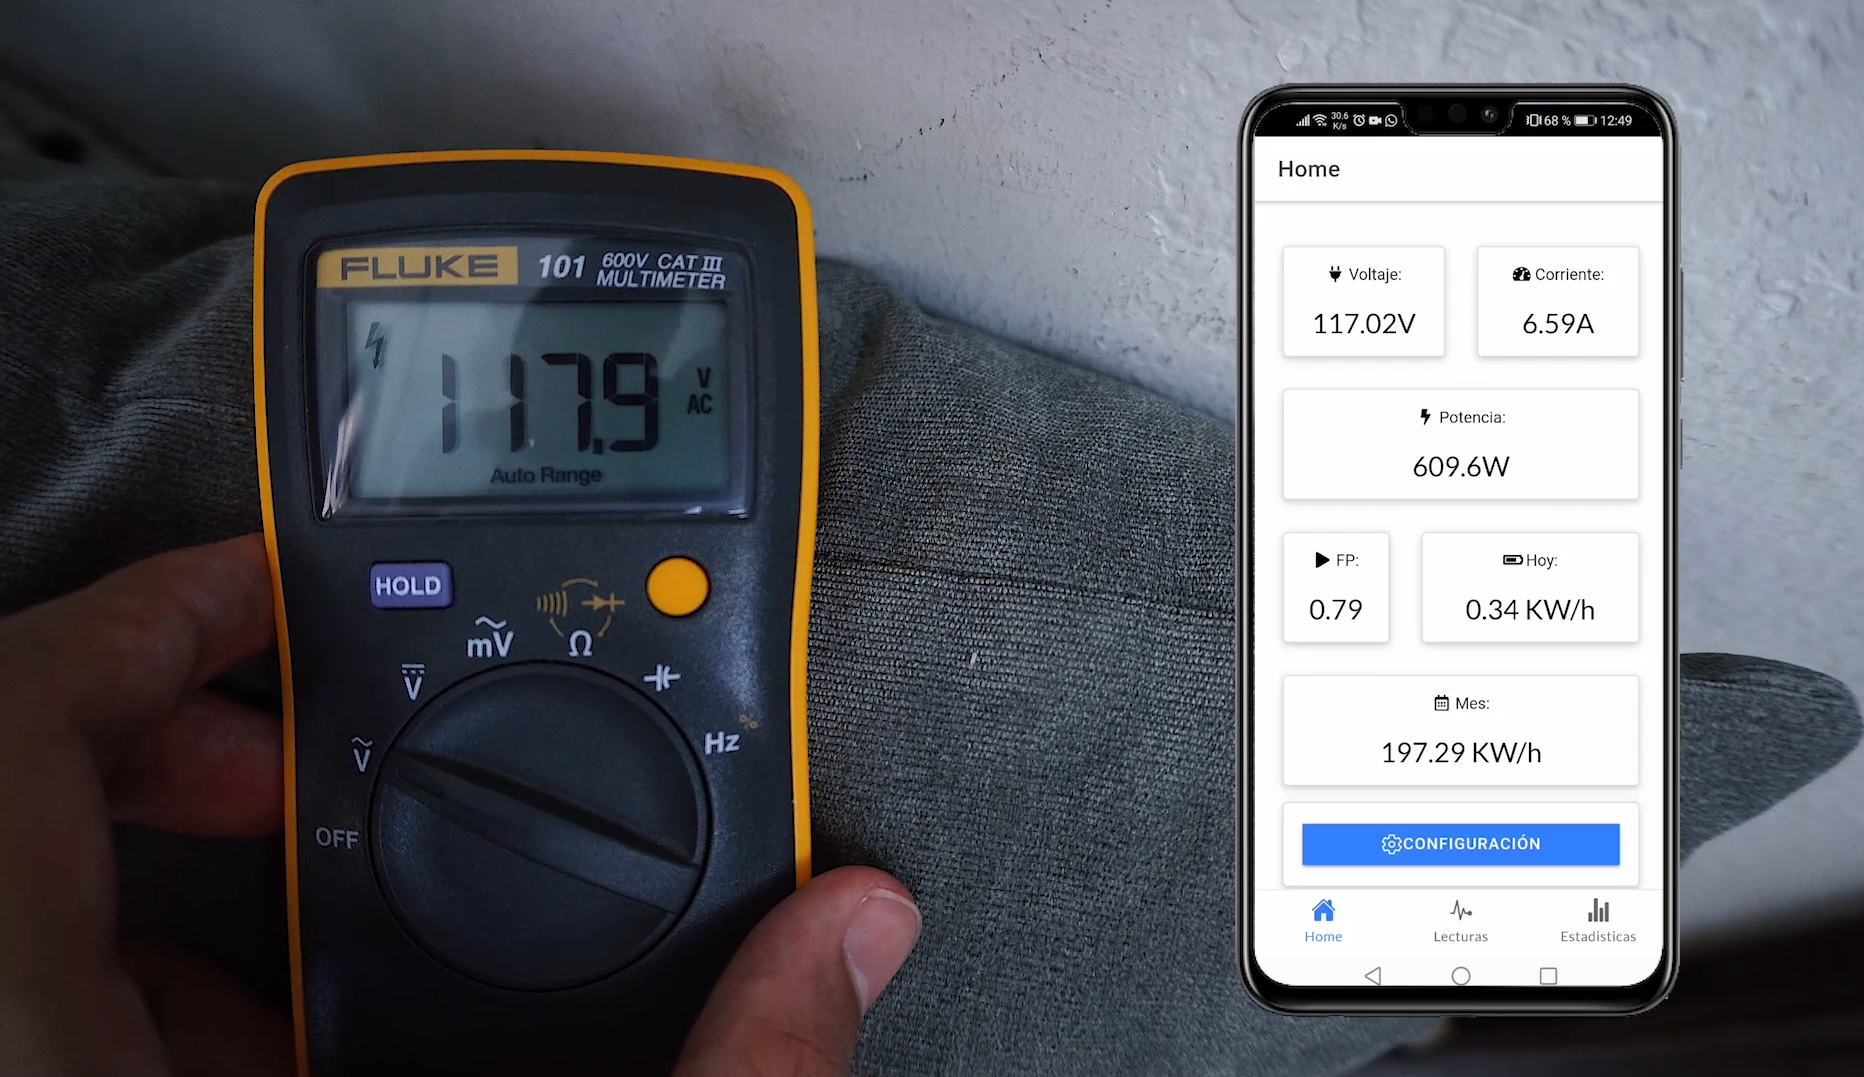
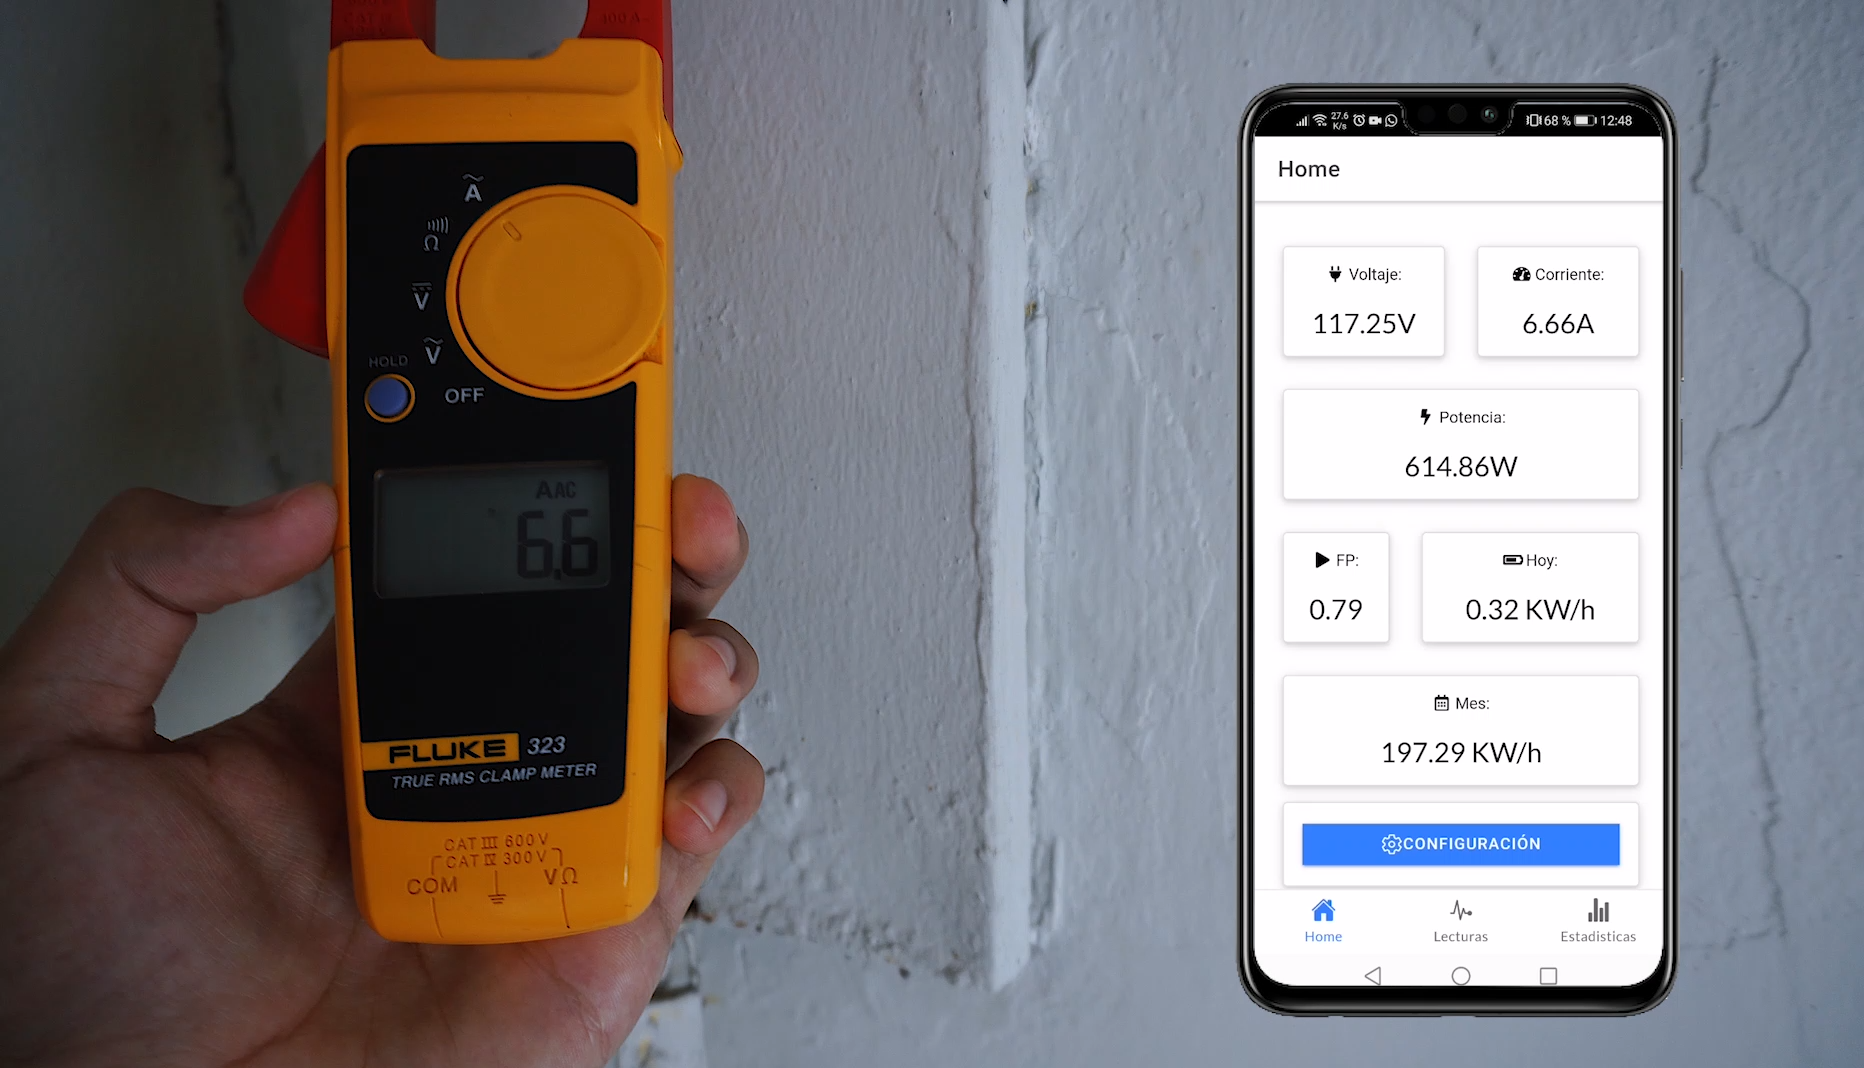
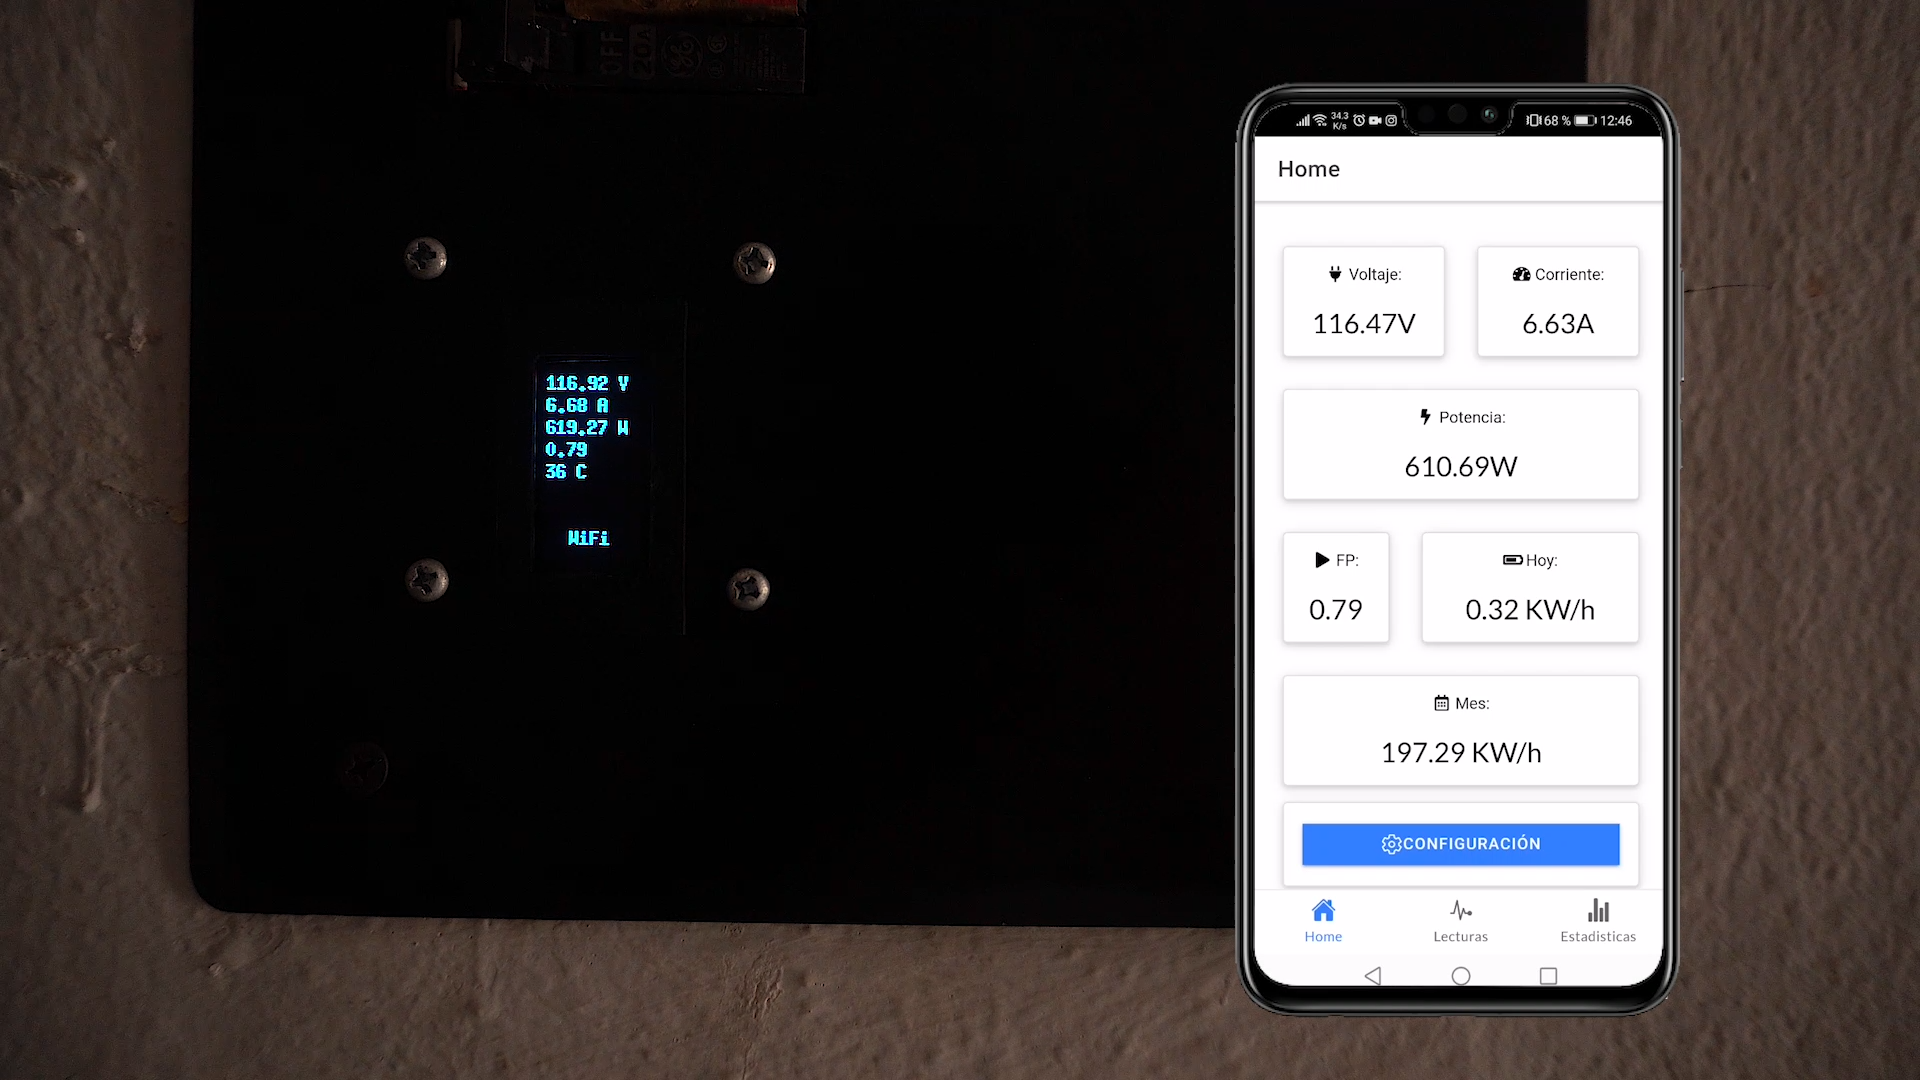
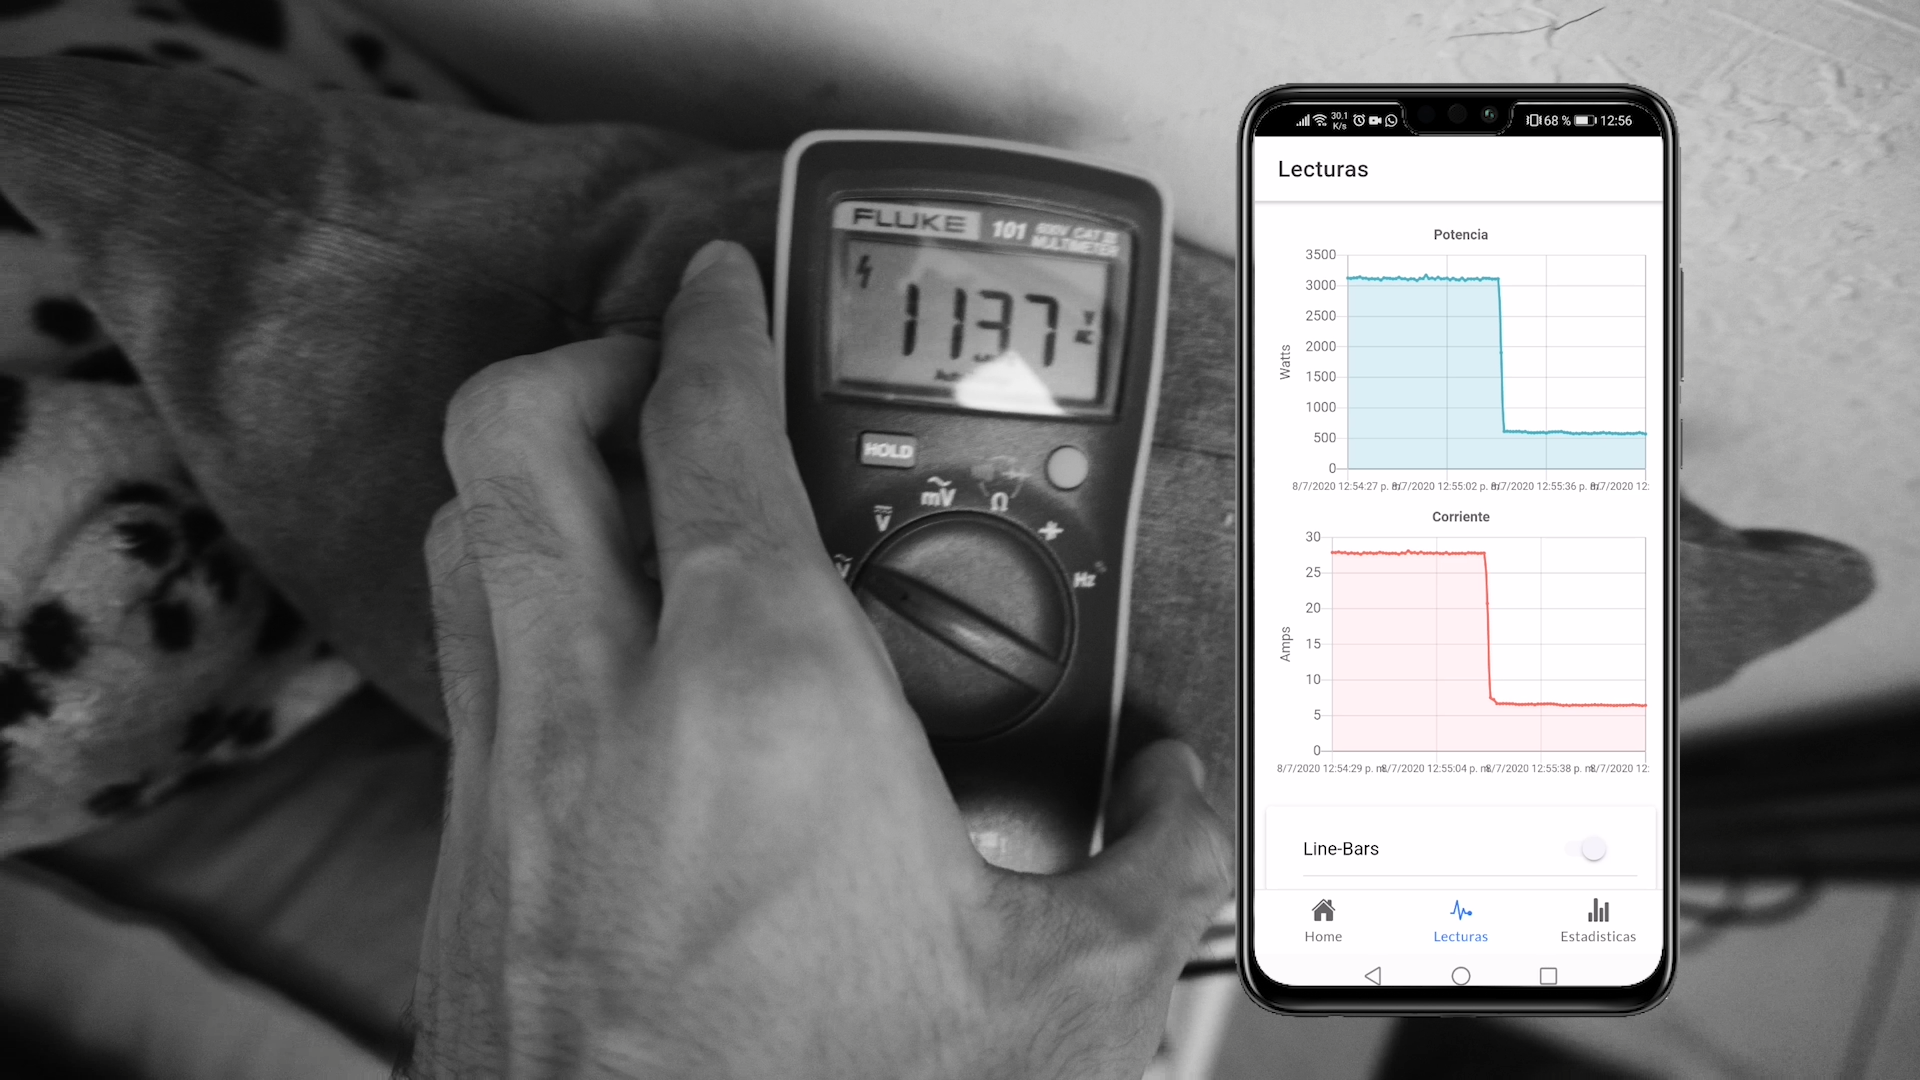
Here you can see that we have the measurments made by real instruments and the data showed by our device and they are plenty the same, that means that our system is doing a great job.
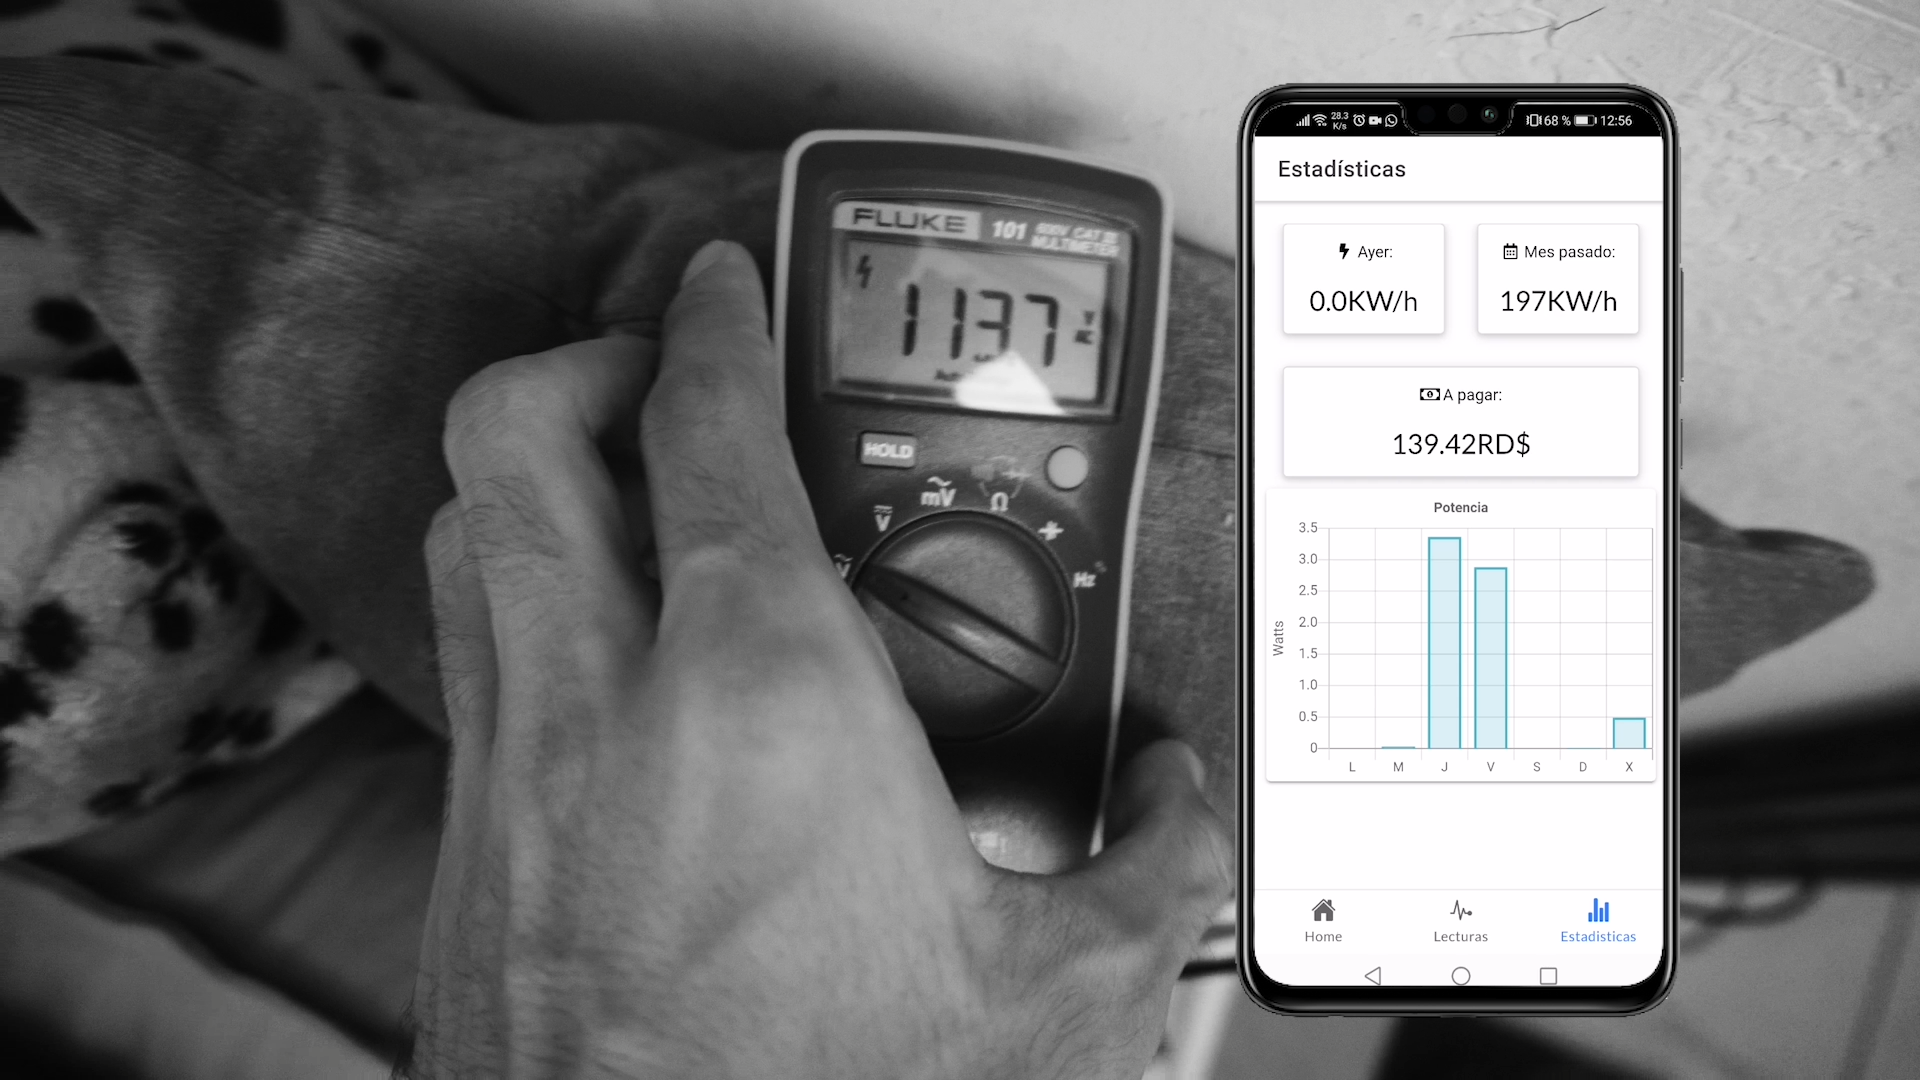
During the days the device is working and taking notes of the consumption data, you will be able to watch it in the app like the pictures shows.