DATA ANIMATION USING EXCEL VBA
by ShantnuS2 in Teachers > University+
572 Views, 1 Favorites, 0 Comments
DATA ANIMATION USING EXCEL VBA

Some times in oder to visualize multiple data set we need to have an animation of data trends. This shows how these data interacts and their interdependancy. In this intructable i am showing how this can be done on excel using VBA .
Supplies
To simulate your data set you just need microsoft excel.
.png)
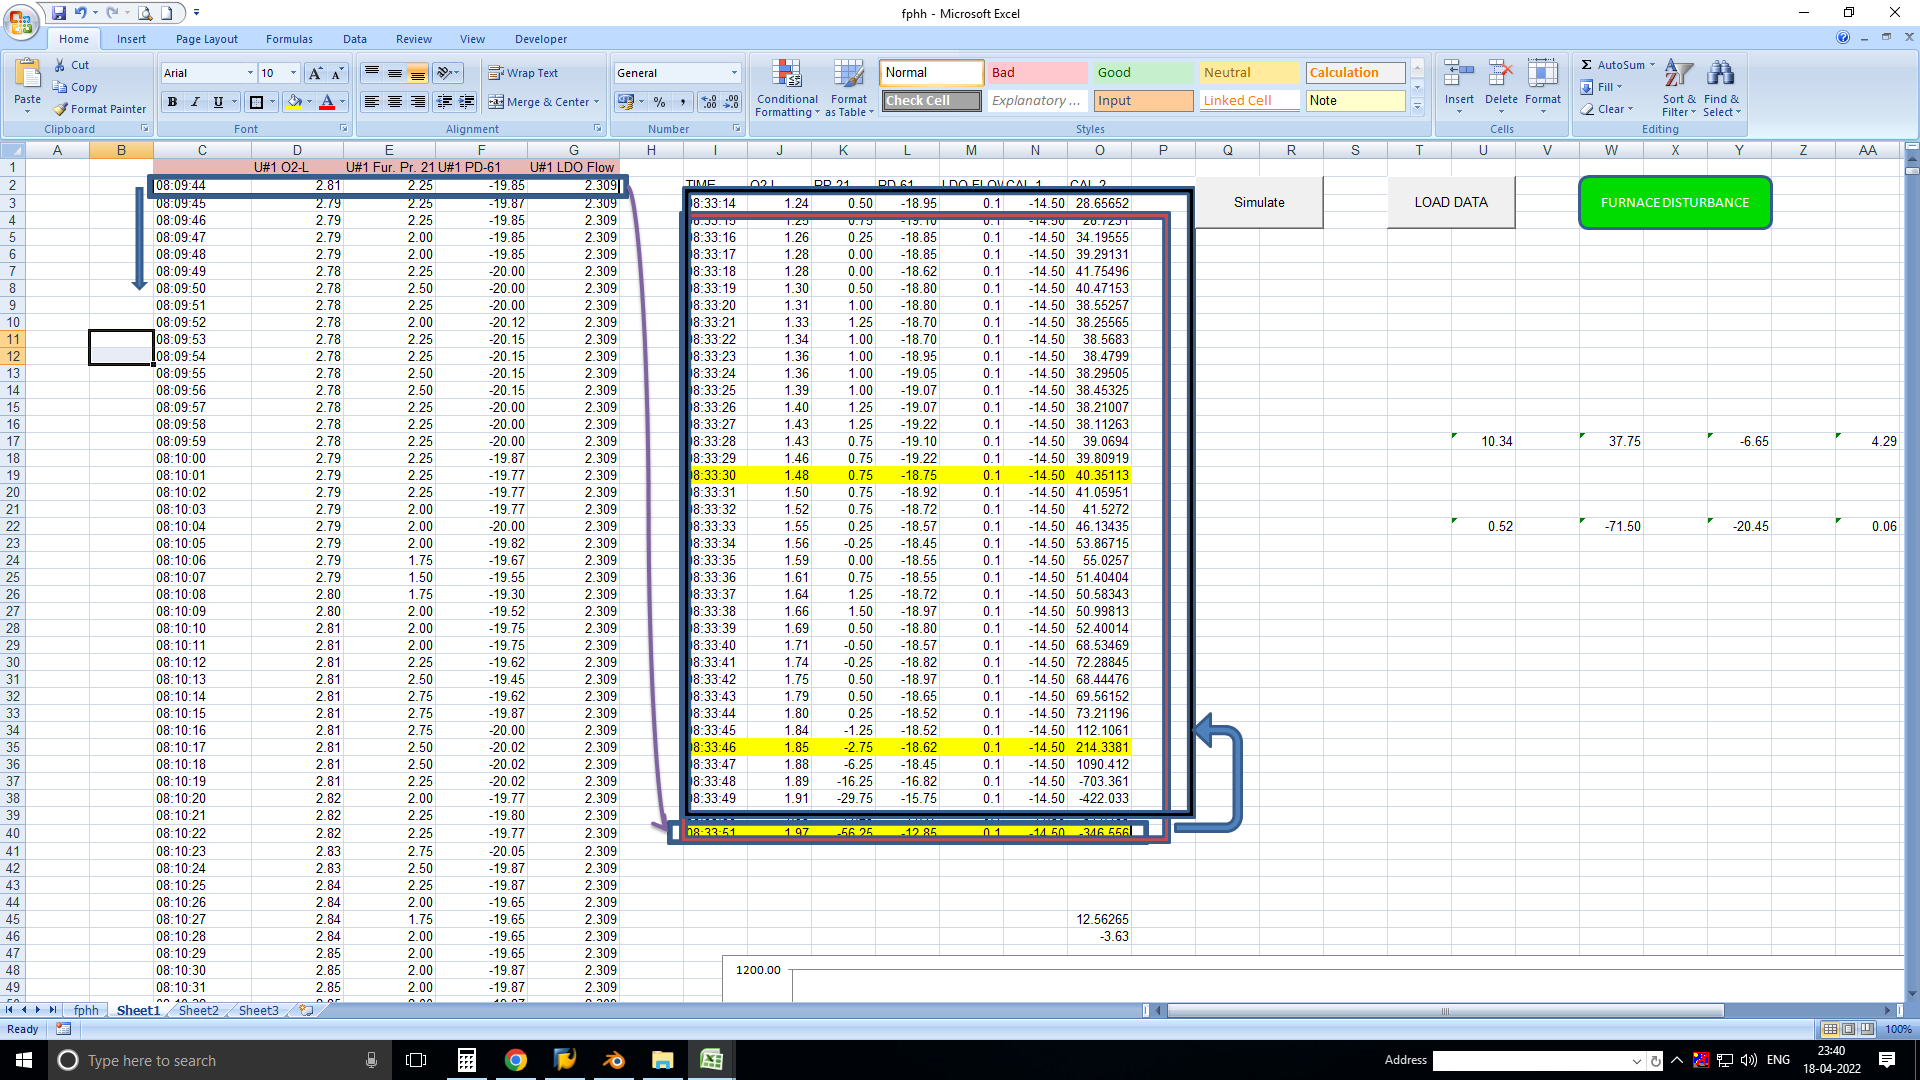
Insert all the data you need in a macro enabled excel file. the shaded area show my complete data set
.png)
Write a excel macro that copies a row of data from your data set and paste at bottom of new loaction then move your new range of data by one row up, repeat the process in loop to the end of your data set.
My macro code is given below :
Sub SCAN()
Sheets("Sheet1").Select
For j = -10 To 3255


Cells(40, 10) = Cells(j + 15, 4)
Cells(40, 11) = Cells(j + 15, 5)
Cells(40, 12) = Cells(j + 15, 6)
Cells(40, 13) = Cells(j + 15, 7)
Cells(40, 9) = Cells(j + 15, 3)
A = [O48].Value
If A > 20 Then
[P48] = Cells(j + 15, 3)
ActiveSheet.Shapes("Rounded Rectangle 2").Fill.ForeColor.RGB = RGB(220, 0, 0)
Else
ActiveSheet.Shapes("Rounded Rectangle 2").Fill.ForeColor.RGB = RGB(0, 220, 0)
End If
If Cells(j + 15, 6) > -13.5 Then
Exit Sub
End If


'Application.Wait 1000
Application.ScreenUpdating = False
'Application.Wait 1000
For i = 3 To 39
Application.ScreenUpdating = False
Cells(i, 10) = Cells(i + 1, 10)
Cells(i, 11) = Cells(i + 1, 11)
Cells(i, 12) = Cells(i + 1, 12)
Cells(i, 13) = Cells(i + 1, 13)
Cells(i, 15) = Cells(i + 1, 15)
Cells(i, 9) = Cells(i + 1, 9)
'Application.Wait 1000
Next i
Application.ScreenUpdating = True
'Application.Wait 1000
Next j
End Sub
make modifications as per your need.
.png)
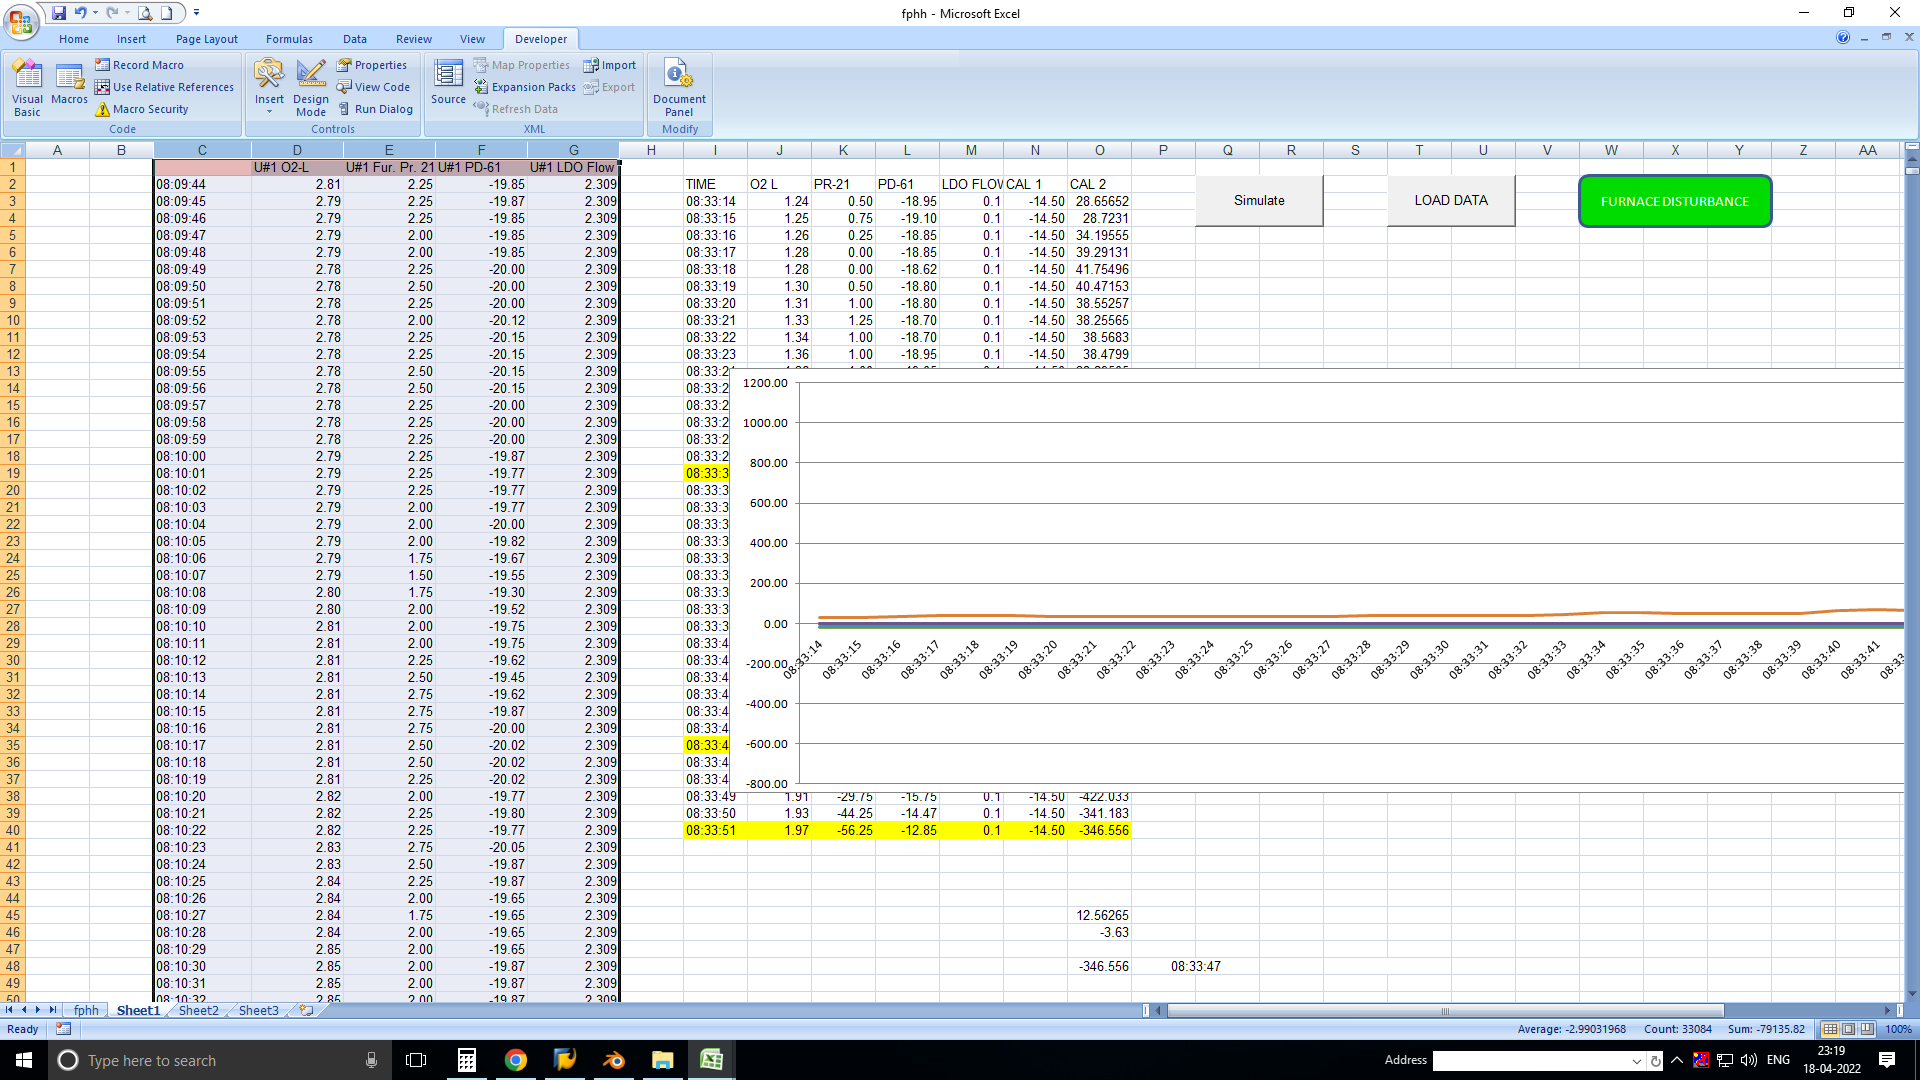
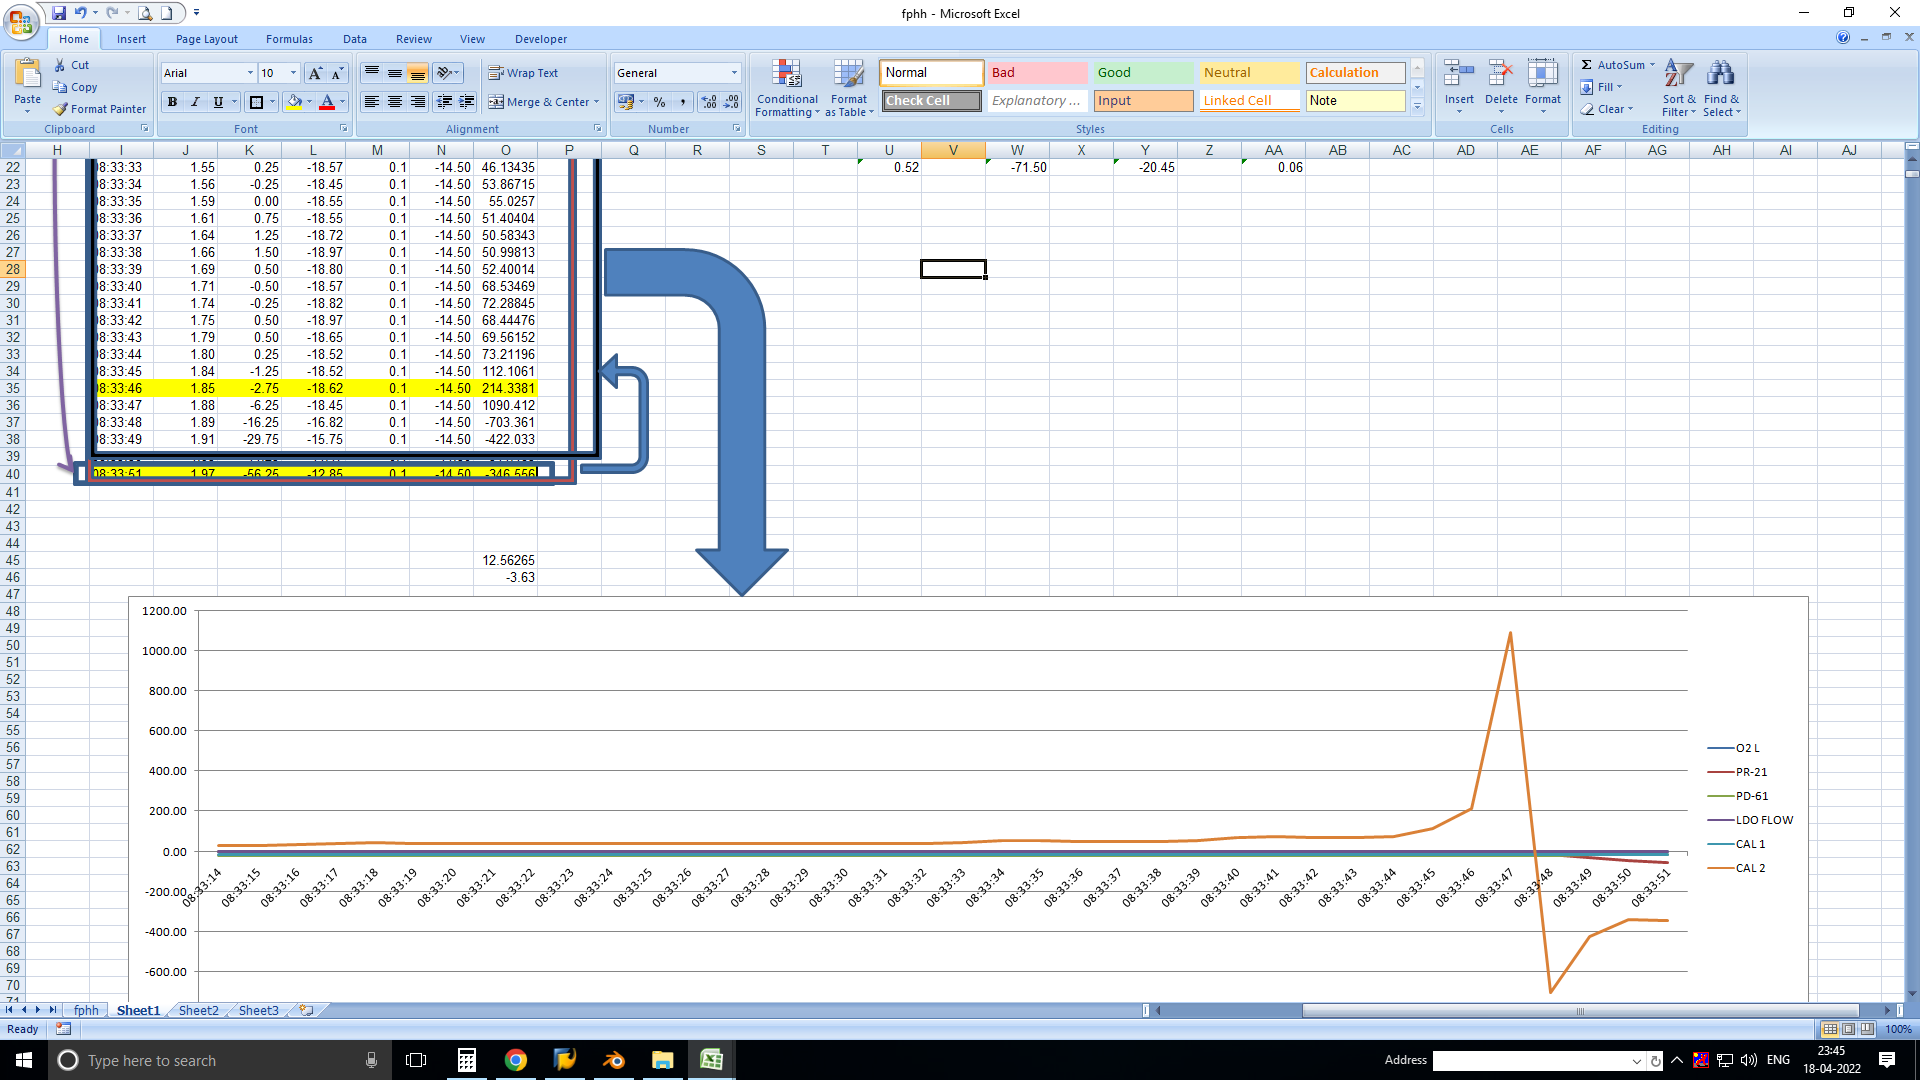
Select the new range of data and insert a chart add button to run your macro and you have your project !
Run your macro from the macro button and see your simulated data in runing chart