Creating Perfectly Looping Animations With Python
by i95sarmiento in Teachers > University+
21264 Views, 239 Favorites, 0 Comments
Creating Perfectly Looping Animations With Python

In this project, we’ll explore a creative technique to make animations that loop perfectly, using periodic functions and offsets in Python. Looping animations are incredibly popular in everything from graphic design to social media posts, video games, and even data visualizations. By creating these smoothly repeating effects, we can craft visually captivating and hypnotic animations that appear to "breathe" with natural rhythm.
This technique relies on three main components:
- Periodic Functions: These are functions that repeat at regular intervals, like sine or cosine waves.
- Transformation: Applying a visual change to our objects based on the periodic function.
- Offset: Adding variation by applying a delay to each object’s transformation, creating patterns that seem to ripple or radiate outward.
Imagine using this to create designs like a grid of dots that pulse from large to small in a perfect wave, or lines that rotate in unison with slight timing differences. This technique is versatile and can be expanded to generate everything from organic textures to kaleidoscopic patterns.
By the end of this project, you’ll have a deeper understanding of how to create looping animations in Python, and you’ll be equipped to experiment with your own unique designs.
Supplies
Materials Needed
- A computer
- Python installed (along with the matplotlib and numpy libraries)
Setting Up Your Project


Before we dive into coding, let’s set up the file where we’ll write our Python code.
- Create the File: Open the folder where you'd like to save your project, and create a new text file. Rename this file to loop.py (make sure it has the .py extension, which tells your computer it’s a Python file).
- Open Command Prompt: In the same folder, click on the address bar at the top of the window, type cmd, and press Enter. This will open the Command Prompt directly in the folder where your file is located, making it easy to run your Python code.
- Run Your Code: To test or execute your code, simply type loop.py in the Command Prompt and press Enter.
With your project set up, you’re ready to start coding! Let's move on to creating the animation functions that will bring your design to life.
Setting Up the Environment

Before we begin coding, make sure you have matplotlib installed. You can install it via pip:
Defining the Periodic Function
A periodic function will control the movement of objects. Here, we’ll use a sine wave, which loops naturally over time, making it perfect for animations.
Creating the Offset Function
The offset creates a delay that gives the illusion of motion propagating through space. In this example, the offset will be based on each object's distance from the center.
Setting Up the Animation Loop

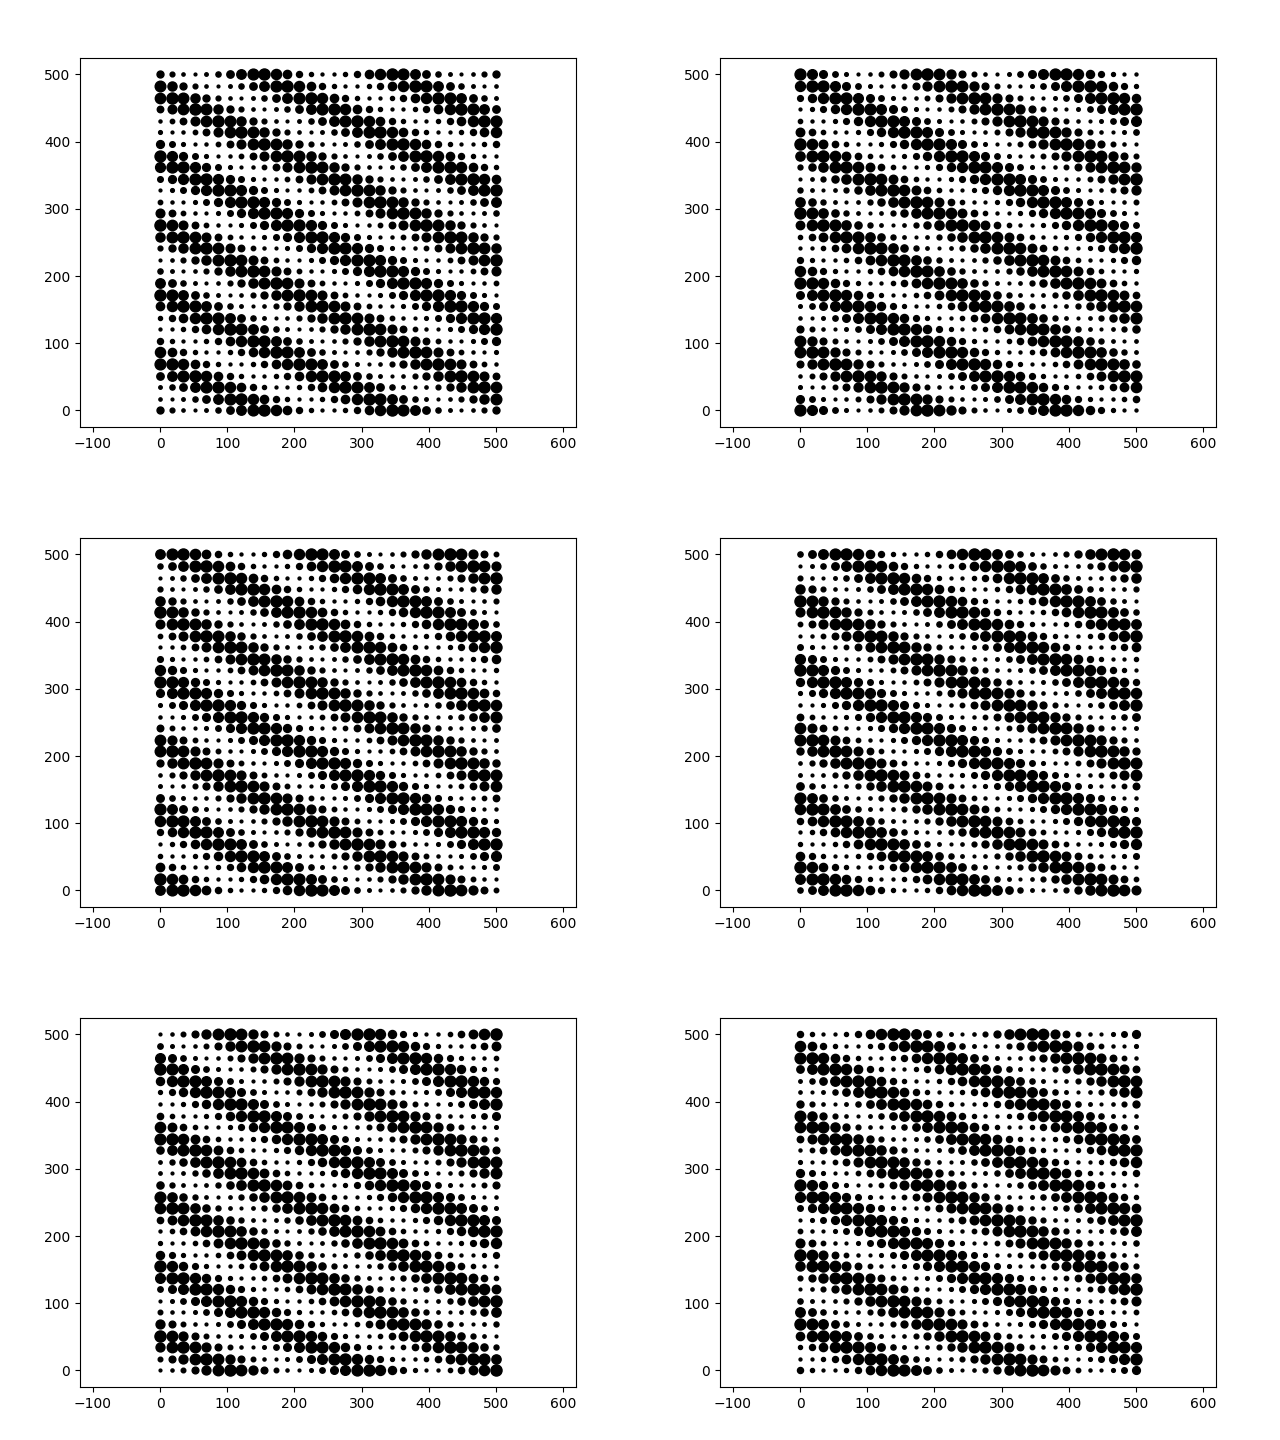
We’ll use a grid of points and control their size based on the periodic function and offset. This setup allows us to render each frame with dynamic points that grow and shrink in sync, creating a mesmerizing effect.
Downloads
Exporting As a GIF


To create a GIF, we can save each frame and use imageio to compile them.
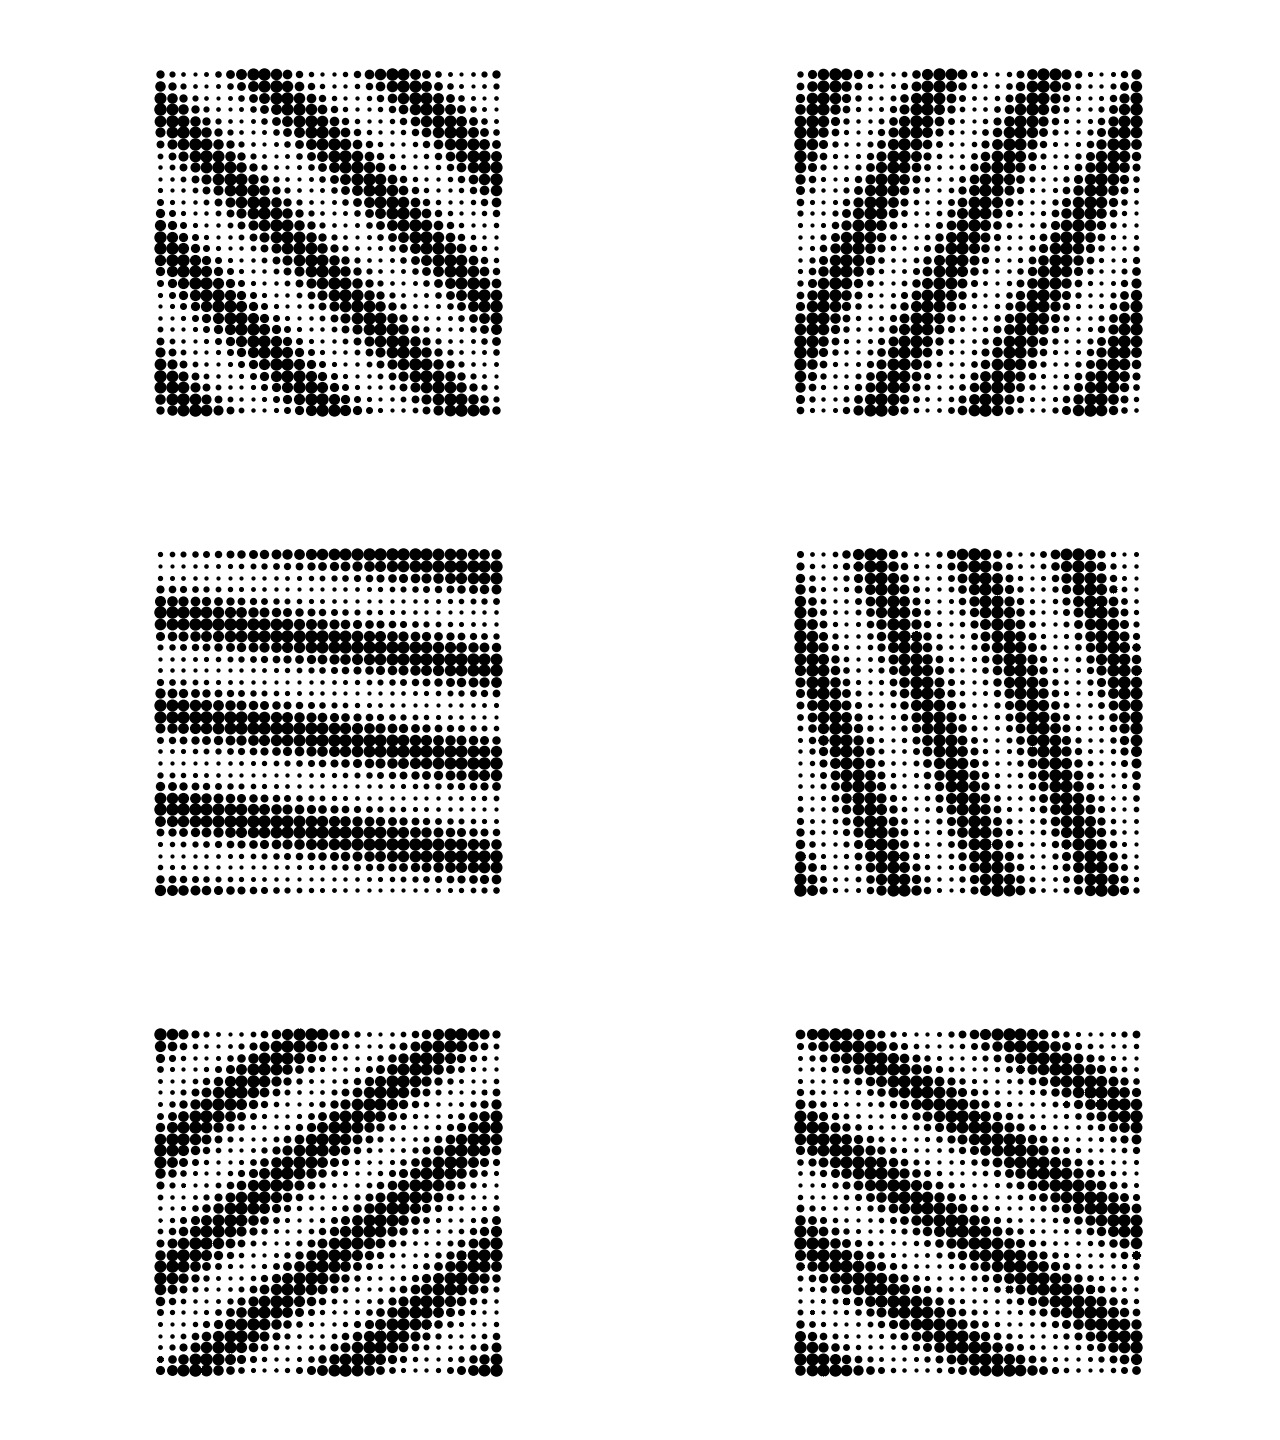
You can vary the parameters num_frames, grid_size and width, height to get different results.
Downloads
Experimenting With Different Offsets


Try changing the offset function to experiment with other patterns, like rotating lines or creating spiral effects. Here's an example for rotation:
Final Thoughts
With these periodic and offset functions, the possibilities are endless. By adjusting parameters, you can create unique animations and patterns with a distinct visual rhythm.