Color Detection in Python Using OpenCV
by Hiten Mandaliya in Circuits > Software
4953 Views, 3 Favorites, 0 Comments
Color Detection in Python Using OpenCV
Hello! This instructable is used to guide with on how to extract a specific color from an image in python using openCV library. If your new to this technique then don't worry, at the end of this guide you will be able to program your very own color detection program.
Following are the functions or we can say techniques which you will be learning,
1. How to read an image
2. How to create Track Bars
3. How to adjust the value of Hue, Saturation and value of an image using track bars
4. And then there will be your final output
You can watch the video of the output which I have attached below.
So let's get started
Supplies
- Python 3
- openCV library
- numpy library
Importing Libraries
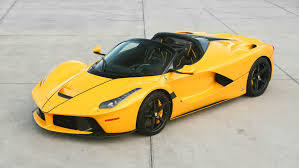
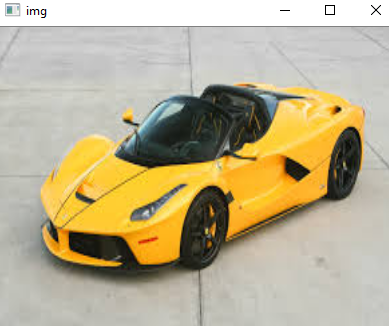
The image is of yellow ferrari as shown and we will program to extract only yellow color from that image
First step will be importing our libraries
1. Including openCV library. It is called cv2 in python
2. Including numpy library as np. The "as" allow us to us numpy as np so no need to write numpy again and again
Creating Track Bars
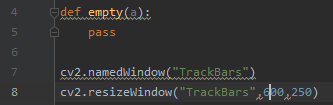
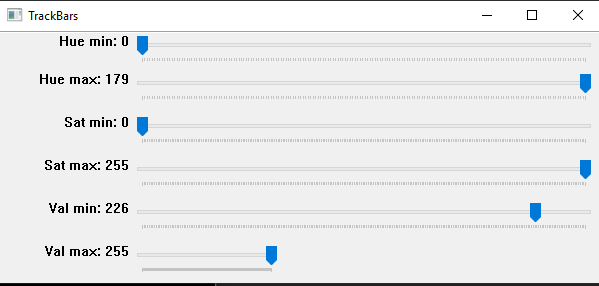
Track Bars are created to adjust the value of Hue, Saturation and Value in an image.
- cv2.namedWindow("TrackBars") --> This line of code is used to create a new output window and name of the window is given as TrackBars (You can give any name you want)
- cv2.resizeWindow("TrackBars",600,250) --> This function is used to resize a window. "TrackBars" is for which window you want to resize since i wanted to resize TrackBars window I have written that name. Followed by two integers. Those two integers are the width and height. You can play around with those two numbers to change the size
Creating TrackBars for Hue, Saturation and Value
Now we will be creating total 6 TrackBars for Hue, Saturation and value. Each will have two i.e. 1 for minimum and 1 for maximum. We will be using createTrackbar function of openCV. First we will see the syntax of this function.
cv2.createTrackbar("WINDOWNAME","MAINWINDOWNAME","RANGE"). This might be confusing but don't worry we will go through each and every step. Keep one thing in mind that in openCV values of hue is 179, saturation is 255 and value is 255
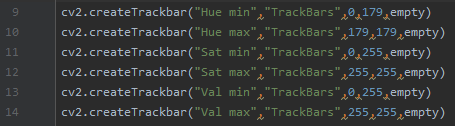
1. Creating TrackBar for hue min:
cv2.createTrackbar("Hue min","TrackBars",0,179,empty)
In this Hue min is the trackbar name, TrackBars is the main window, 0 is the position on which our slider will be and 179 is the range means the silder will move from 0-179
2. Creating TrackBar for hue max:
cv2.createTrackbar("Hue max","TrackBars",179,179,empty)
In this Hue max is the trackbar name, TrackBars is the main window, 179 is the position on which our slider will be and 179 is the maximum range means the silder will move from 179-0
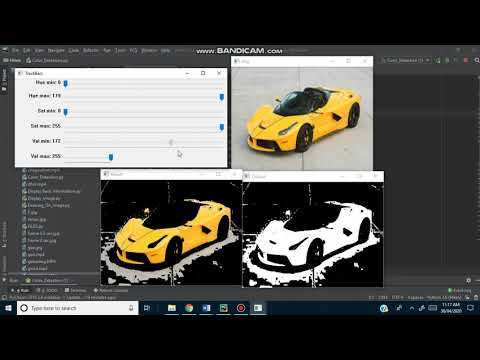
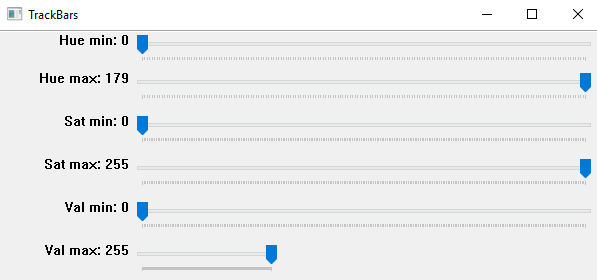
3. Similarly repeat the steps for sat min,sat max, val min and val max as shown in the image
The image with the white background is the output image. This how your track bars will look
How to Read and Resize Image
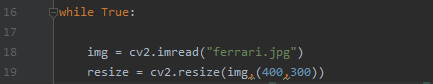
cv2.imread() allows you to read the image. One important think you need to keep in mind that the location of your image must be in the same folder where the program is saved. We will put in while loop because it should run until is is reading the image or we can say until the condition is true
img = cv2.imread("ferrari.jpg")
- In this I have created a variable name "img" in which I am storing the image
- Inside cv2.imread write the name of image with it's extension inside double quote
To resize an image we will be using cv2.resize function. This part is optional, if you want to resize then you can use this function
- Inside cv2.resize first write the variable name in which the image is stored and then its width and height.
Reading Track Bar Values to Apply It to an Image
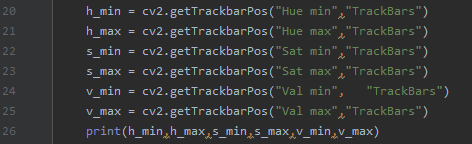
Ok so now we are going to read trackbar bar values so we can apply it to our image. We will get the values using cv2.getTrackbarPos() function.
Let's start with that part...
- h_min = cv2.getTrackbarPos("Hue min","TrackBars")
In the above statement i am creating a variable name h_min in which I will store the value of Hue min. So inside cv2.getTrackbarPos 1st argument would be "Hue min" because i want values of hue min (The spelling must be exactly same as it is createTrackbar function) and 2nd argument would be the name of the trackbar window to which it belongs.
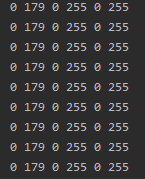
- Repeat the same process for h_max and rest of the functions as shown in the above image and then print all the values using print()
- The output is shown in the second image. It is printing the values of h_min,h_max,s_min,s_max,v_min,s_max
Displaying Image and Setting Upper and Lower Limit
Now we have the min and max value of hue, saturation and value we will use this value to filter out the image so we can the particular color output of an image.
We will create a mask for this using cv2.inRange function. And before that we will set the upper and lower limit of hue, saturation and value
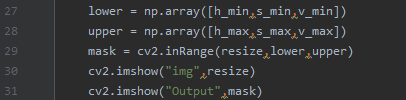
So create a variable name "lower" and using numpy array function set the range of min for all 3 as follows
- lower = np.array([h_min,s_min,v_min])
Repeat same step for upper
- upper = np.array([h_max,s_max,v_max])
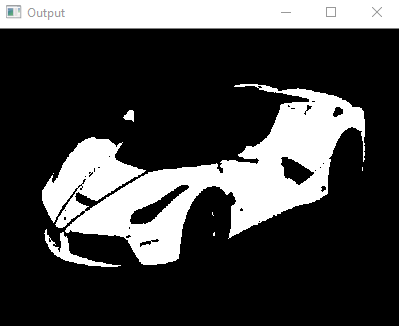
Now we will create a mask as follow
mask = cv2.inRange(resize,lower,upper) --> Inside cv2.inRang the 1st argument would be the variable in which my final image is stored, 2nd argument will be lower limit and 3rd argument would be upper limit.
Now we are going to display the main image and mask. To display we will use cv2.imshow() function
cv2.imshow("img",resize) --> This is to display the main image. 1st argument is the name of the window you can give any name you want and 2nd argument is variable in which my main image is stored which you want to display.
Similarly repeat steps for mask
cv2.imshow("Output",mask)
Now the Final Step
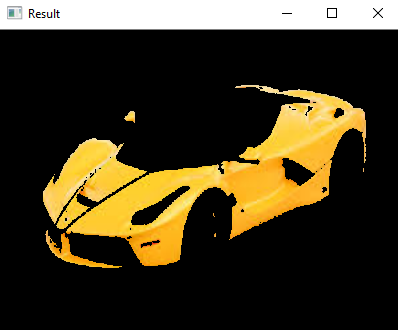
In this final step we will extract color of the car and display.
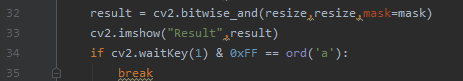
I have created a variable name result. Again you can give any name you want. So we will be using cv2.bitwise_and() function in which we will add to images together and create a new image. And wherever the pixels in both image are present it will take that as yes or "1".
result = cv2.bitwise_and(resize,resize,mask=mask)
- In this the 1st argument will be our image
- 2nd argument will be also our original image but followed by mask applied which we created before
- And finally just display the result using imshow function
Just copy paste this last step it's just a delay and you can exit the output window by pressing "a" on keyboard
Final Outputs