Modify Any Graph in Microsoft Excel
by Uncertified_Baguette in Circuits > Microsoft
2319 Views, 11 Favorites, 0 Comments
Modify Any Graph in Microsoft Excel
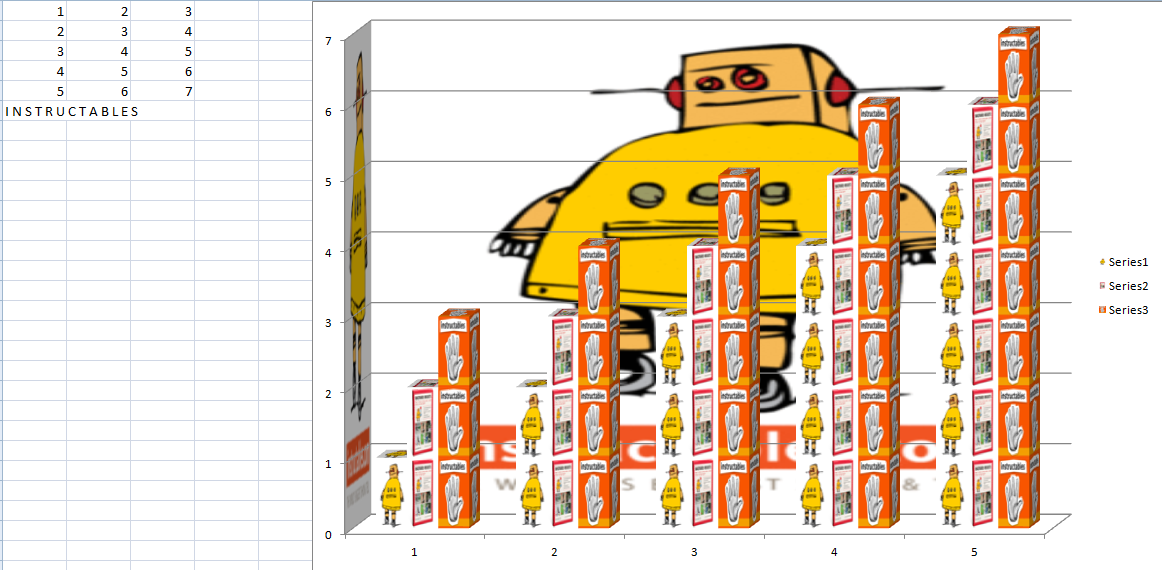
I love the graph scheme in Excel but there was only one thing slowing me using the preset graphs - they were boooooring!
I searched through the formatting section of the charts and I have found a setting that allows the user to make the charts waaaayyyy better.
In the end of this 'ible I have attached a chart template for you to download and enjoy.
Source Your Picture/s


First of all you need to decide what your chart is going to consist of, you should choose distinct photos so if they are repeated you can tell the difference.
The pictures below are the most effective ones in my opinion:
The above are the best pictures to use, they are repeated patterns but they still have defined edges.
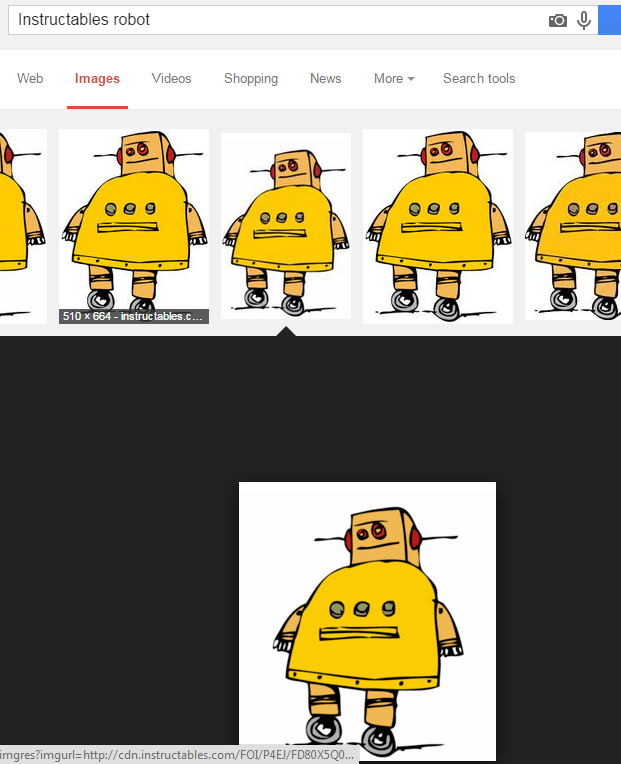
To find the right picture for your chart, you will have to search Google images with the desired picture (e.g. 'instructables robot').
When the page loads you need to look for front on images, you want the pictures with a white outline and not anything else.
Left-click on the desired picture and it should open, right-click on the image and in the drop down box select 'save image as'.
I saved my blocks as 'IR_(your modification here)_picture'.
When you have as many pictures as you have ranges you can leave the internet!
Open up the photo of your block to make sure it is good and then continue onto the next step.
Formatting the Chart Part 1/2
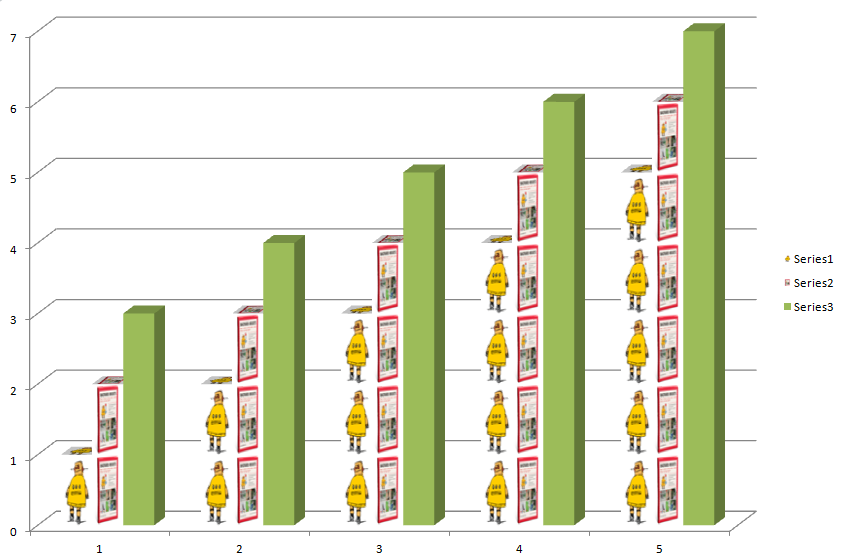
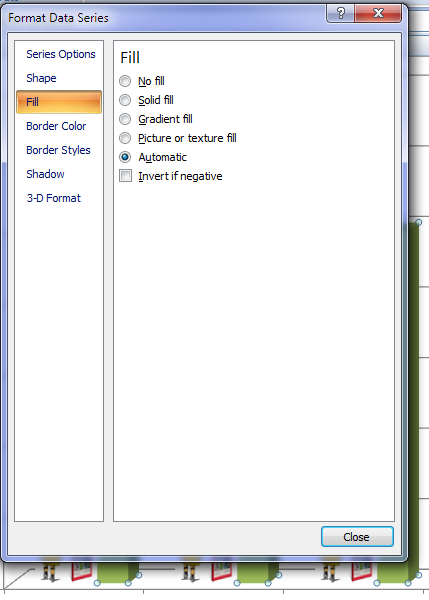
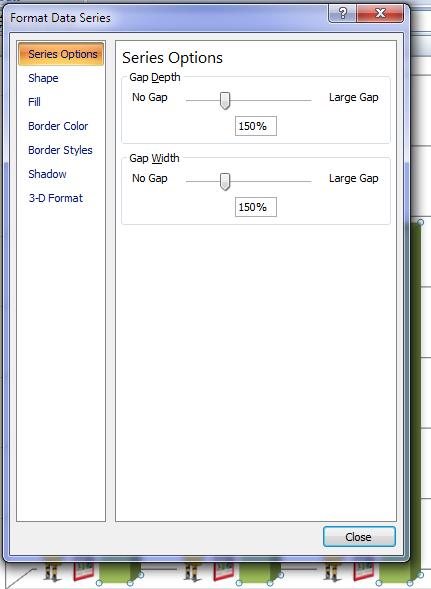
Now it is time to format your chart, put your data in the cells as if you were making a normal chart.
Select your data and create a bar chart from it.
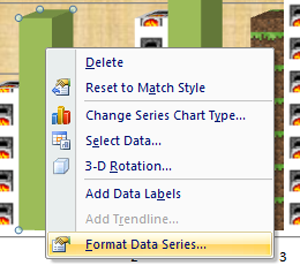
Select a series by clicking on one of the bars, you now can right-click it and open up the option that says: 'format data series'.
From here you need to go to the next step.
Formatting the Chart Part 2/2
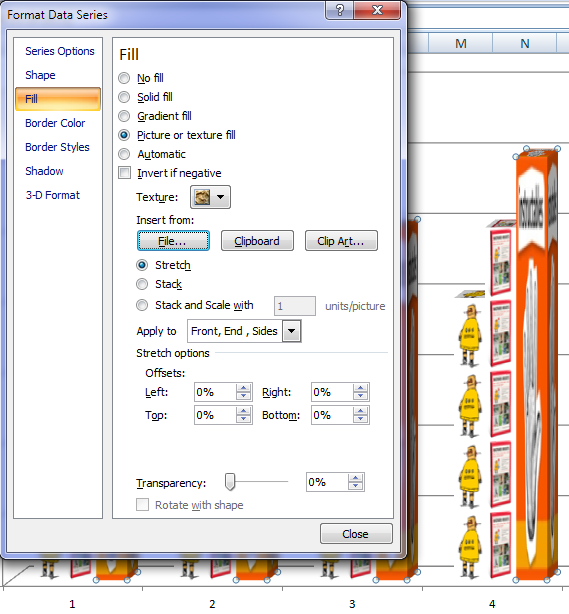
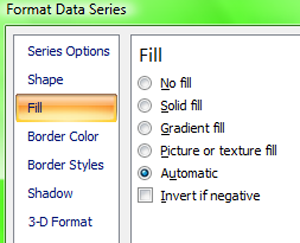
Now we have the formatting box open, select the option on the left-hand pane that says: 'Fill'.
Find the option in the main pane that says: 'Picture or Texture fill', select it.
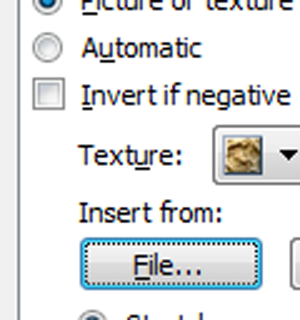
Still in the main pane there should be an option to 'insert from file', click it and select your desired picture.
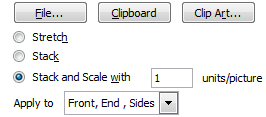
Now you need to find the little option that says: 'Stack' it should be in a group of three options, the other two will say: 'stretch' and 'stack and scale width'.
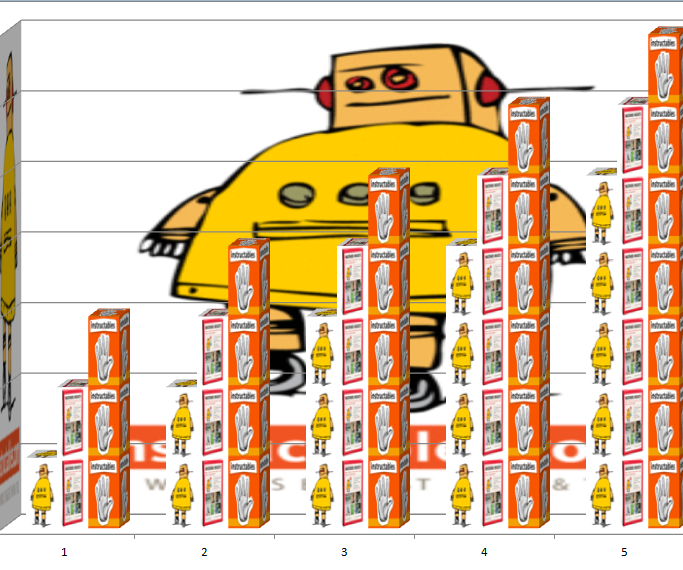
Do this with all the data series and you are done!
I have included a template for you to download and use/modify/share/enjoy!