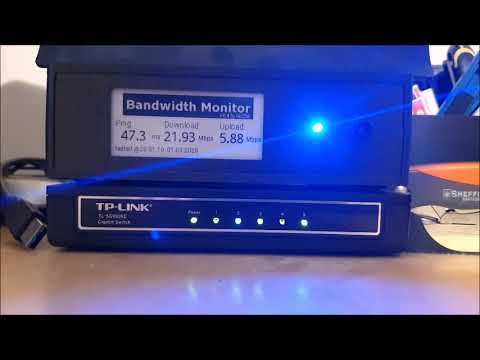
Bandwidth Monitor

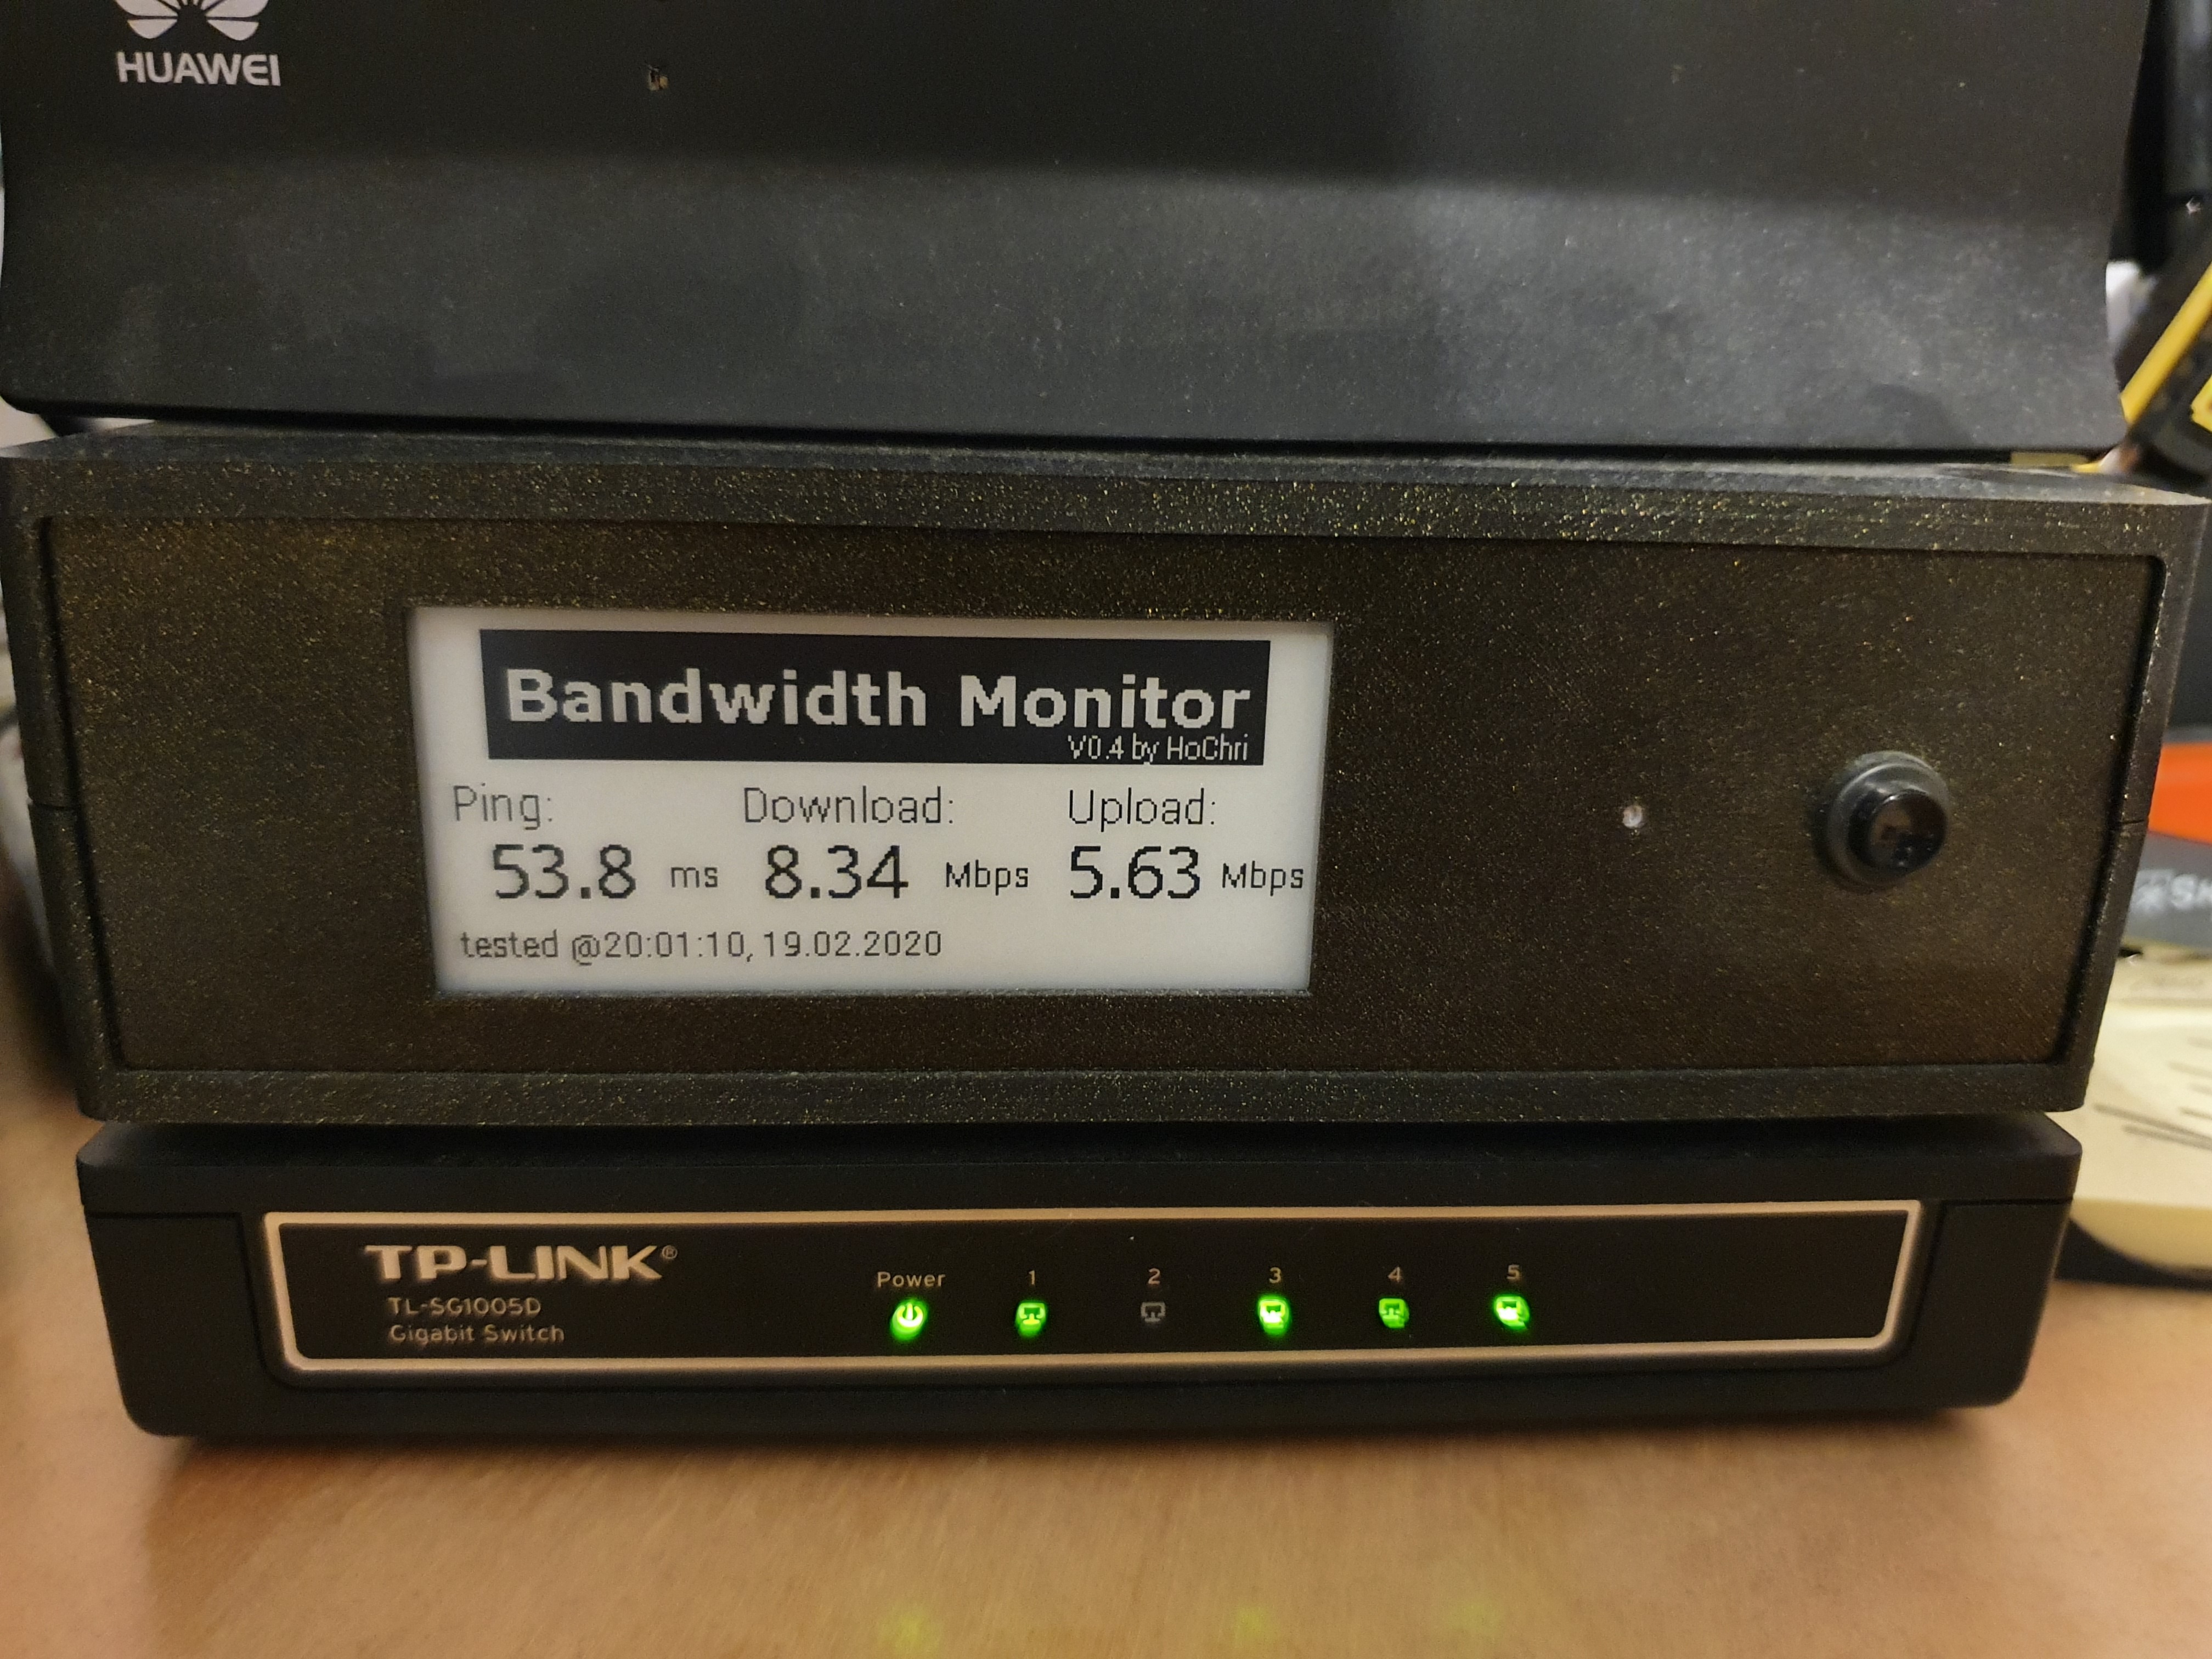

As I often asked myself what bandwidth is currently provided by my ISP (I use a LTE modem for the Internet connection), I thought of a bandwidth monitoring system.
Since the system should be compact and power-saving, I chose a Raspberry Pi Zero as the central component. The Raspberry is connected to the modem via WLAN, therefore WLAN problems can be detected as well.
Supplies
- Raspberry Pi Zero WH
- Waveshare e-ink display (2.9inch-e-paper-module)
- DC-DC converter (e.g. DEBO DCDC 20W)
- RGB LED (taken out from an old device)
- Push-button
- Switch
- Relais module (e.g. 2 Way Relay module2 Way Relay module)
- Male connector + Female connector (both fitting the size of your modem power supply plug)
- 3D printed case
Features
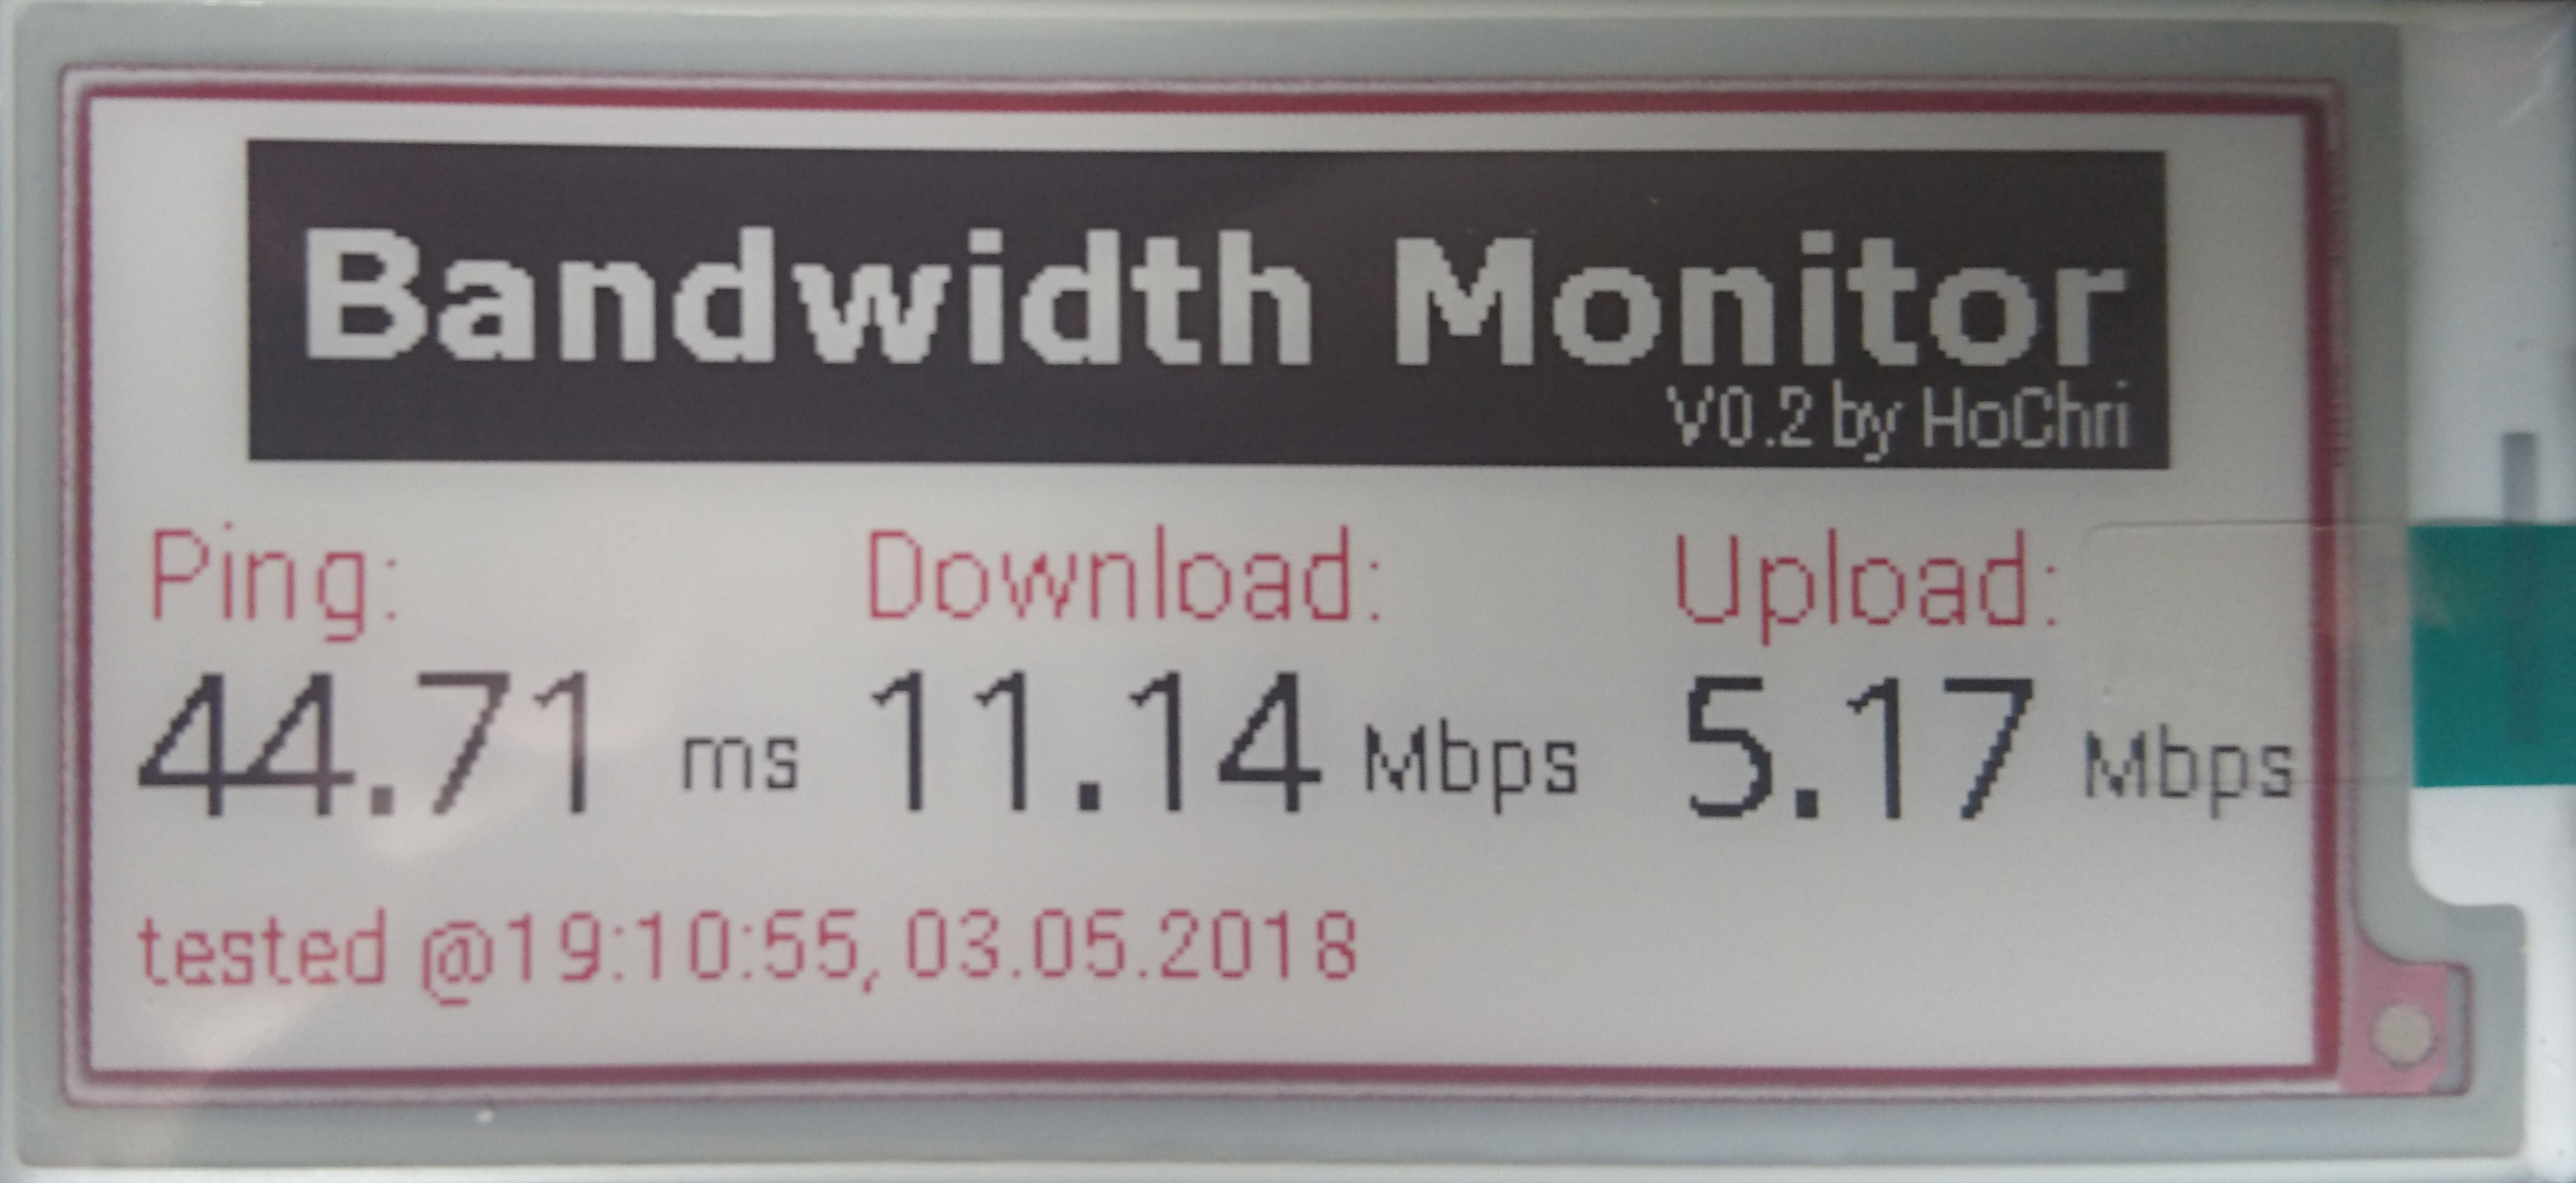
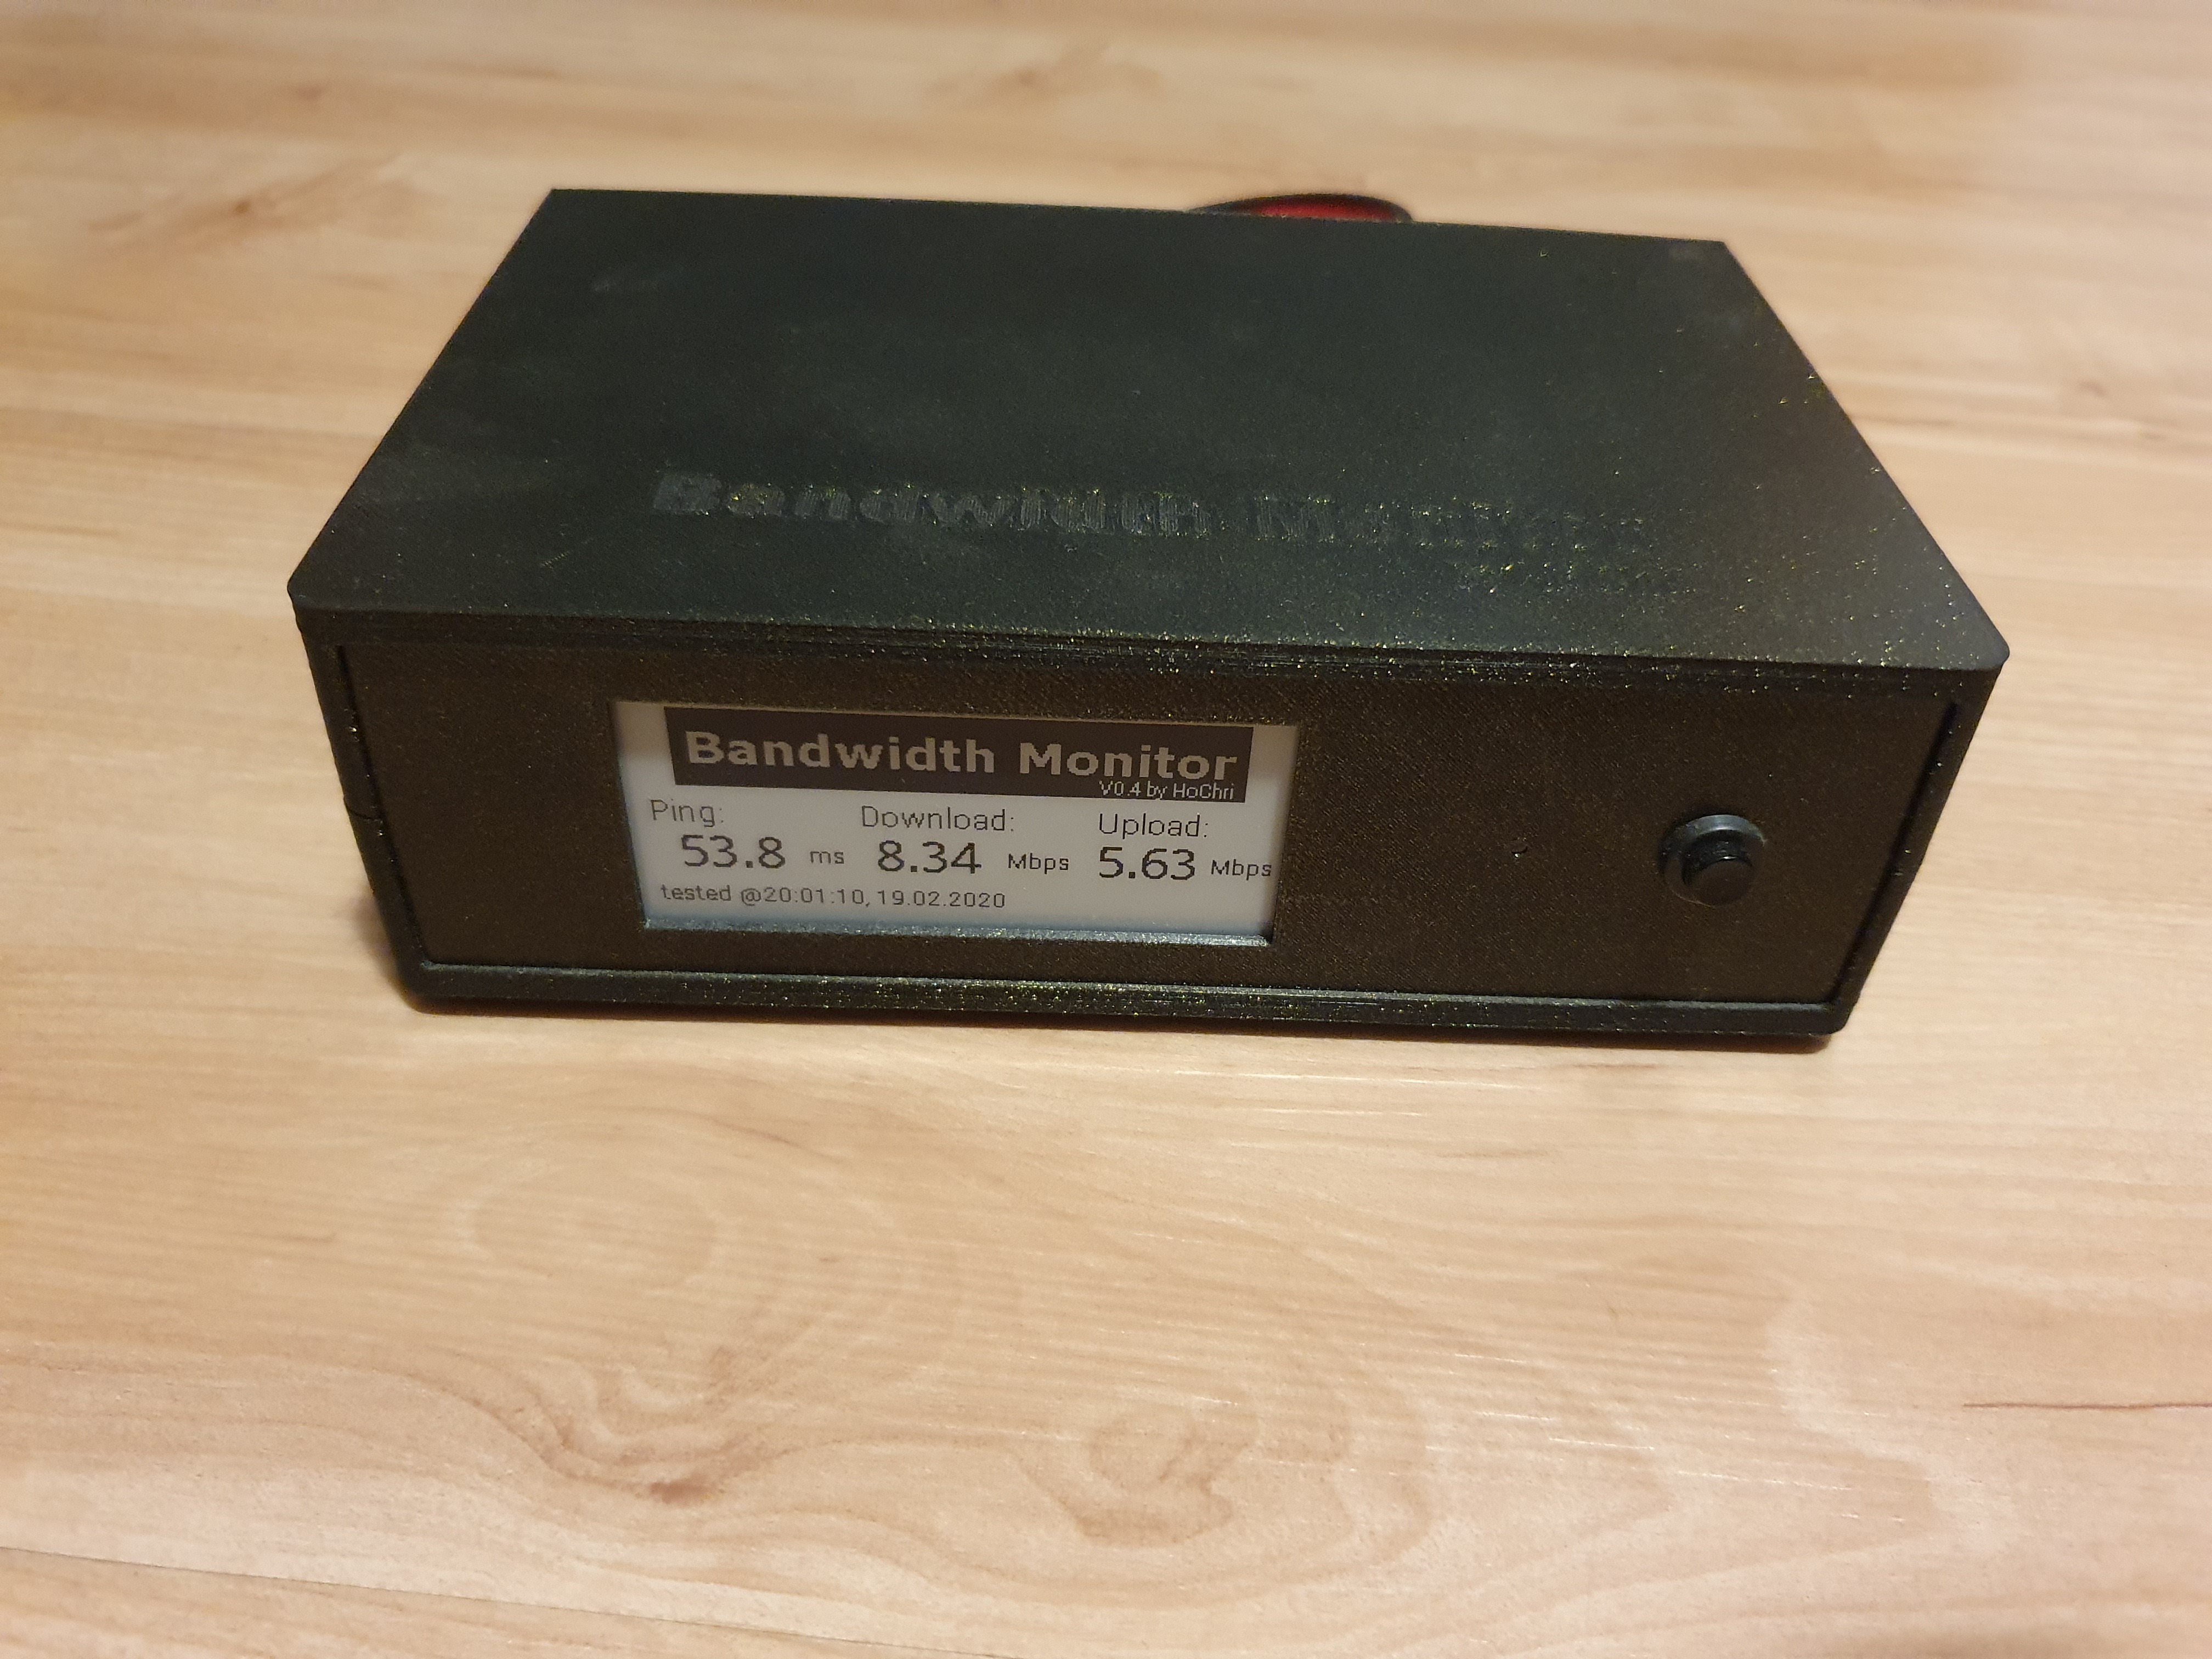
- The Raspberry Pi Zero is connected via WLAN, tests up- and download speed and performs a ping measurement every half hour . A command line version of speedtest.net is used as the basis for the measurements.
- The result of the bandwidth and ping measurement is shown on an e-ink display. The time of the measurement is also shown.
- If the download speed falls below a defined threshold value, a relay switches the modem off and on for a short time. The modem is thus reset without any modification of the device (only the power supply is interrupted).
- A button on the front of the device is available to trigger the bandwidth measurement manually.
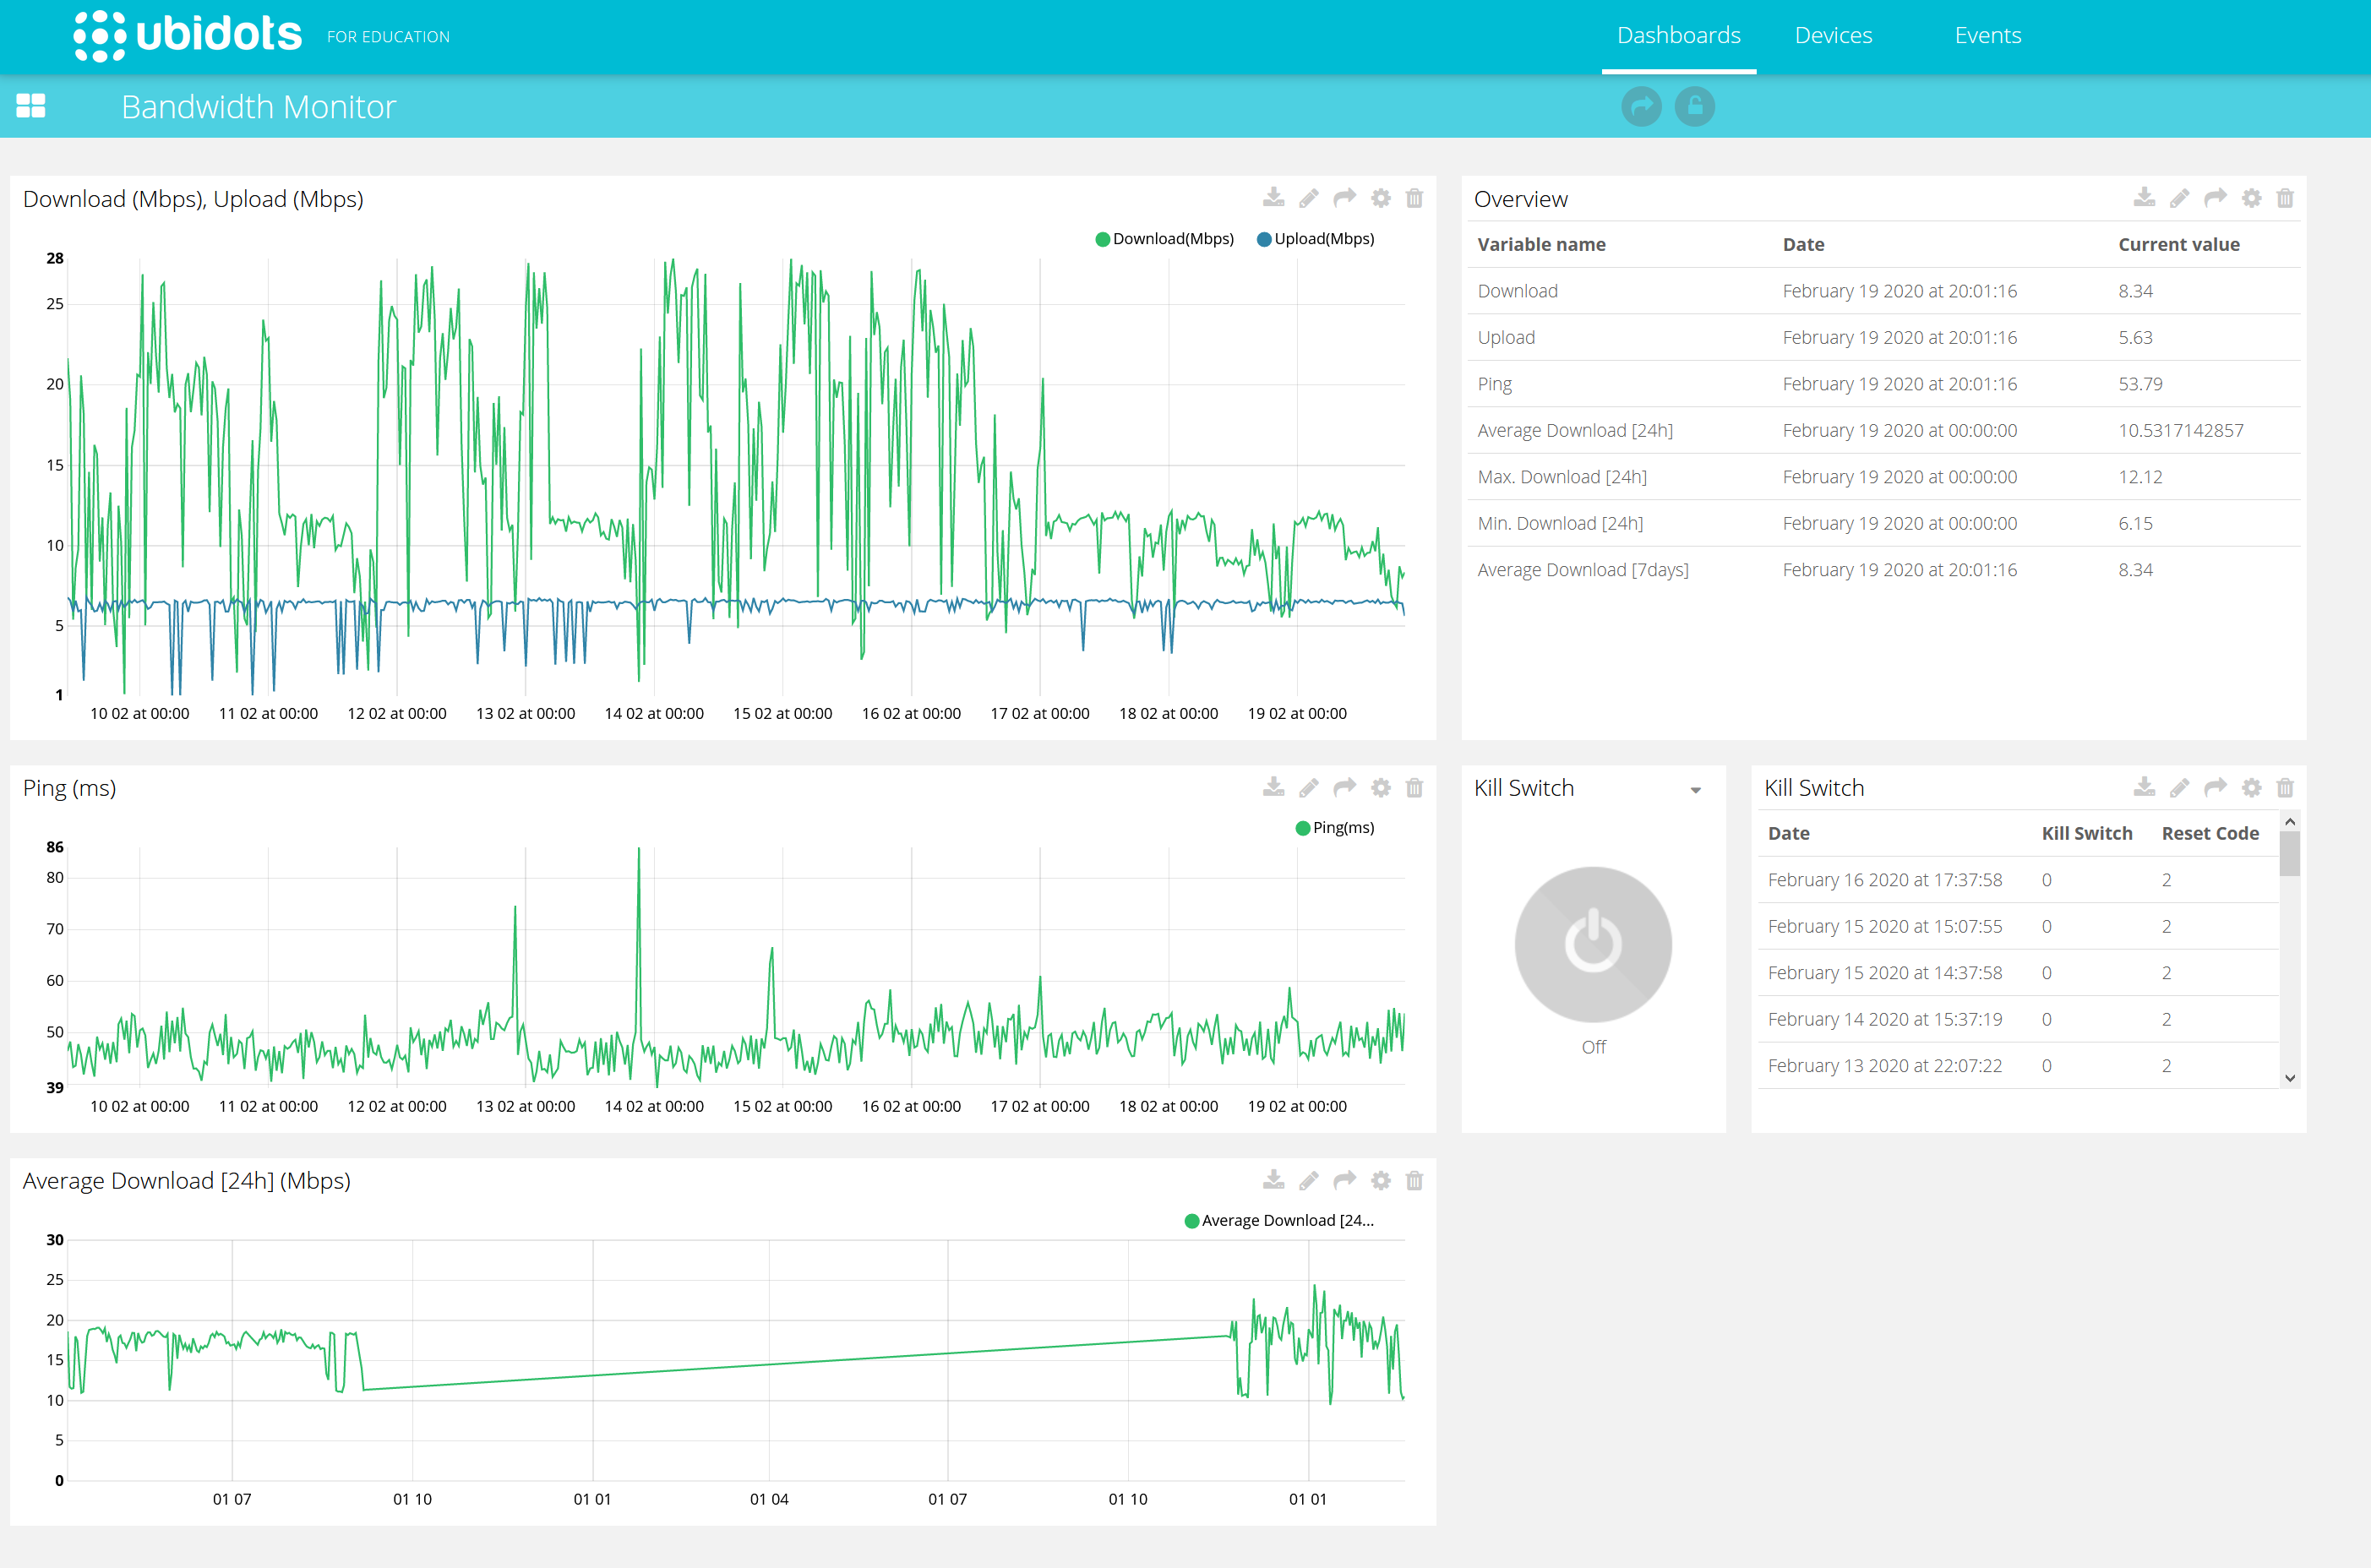
- The measured values are displayed on a Ubidots Dashboard (IOT Portal). In the overview you can also see the time history of the measured values and the reasons for the last resets.
- In the IOT Portal you can also find a button to remotely reset the modem.
- The Bandwidth monitor uses the power supply of the modem. No additional supply needed. The relais interrupts the forwarding of the power supply to the modem - the raspberry remains switched on.
Wiring
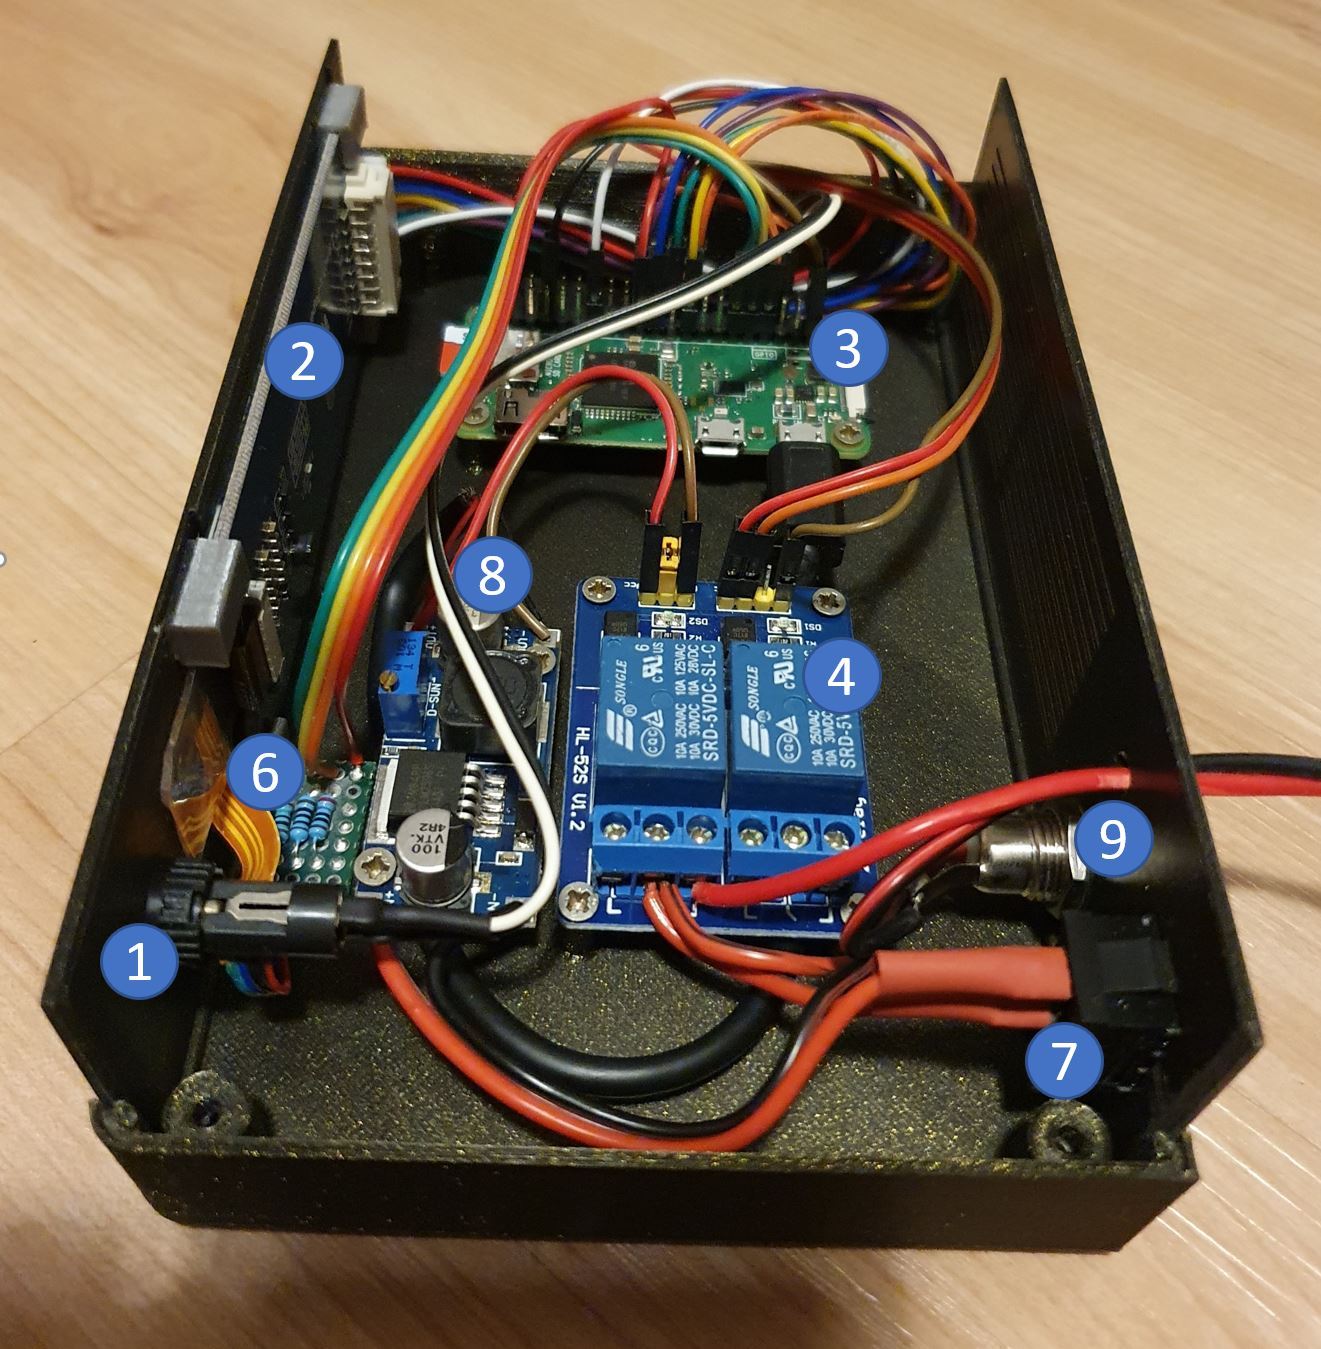
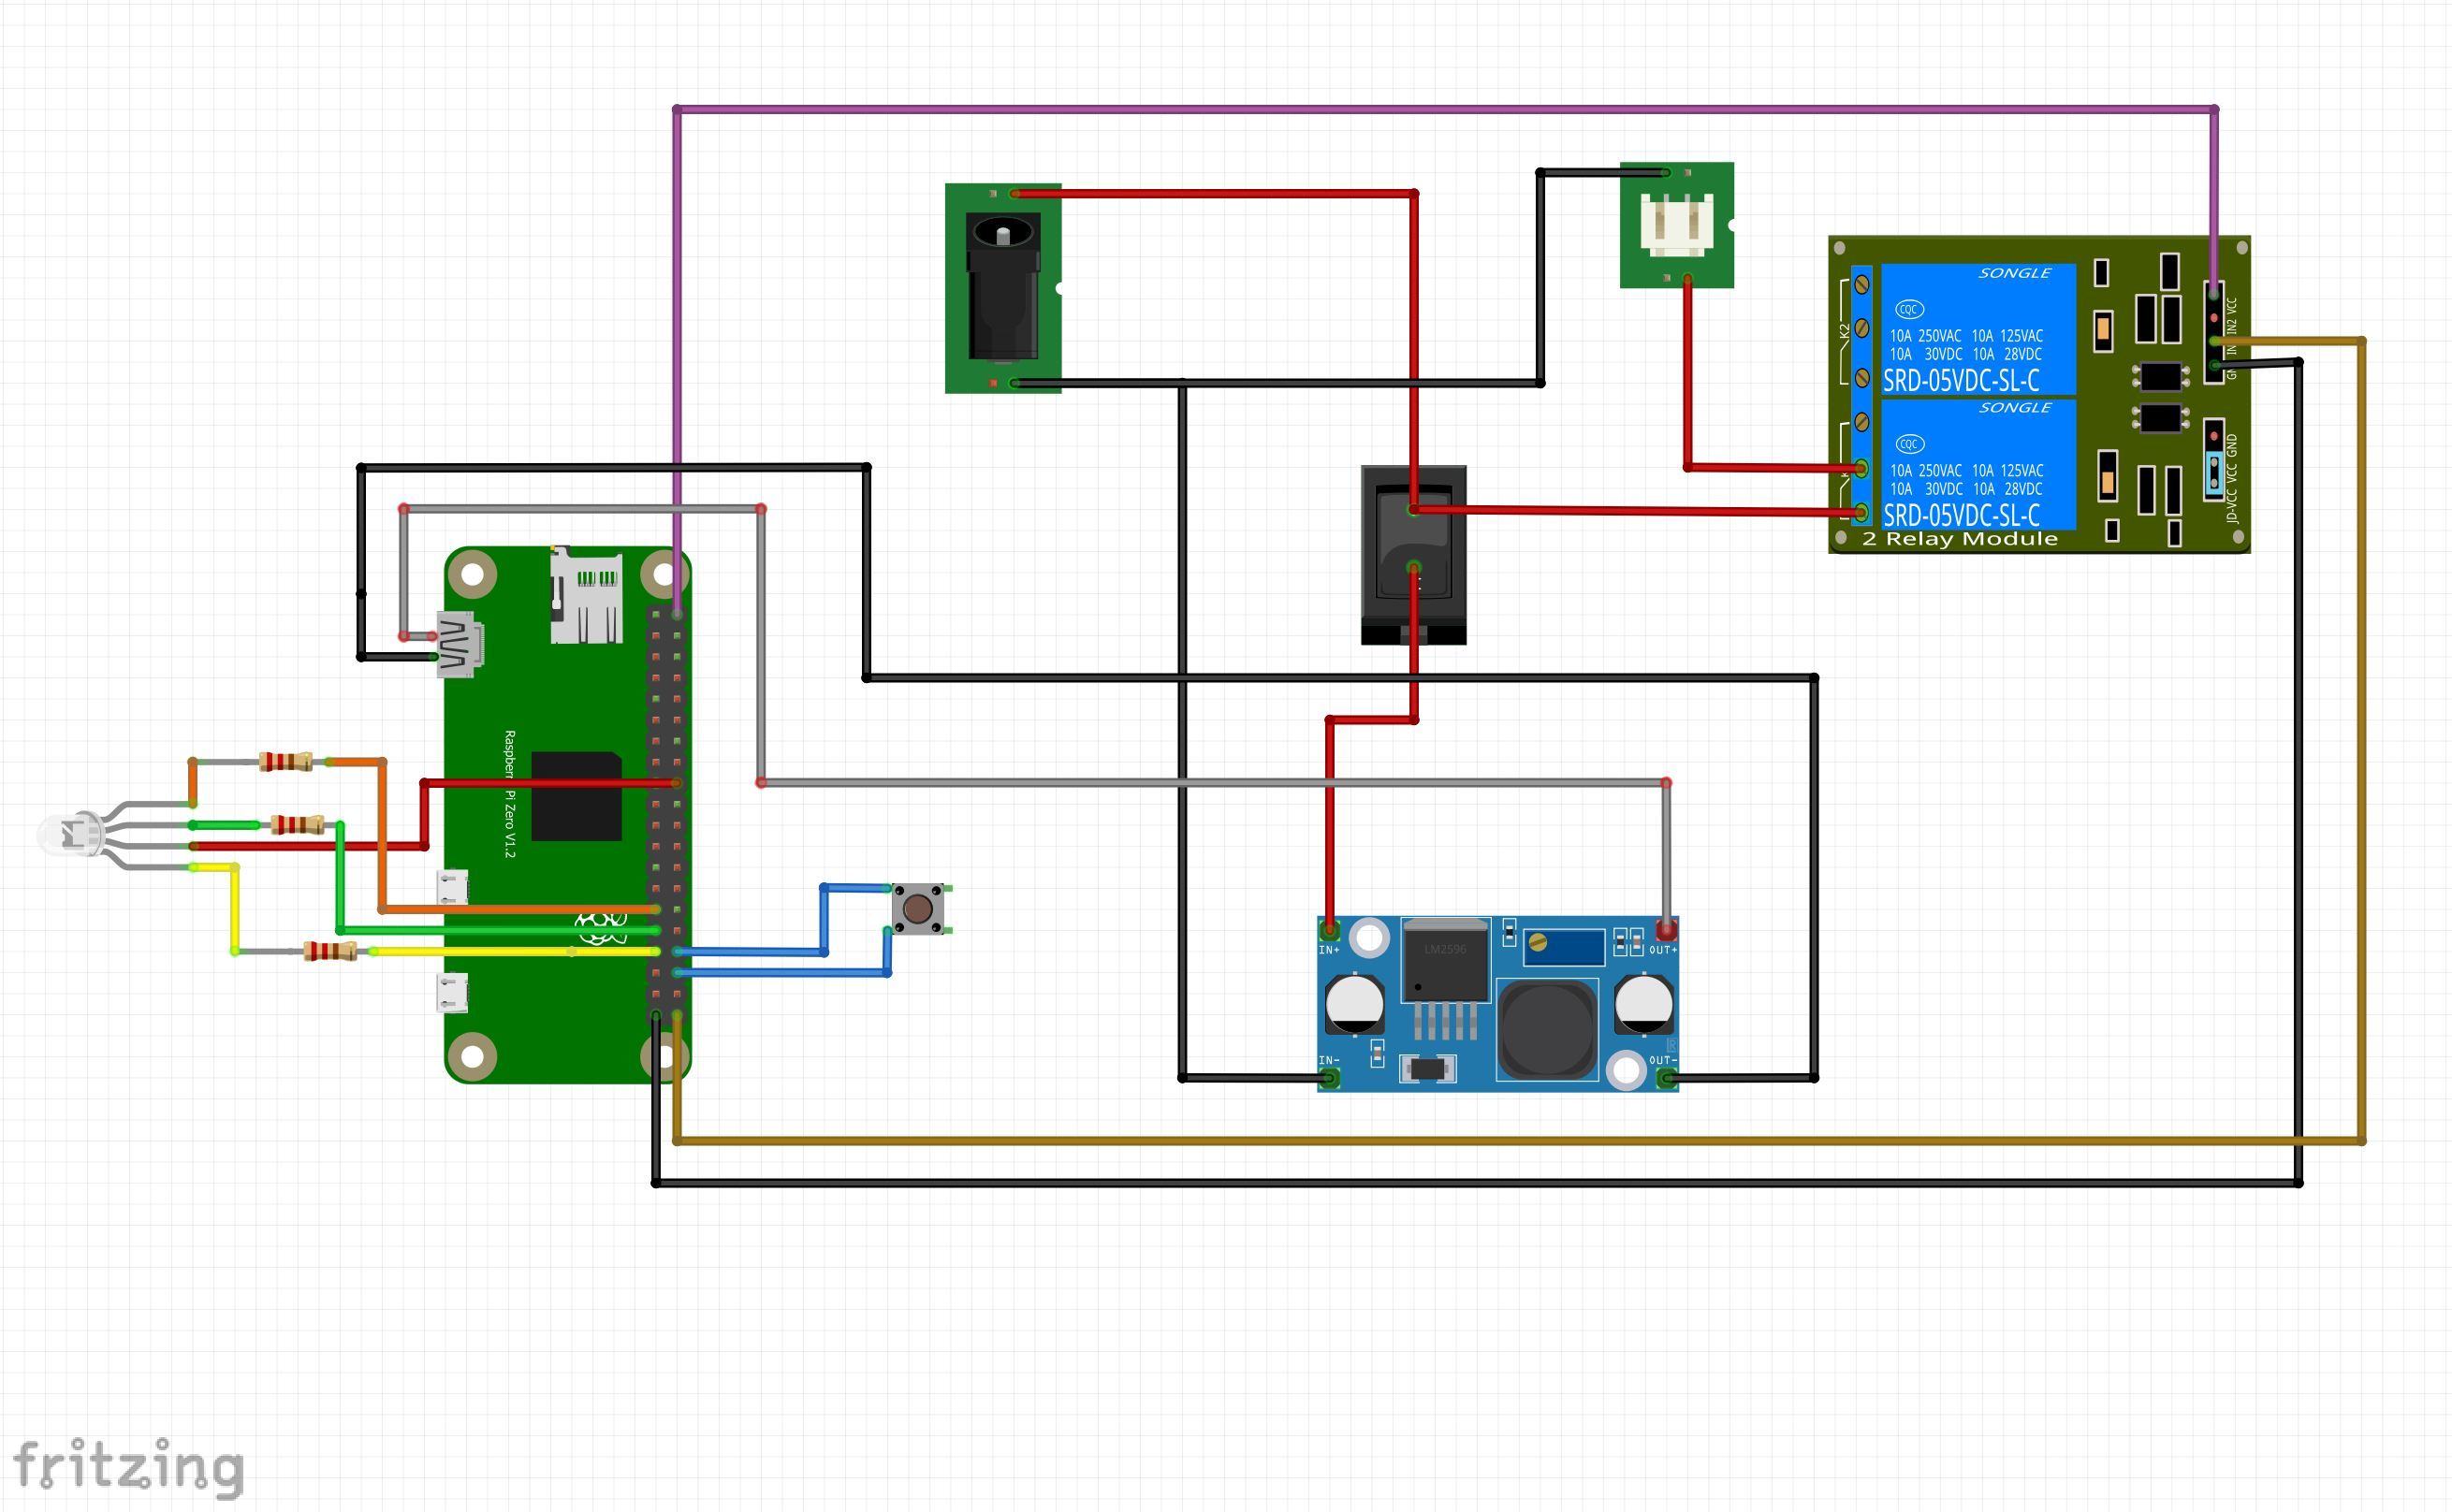

In the first picture you can see the internal design of the bandwidth monitor:
The major components are:
- Push button
- E-ink Display
- Raspberry Pi Zero
- Relay Module
- RGB LED + Resistors (depending on the RGB LED you use)
- Switch
- DC-DC Converter
- Female connector
The second picture shows a schematic of the wiring. The positive pole of the supply voltage is fed via the switch to the DC-DC voltage converter (which converts the 12V supply voltage of the router to 5V for the Raspberry) and via the relay (via the normaly-connected pin) back to the output connector. Thus the modem is also supplied with power when the bandwidth monitor is switched off.
The bandwidth measurement can be started manually via a button. A RGB LED is used to visualize the various operating states.
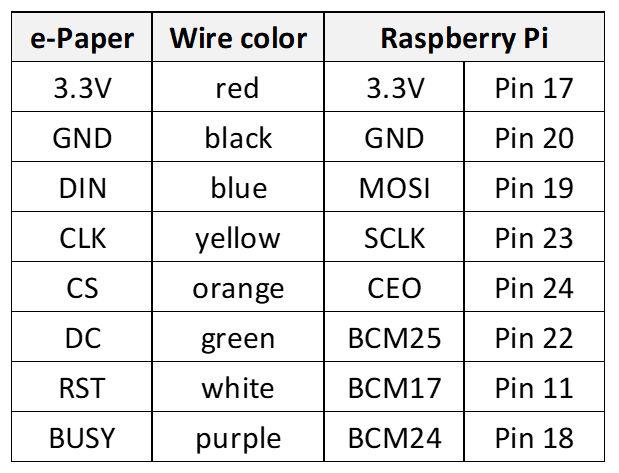
The connection between Raspberry Pi and e-ink display is not shown in the circuit diagram. Connect the display according to the table and the pin-out above.
3D Printing and Building the Chase
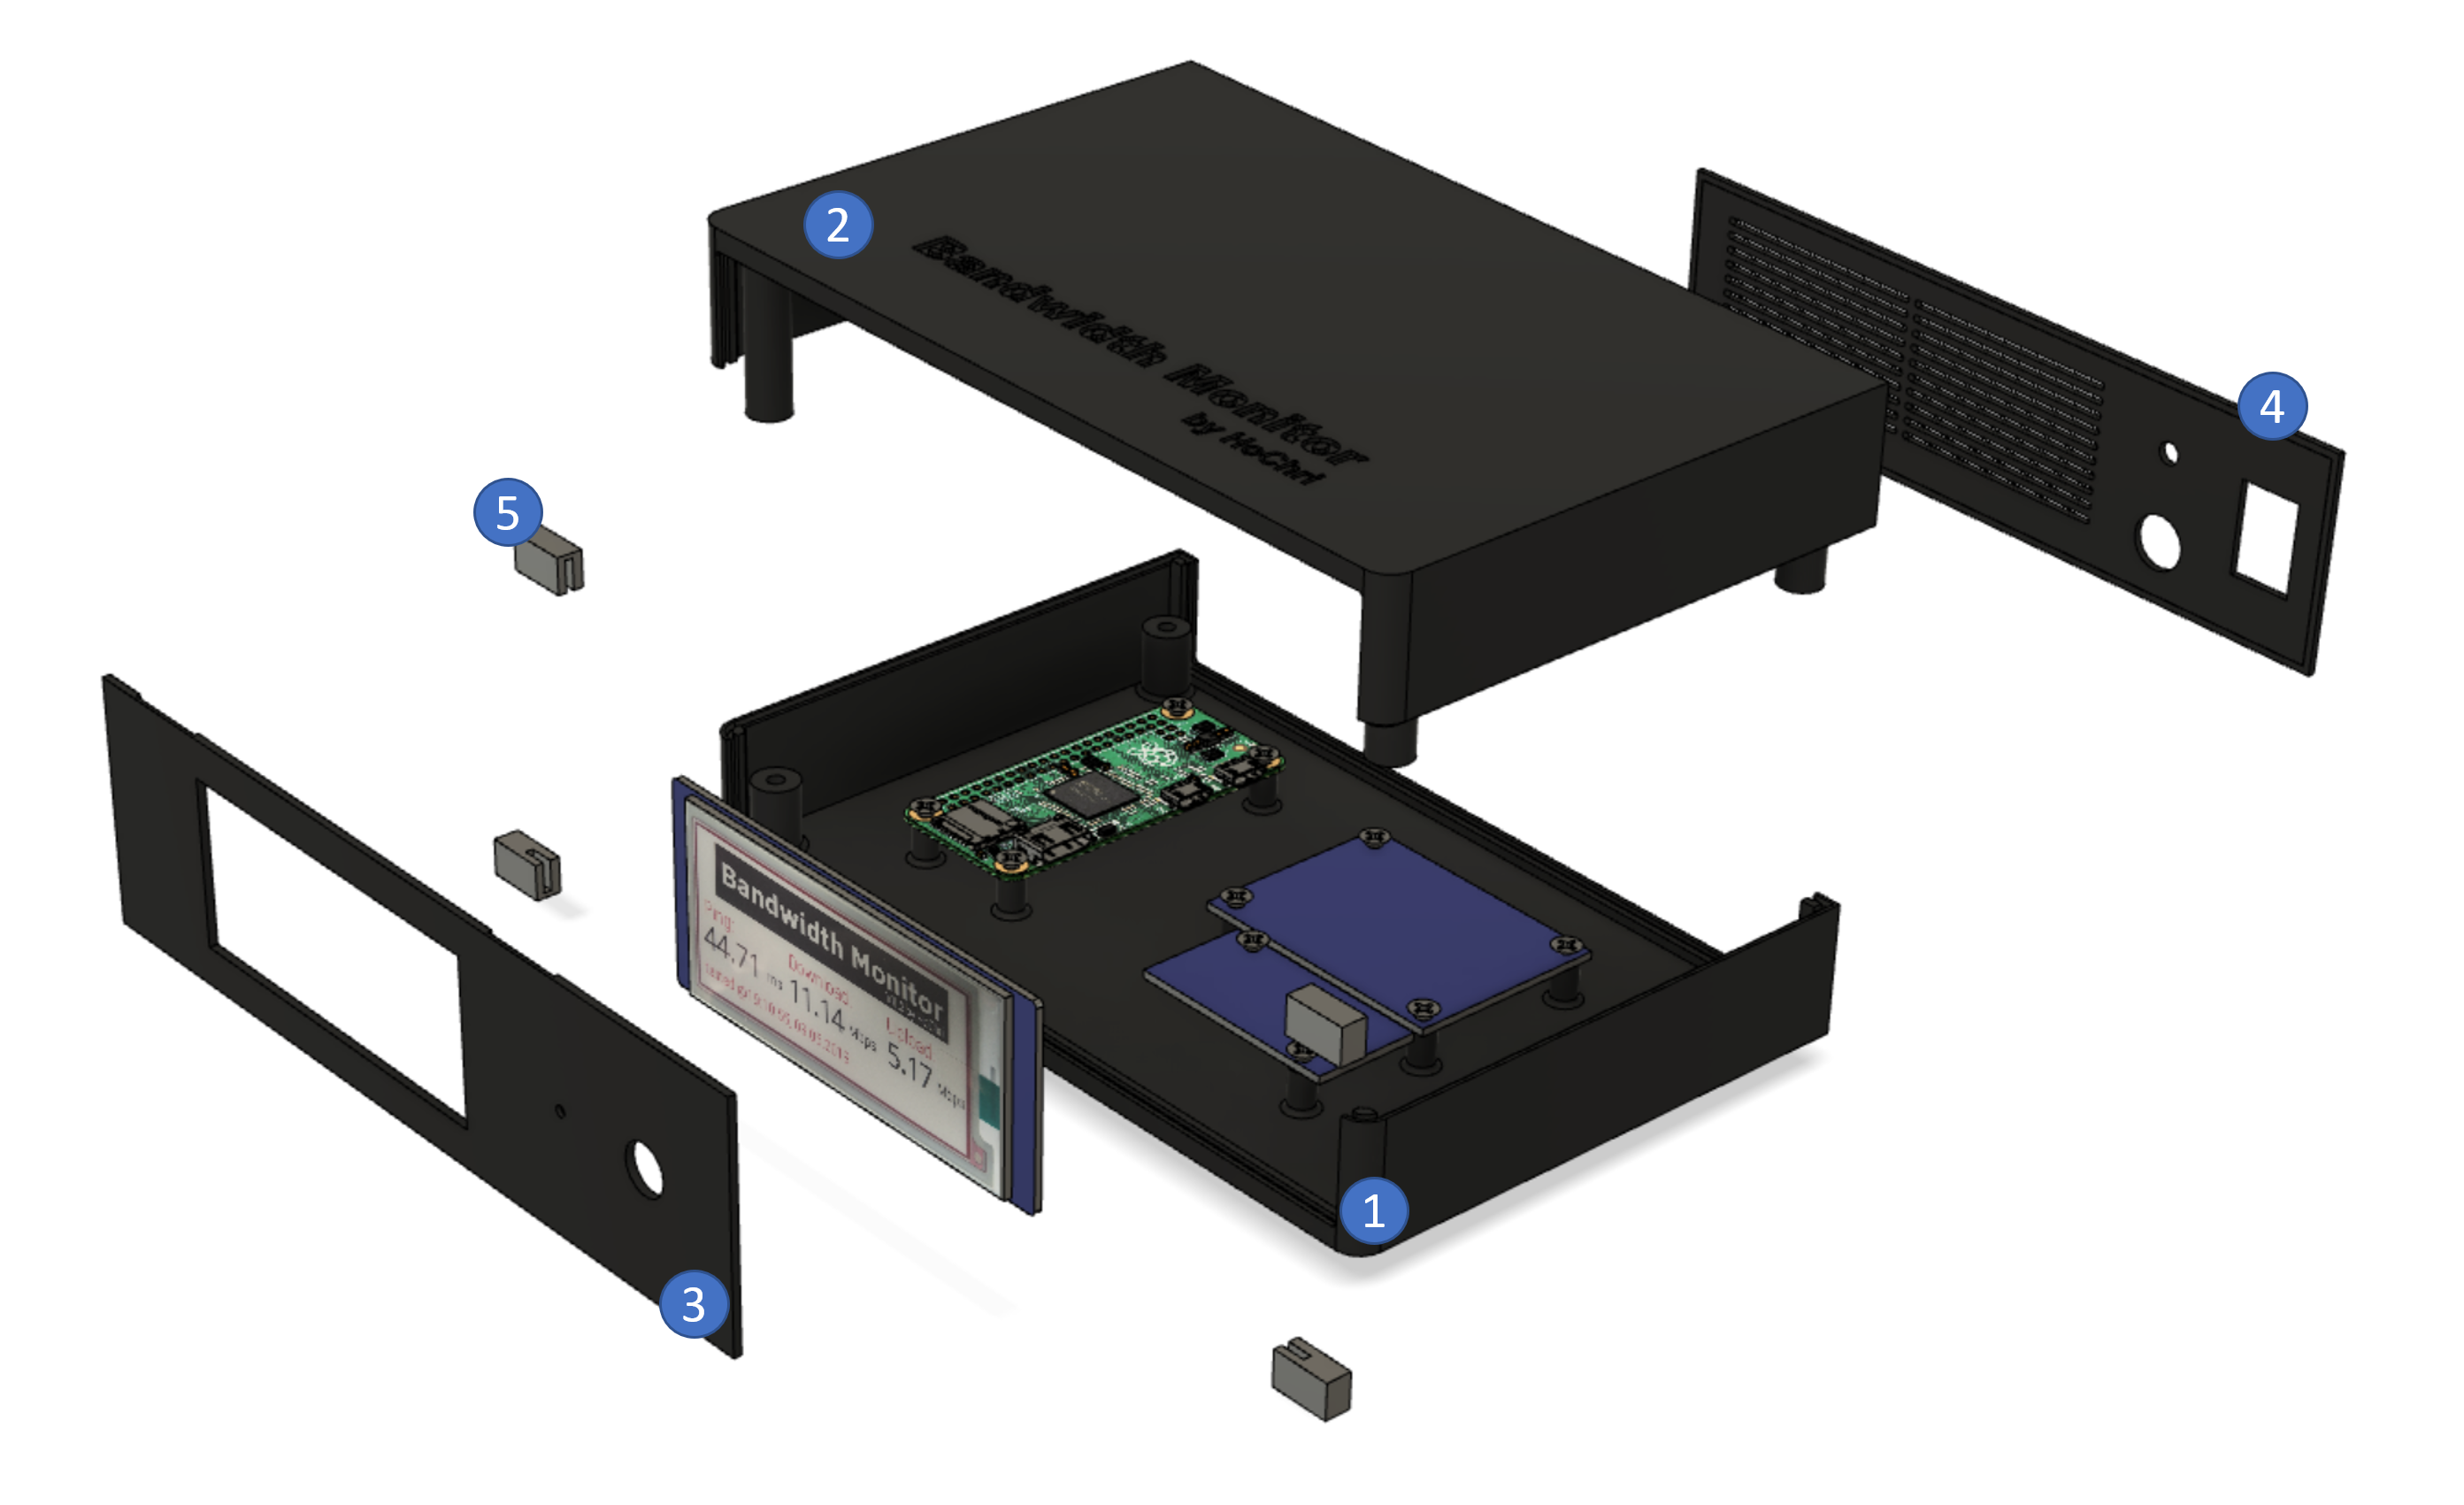
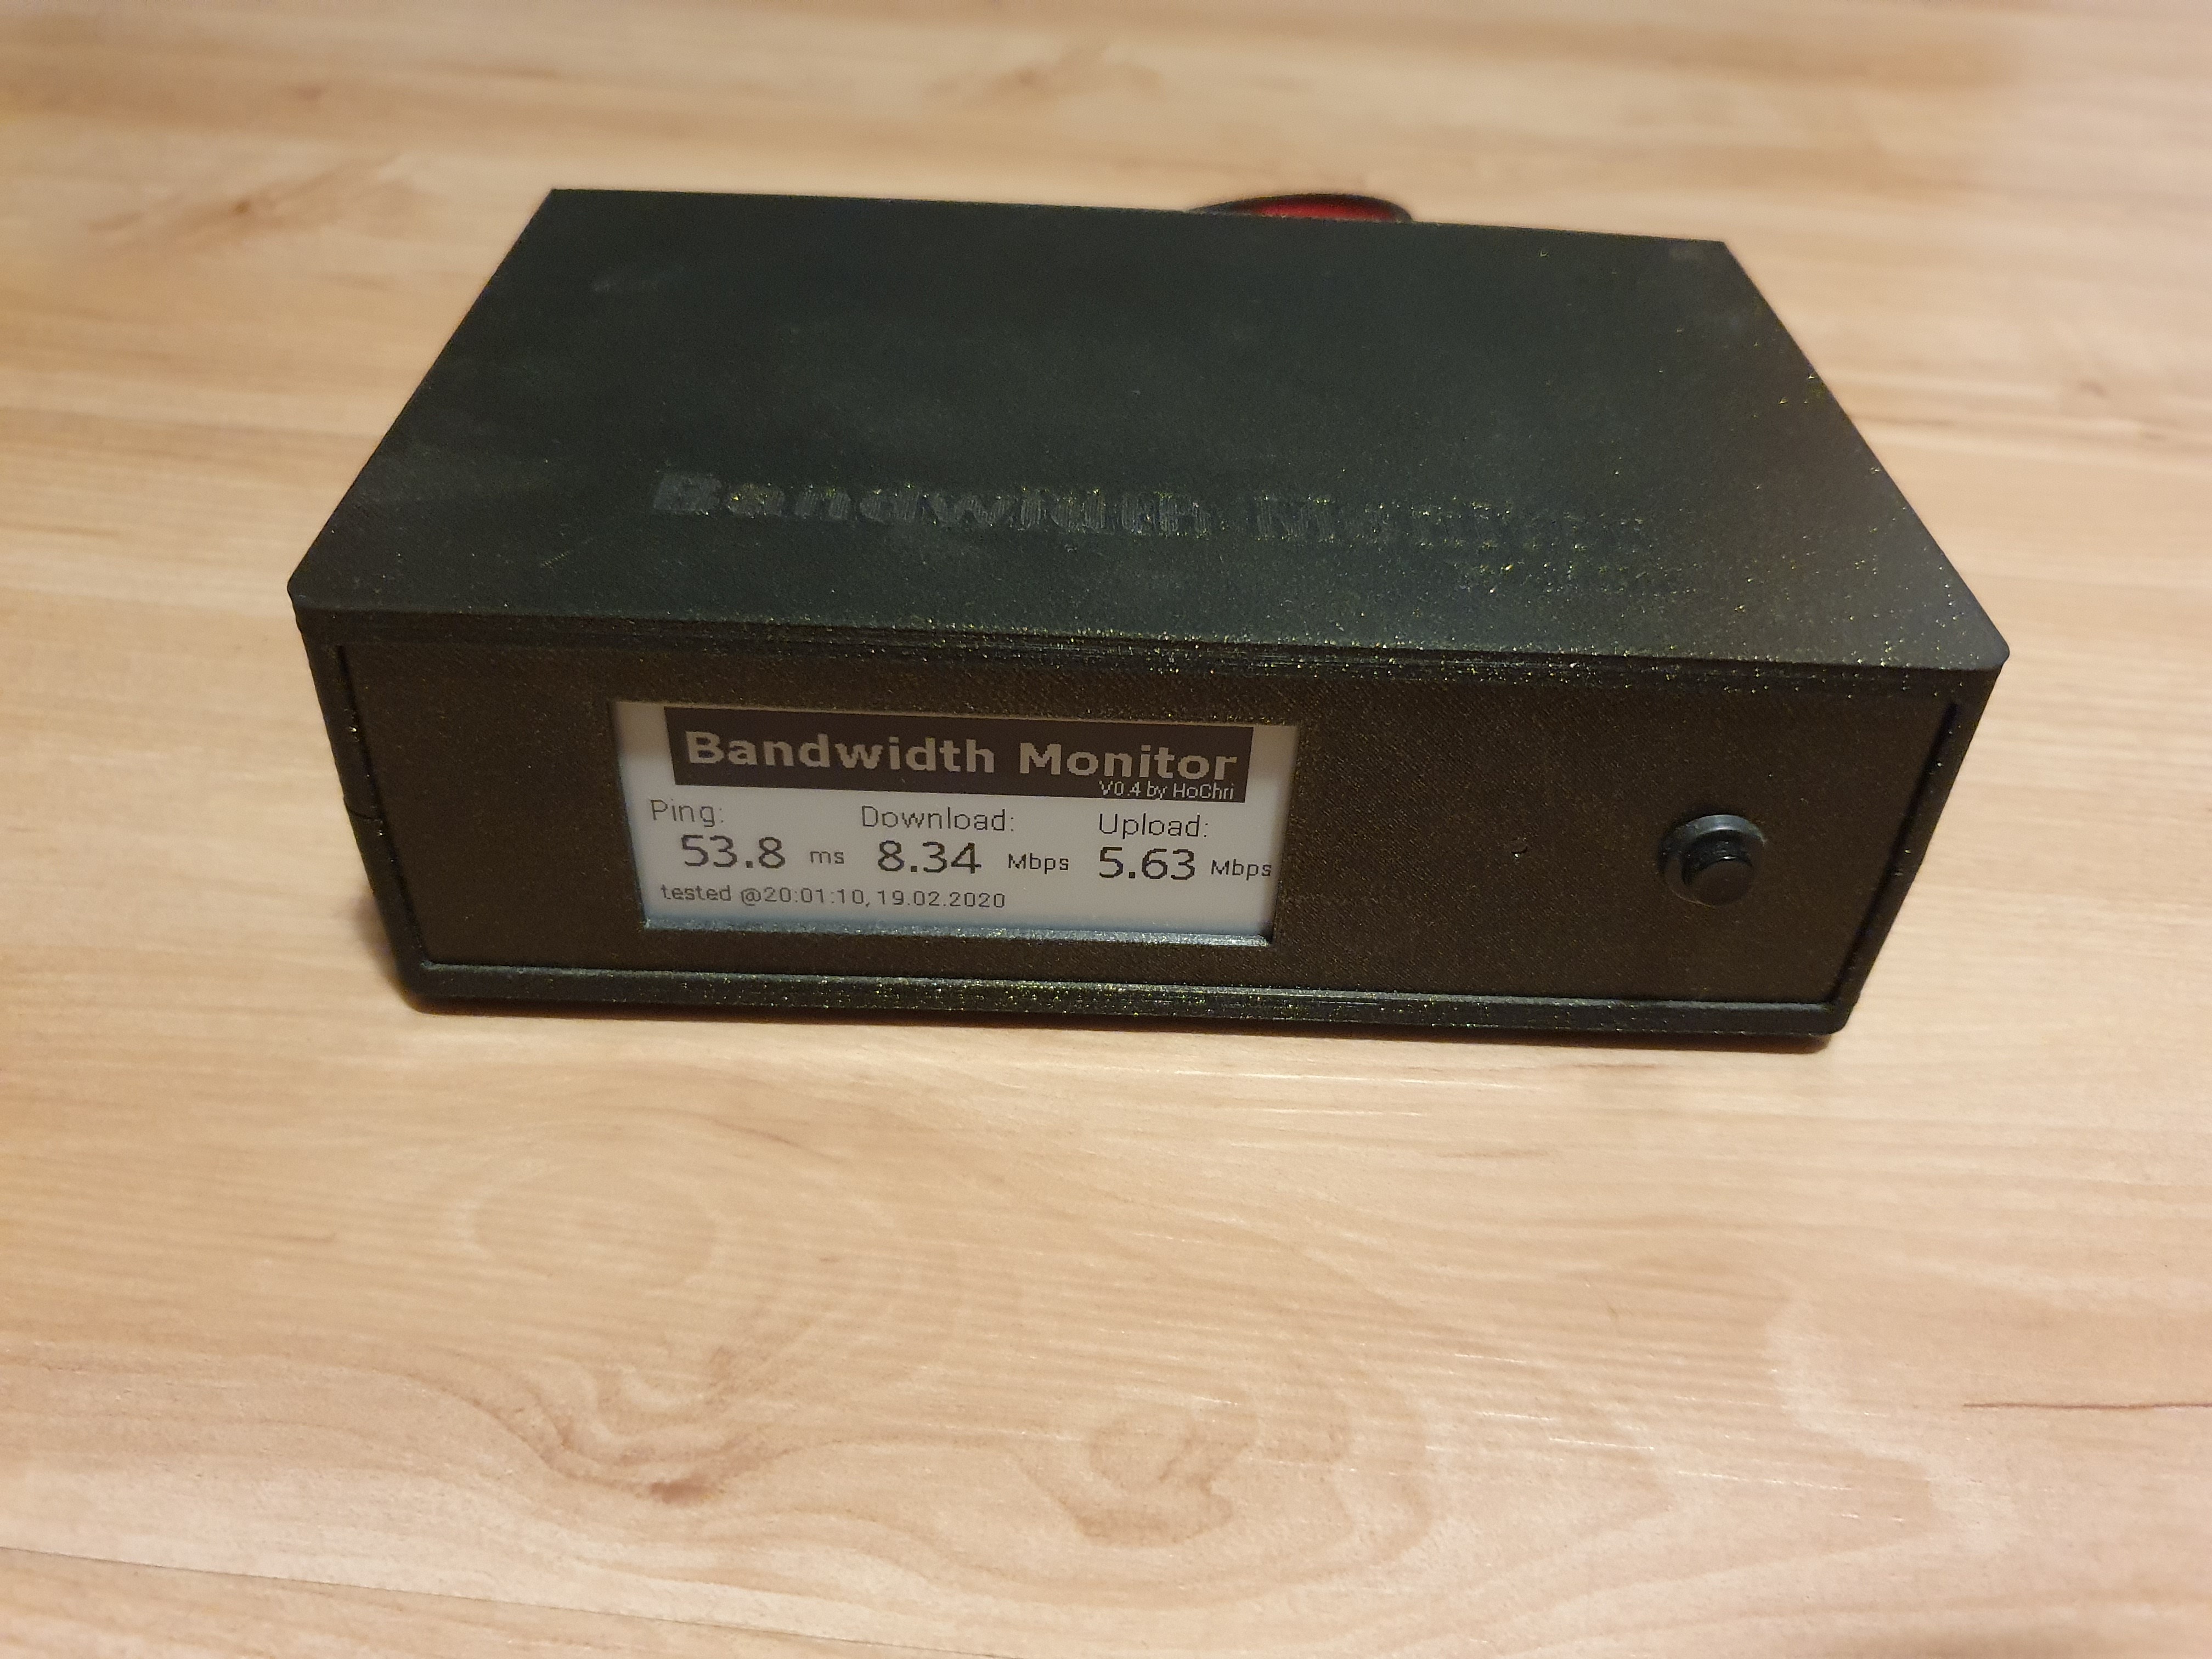
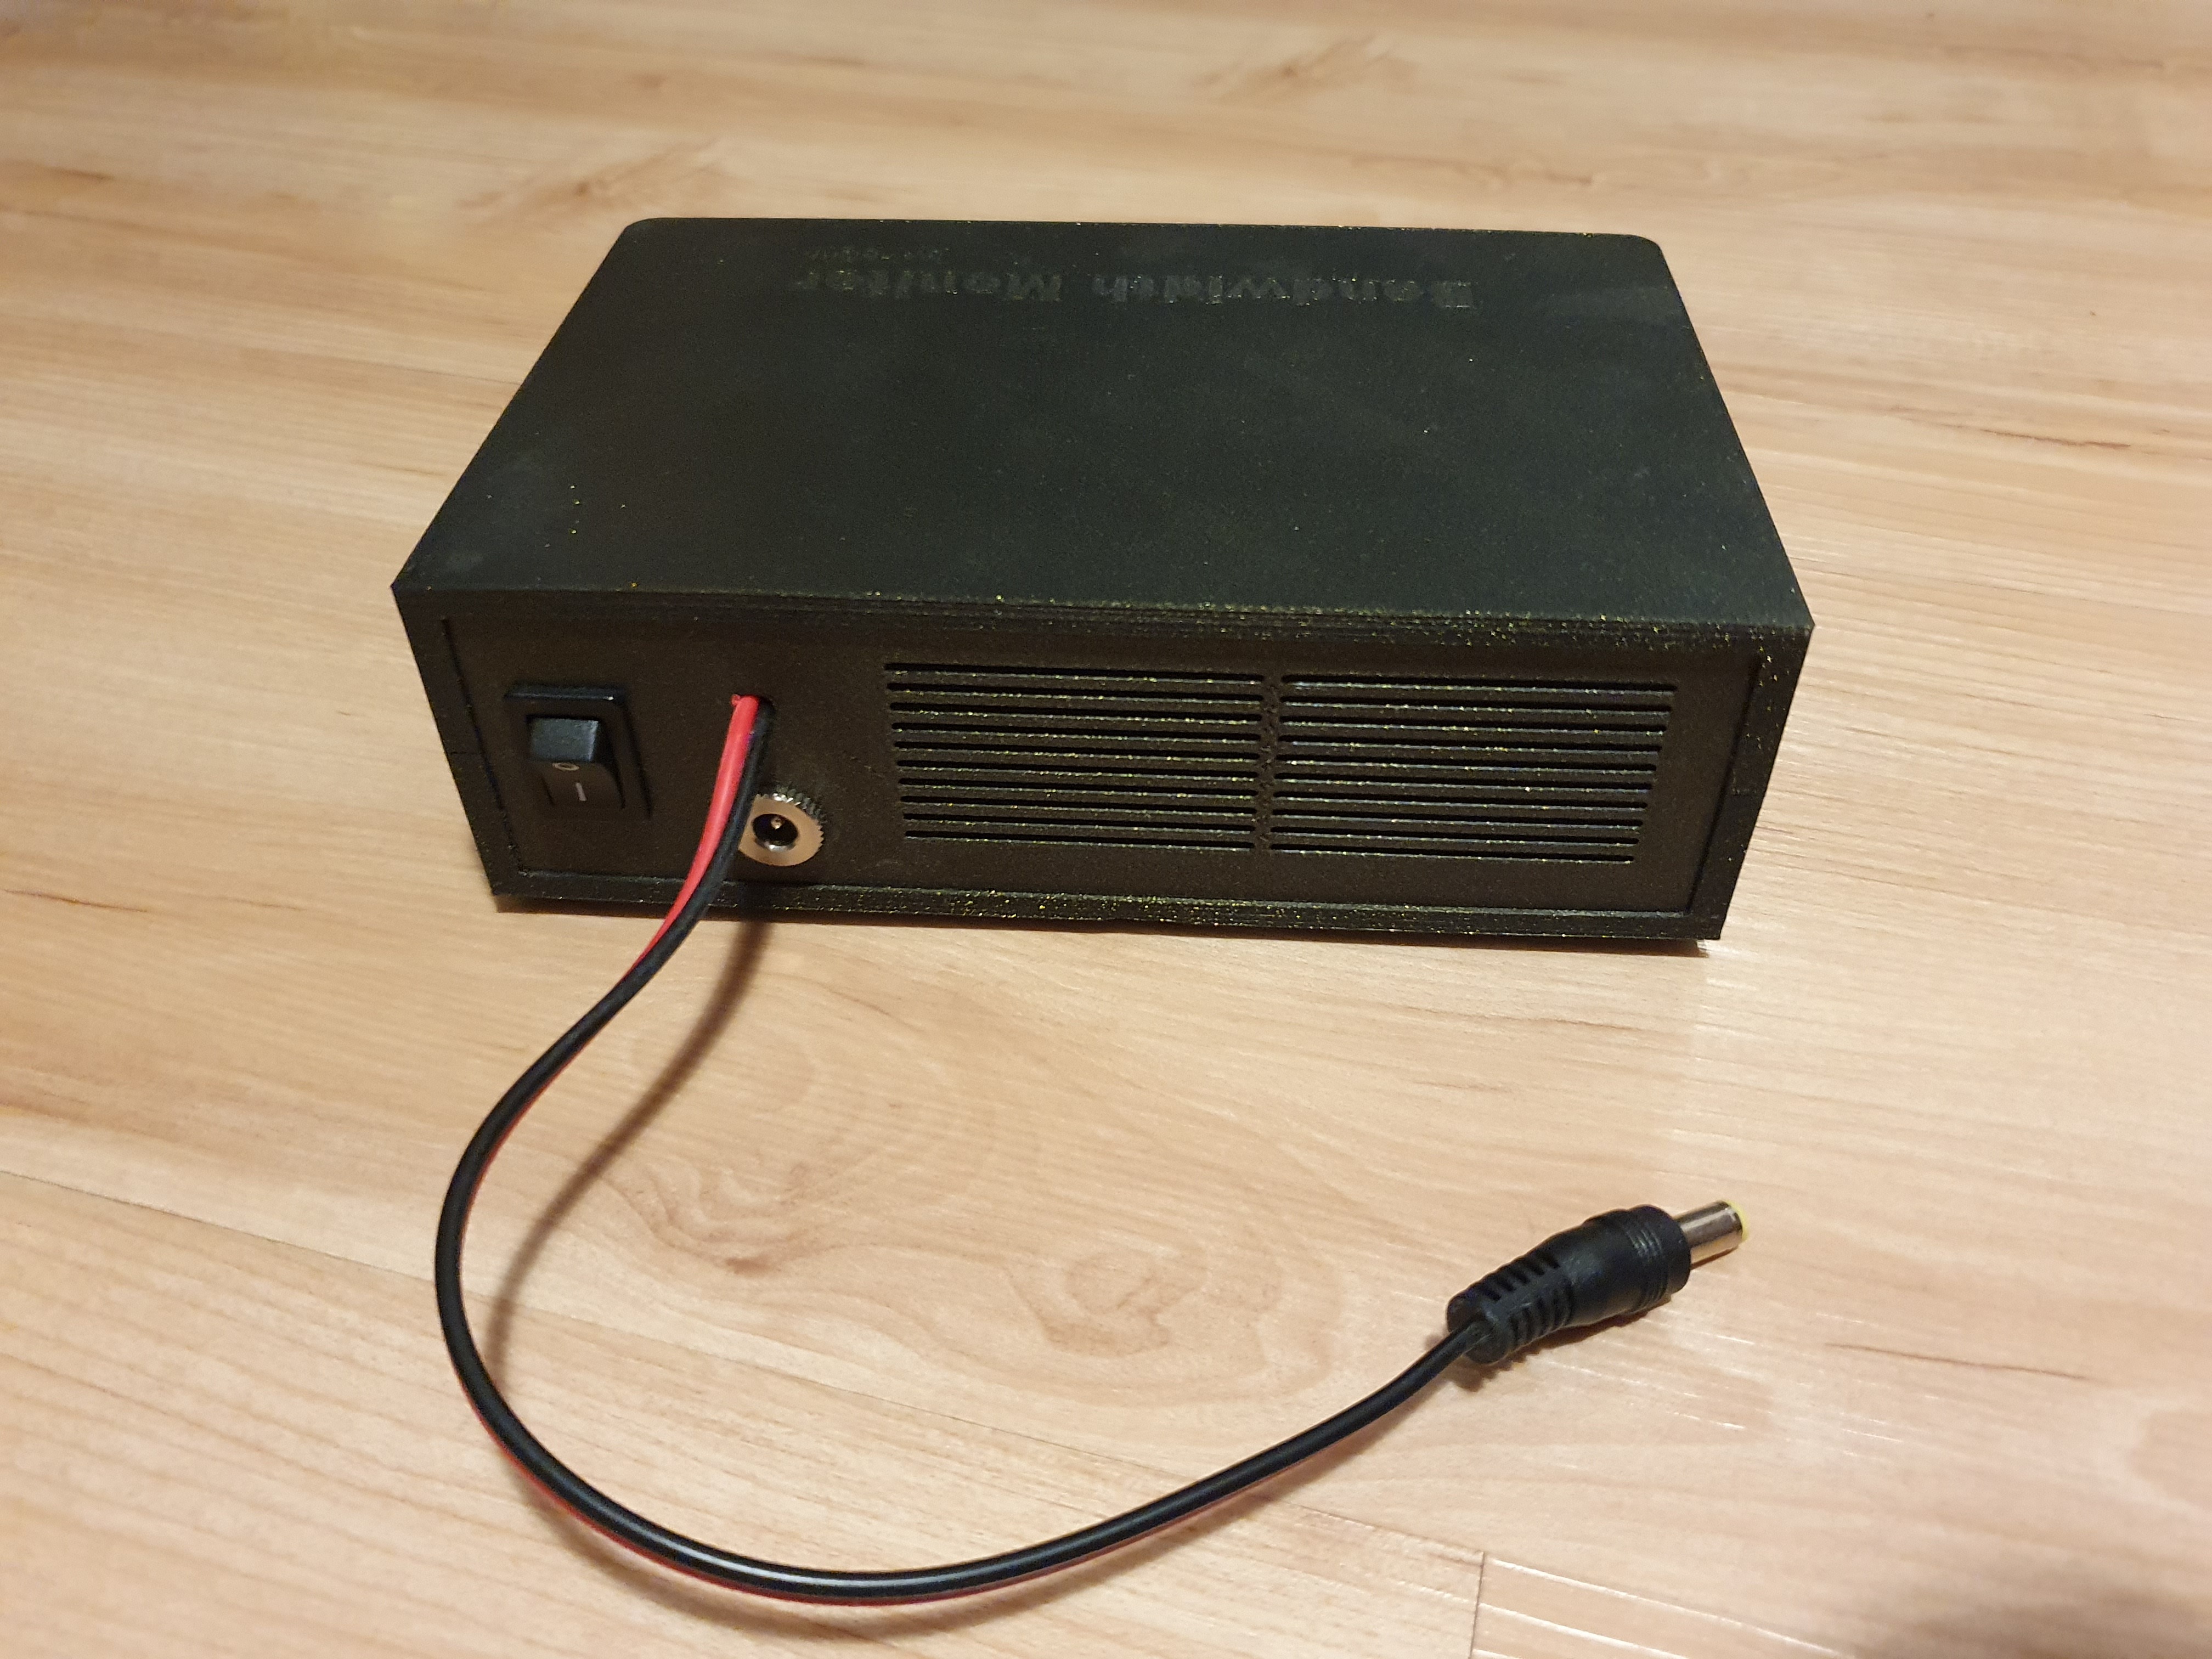
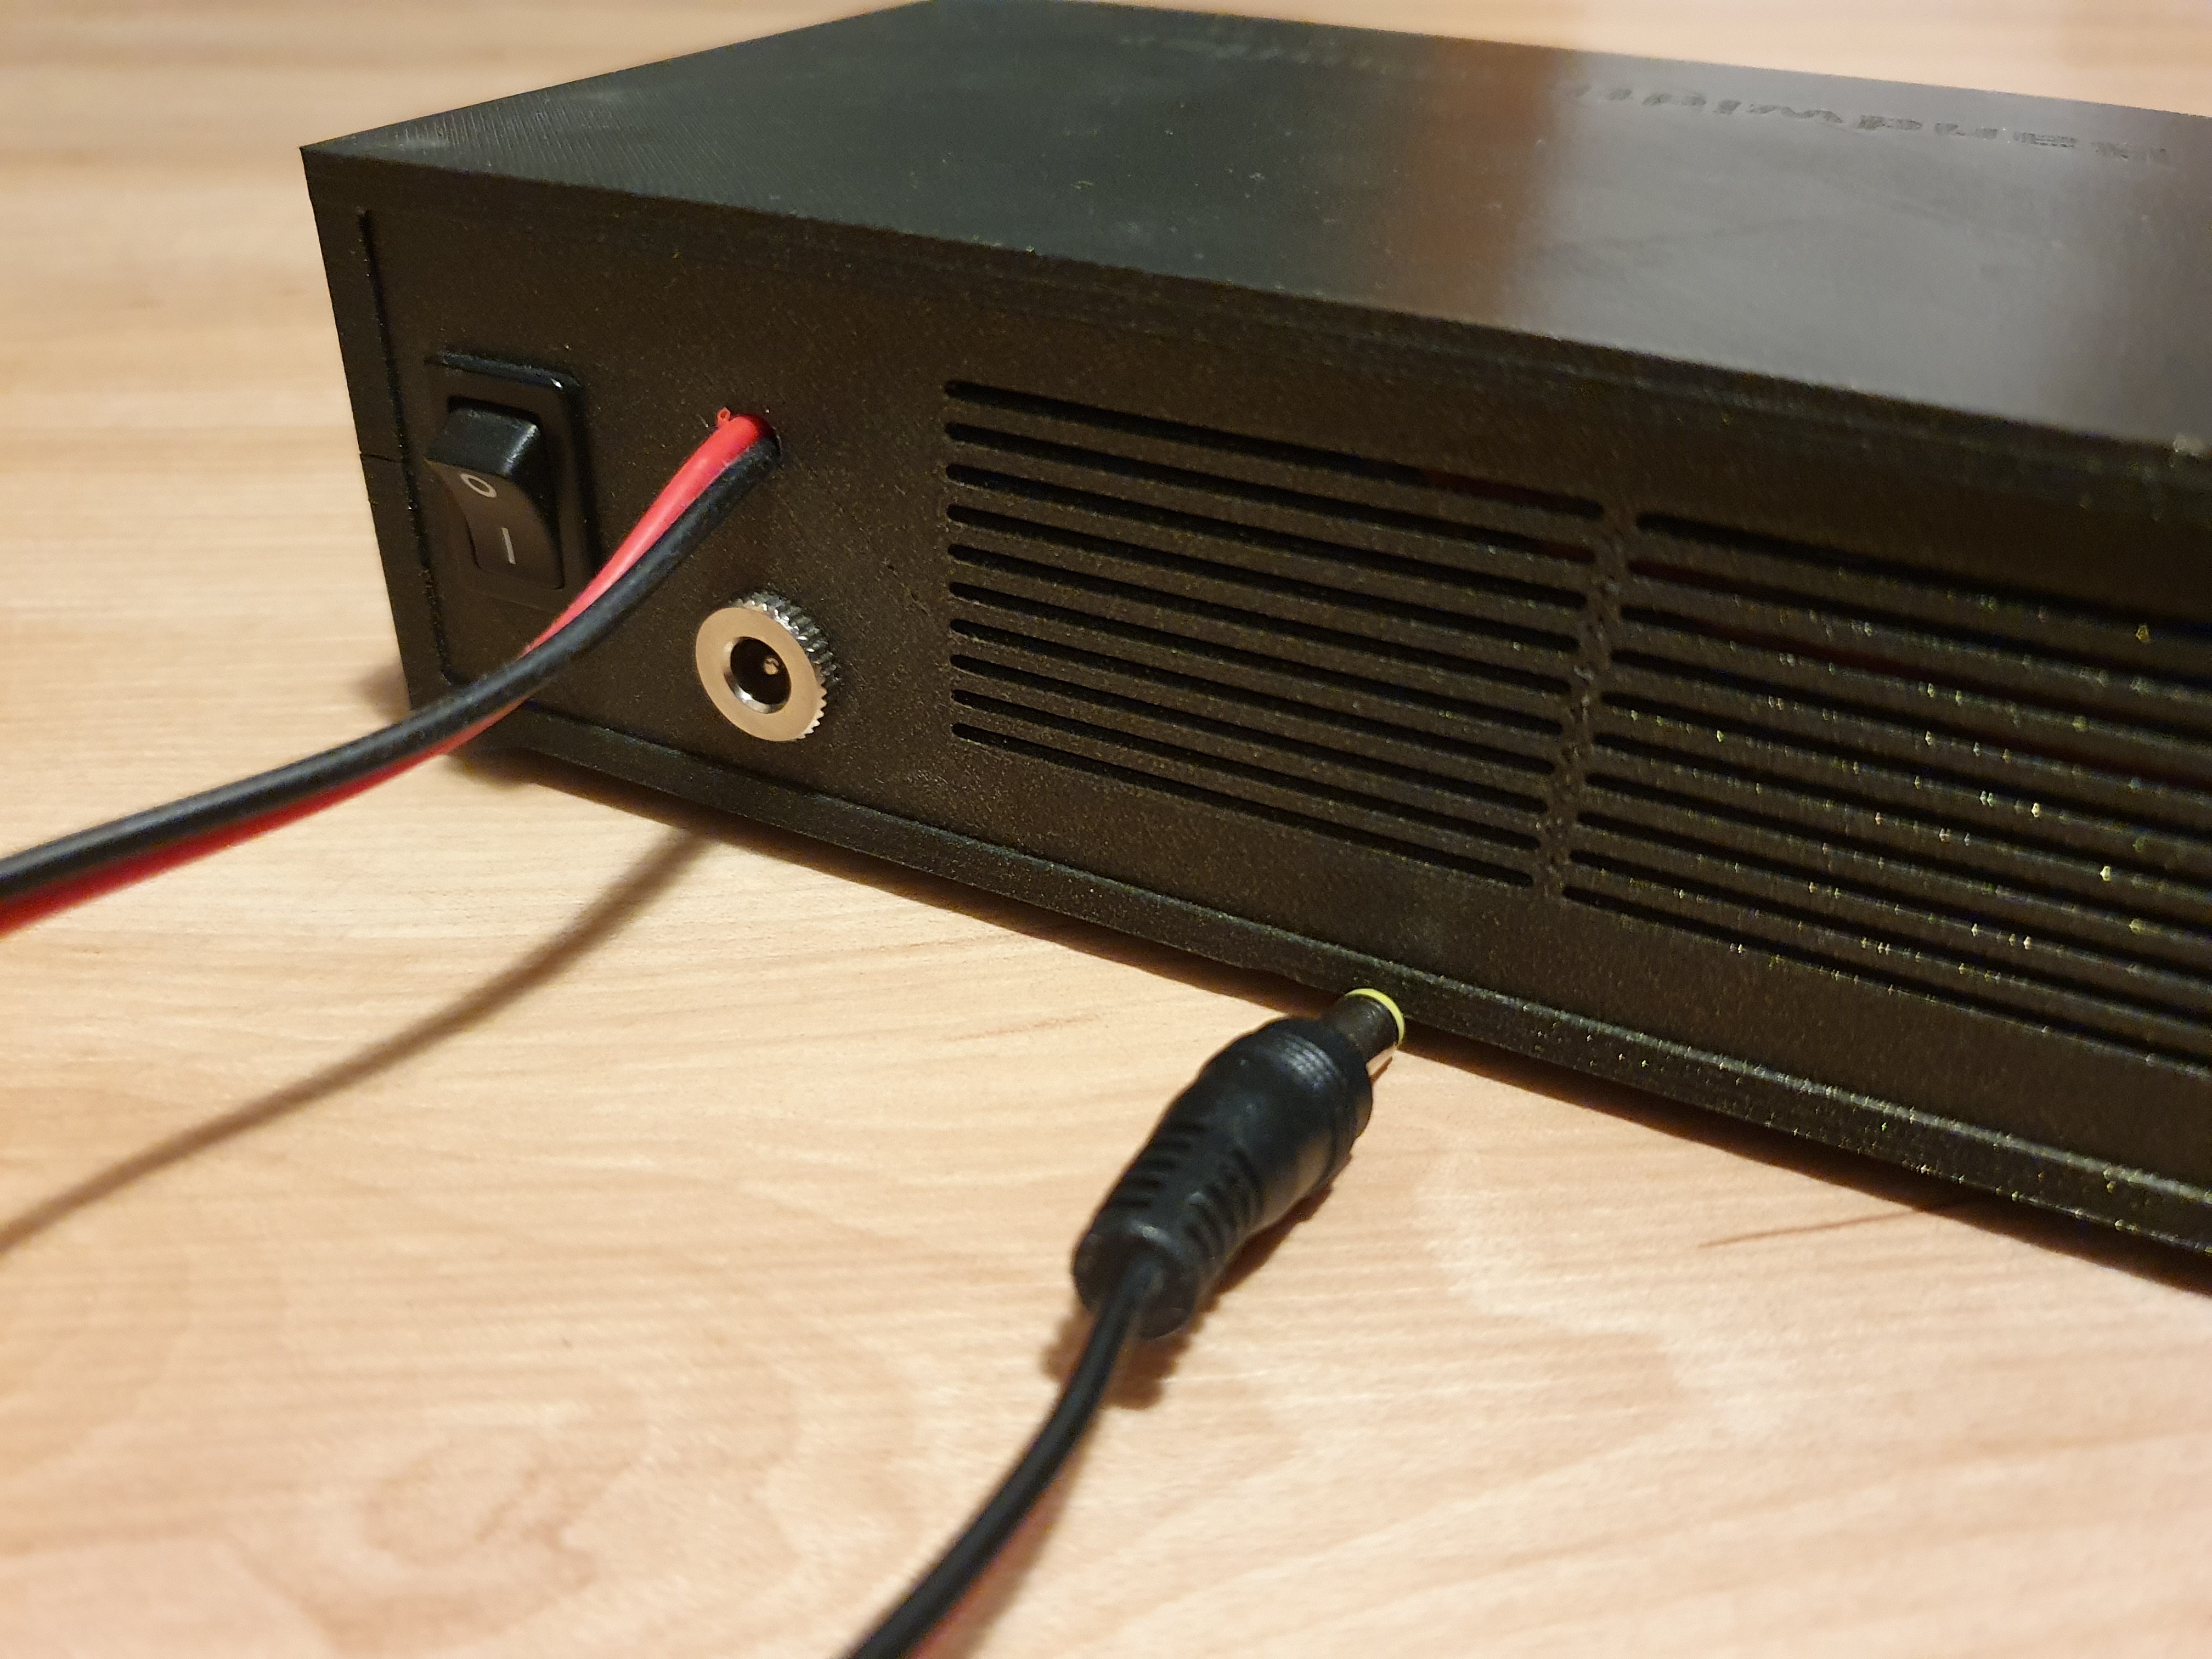
The following parts are needed for the case (see picture above):
- lower part
- upper part
- front
- back
- 4x mount
All the parts can be printed without supports. You also can find the files and some of my other designs on Thingiverse: https://www.thingiverse.com/thing:4173579.
The display can be attached to the front panel with the mounts and a doublesided tape. Button switch and femal connector are screwed to the back- and rear panel. I used 3x20mm screws to connect the two halves of the housing. The tolerances on the grooves for the front and rear panels are relatively tight. If necessary, the front and rear panels must be sanded on the edge (on the inside to avoid destroying the surface).
Setting Up the Raspberry PI
This setup guide is based on compiling several installation instructions from different sources (e-Ink display manufacturers,...). For me the instructions have led to the desired result. Since I am not a Linux expert, no optimizations or similar were done. I am aware that there are surely better and more efficient solutions.
Lets assume you already have Raspbian installed on your Pi (there are many tutorials on how to install the basic operation system) and you have a display (via miniHDMI), mouse and keyboard connected. A correctly set up WLAN connection to the router or the Internet is also assumed. Unless otherwise stated, all installation procedures are performed in the terminal.
Install Remote desktop (to access the PI from your computer):
sudo apt-get update
sudo apt-get
install xrdp
or you can also work headless via ssh (see e.g. https://desertbot.io/blog/headless-raspberry-pi-3-bplus-ssh-wifi-setup)
Change Password:
https://www.raspberrypi.org/forums/viewtopic.php?t=193620
Install speedtest:
sudo
apt-get install python-pip
sudo pip install speedtest-cli
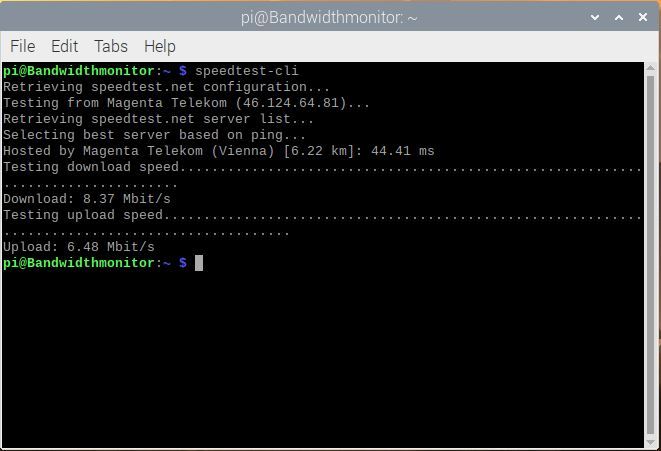
to test if installation was successful run Speedtest in the terminal:
speedtest-cli
if everthing is correct you should get something like in the first picture above.
Install wiringPI
sudo apt-get install git-core
git clone git://git.drogon.net/wiringPi
cd wiringPi
./build
(see also https://projects.drogon.net/raspberry-pi/wiringpi/download-and-install/)
Alternativ:
sudo apt-get install wiringpi
(see http://wiringpi.com/download-and-install/)
Install BCM2835
(see http://www.airspayce.com/mikem/bcm2835/)
Download bcm2835-1.60.tar.gz (or a newer version if available)
tar zxvf bcm2835-1.60.tar.gz
cd bcm2835-1.60
./configure
make
sudo make check
sudo make install
Install the Python imaging library
sudo apt-get install python-imaging
Alternativ:
sudo apt-get install python-pil
Enable the I2C function.
Run the following command to configure your Raspberry Pi board:
sudo raspi-config
Select Interface Options-> I2C -> yes, to start up the I2C core driver. Then you also need to modify the configuration file. Run the following command to open the configuration file:
sudo nano /etc/modules
Add the following two lines to the configuration file
i2c-bcm2708
i2c-dev
See also https://www.waveshare.com/wiki/Pioneer600#Libraries_Installation_for_RPi
Enable the SPI function:
Run the following command to configure your Raspberry Pi board:
sudo raspi-config
Select Interface Options-> SPI -> yes, to start up the SPI core driver.
Install additional fonts:
sudo apt-get install ttf-mscorefonts-installer
Download and install Fonts (Roboto + Droid)
gksudo
pcmanfm
To start filemanager with root privilegs and copy truetype fonts into folder /usr/share/fonts/truetype
Alternativ:
Copy the fonts to the Downloads folder with WinSCP (ssh must be enabled to use WinSCP)
sudo cp -r /home/pi/Downloads/droid /usr/share/fonts/truetype
sudo cp -r /home/pi/Downloads/roboto /usr/share/fonts/truetype
You need root privilegs to access the font folder. Maybe there are better ways to do this (as alread mentioned I am not a Linux expert) but both ways worked for me.
Python files:
Use the filemanger to create a new folder "bandwidth_monitor"
Copy all files to directory bandwidth_monitor
Make python files and script executable
chmod +x *.py
chmod +x speedtest-cron.sh
Configure crontab
crontab -e
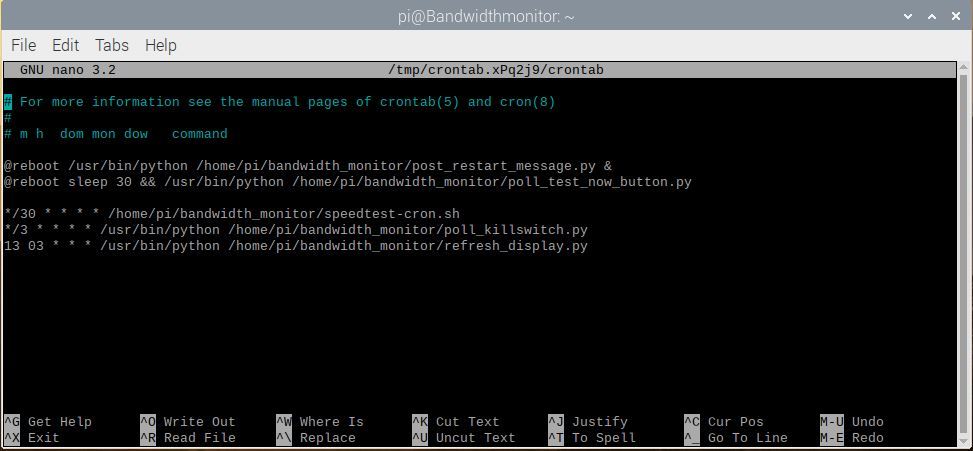
Crontab is used to schedule program execution e.g. speedtest every 30 min. Add the following lines to your crontab (see also second figure):
@reboot /usr/bin/python /home/pi/bandwidth_monitor/post_restart_message.py &
@reboot sleep 30 && /usr/bin/python /home/pi/bandwidth_monitor/poll_test_now_button.py

*/30 * * * * /home/pi/bandwidth_monitor/speedtest-cron.sh
*/3 * * * * /usr/bin/python /home/pi/bandwidth_monitor/poll_killswitch.py
13 03 * * * /usr/bin/python /home/pi/bandwidth_monitor/refresh_display.py
Description of the scheduled tasks:
- at reboot the restart message is written to the IOT dashboard
- at reboot the poll test_now_button is started
- every 30 minutes a bandwidth measurment is performed
- every 3 minutes the status of the remote reset button (on the IOT dashboard) is checked
- once a day a display refresh cycle is started.
See software section for a brief description of the programs.
Software

The software is split into several files / programs:
bandwidth_monitor_0_4.py is the main program that is invoked by Crontab every half hour. It performs a bandwidth test (via the command line version of speedtest.net). During the test, the RGB LED is blue. If the bandwidth is above the selected threshold, the value is shown on the e-ink display (along with a timestamp) and exported to the Ubidots dashboard. If the bandwidth is below the threshold the LED turns red and the measurement is repeated after a short delay. After 3 negative attempts the relay is activated and thus the power supply of the modem is interrupted. Reset code (value=2) is written to the log section.
poll_killswitch.py reads the status of a boolean variable on the dashboard. If killswitch_state is true the relais is activated an the power supply of the modem is interrupted. The RGB LED turns green during the polling of the killswitch. After the reset the killswitch_state is set false and an entry in the log section of the dashboard is generated (value=1).
poll_test_now_button.py is waiting for the pushbutton on the front panel of the case to be pressed . By activating the button, a bandwidth measurement is triggered manually. When the program is started (at the reboot of the Raspberry Pi) the RGB LED is blinking red.
post_restart_message.py writes the reset code (value=3) to the log section of the dashboard. This indicates that the bandwidth monitor has been restarted. During program start the RGB LED flashes blue.
test_LED.py and test_relay.py are simple scripts that can be used to test the hardware function of the RGB LED and the relay.
epdconfig.py and epd2in9.py are device driver for the e-ink display provided by Waveshare.
In order to allow the programs to access the Ubidots dashboard, you have to add your individual tokens and device or variable names (if you use different notations). Search for section like the one shown in the image above (replace XXXXXXXX by your token).
Comprehensive tutorials on how to build the dashboard and how to integrate the dashboard into a Python program can be found directly on the Ubidots page (https://help.ubidots.com/en/) or via Google.
IOT Dashboard
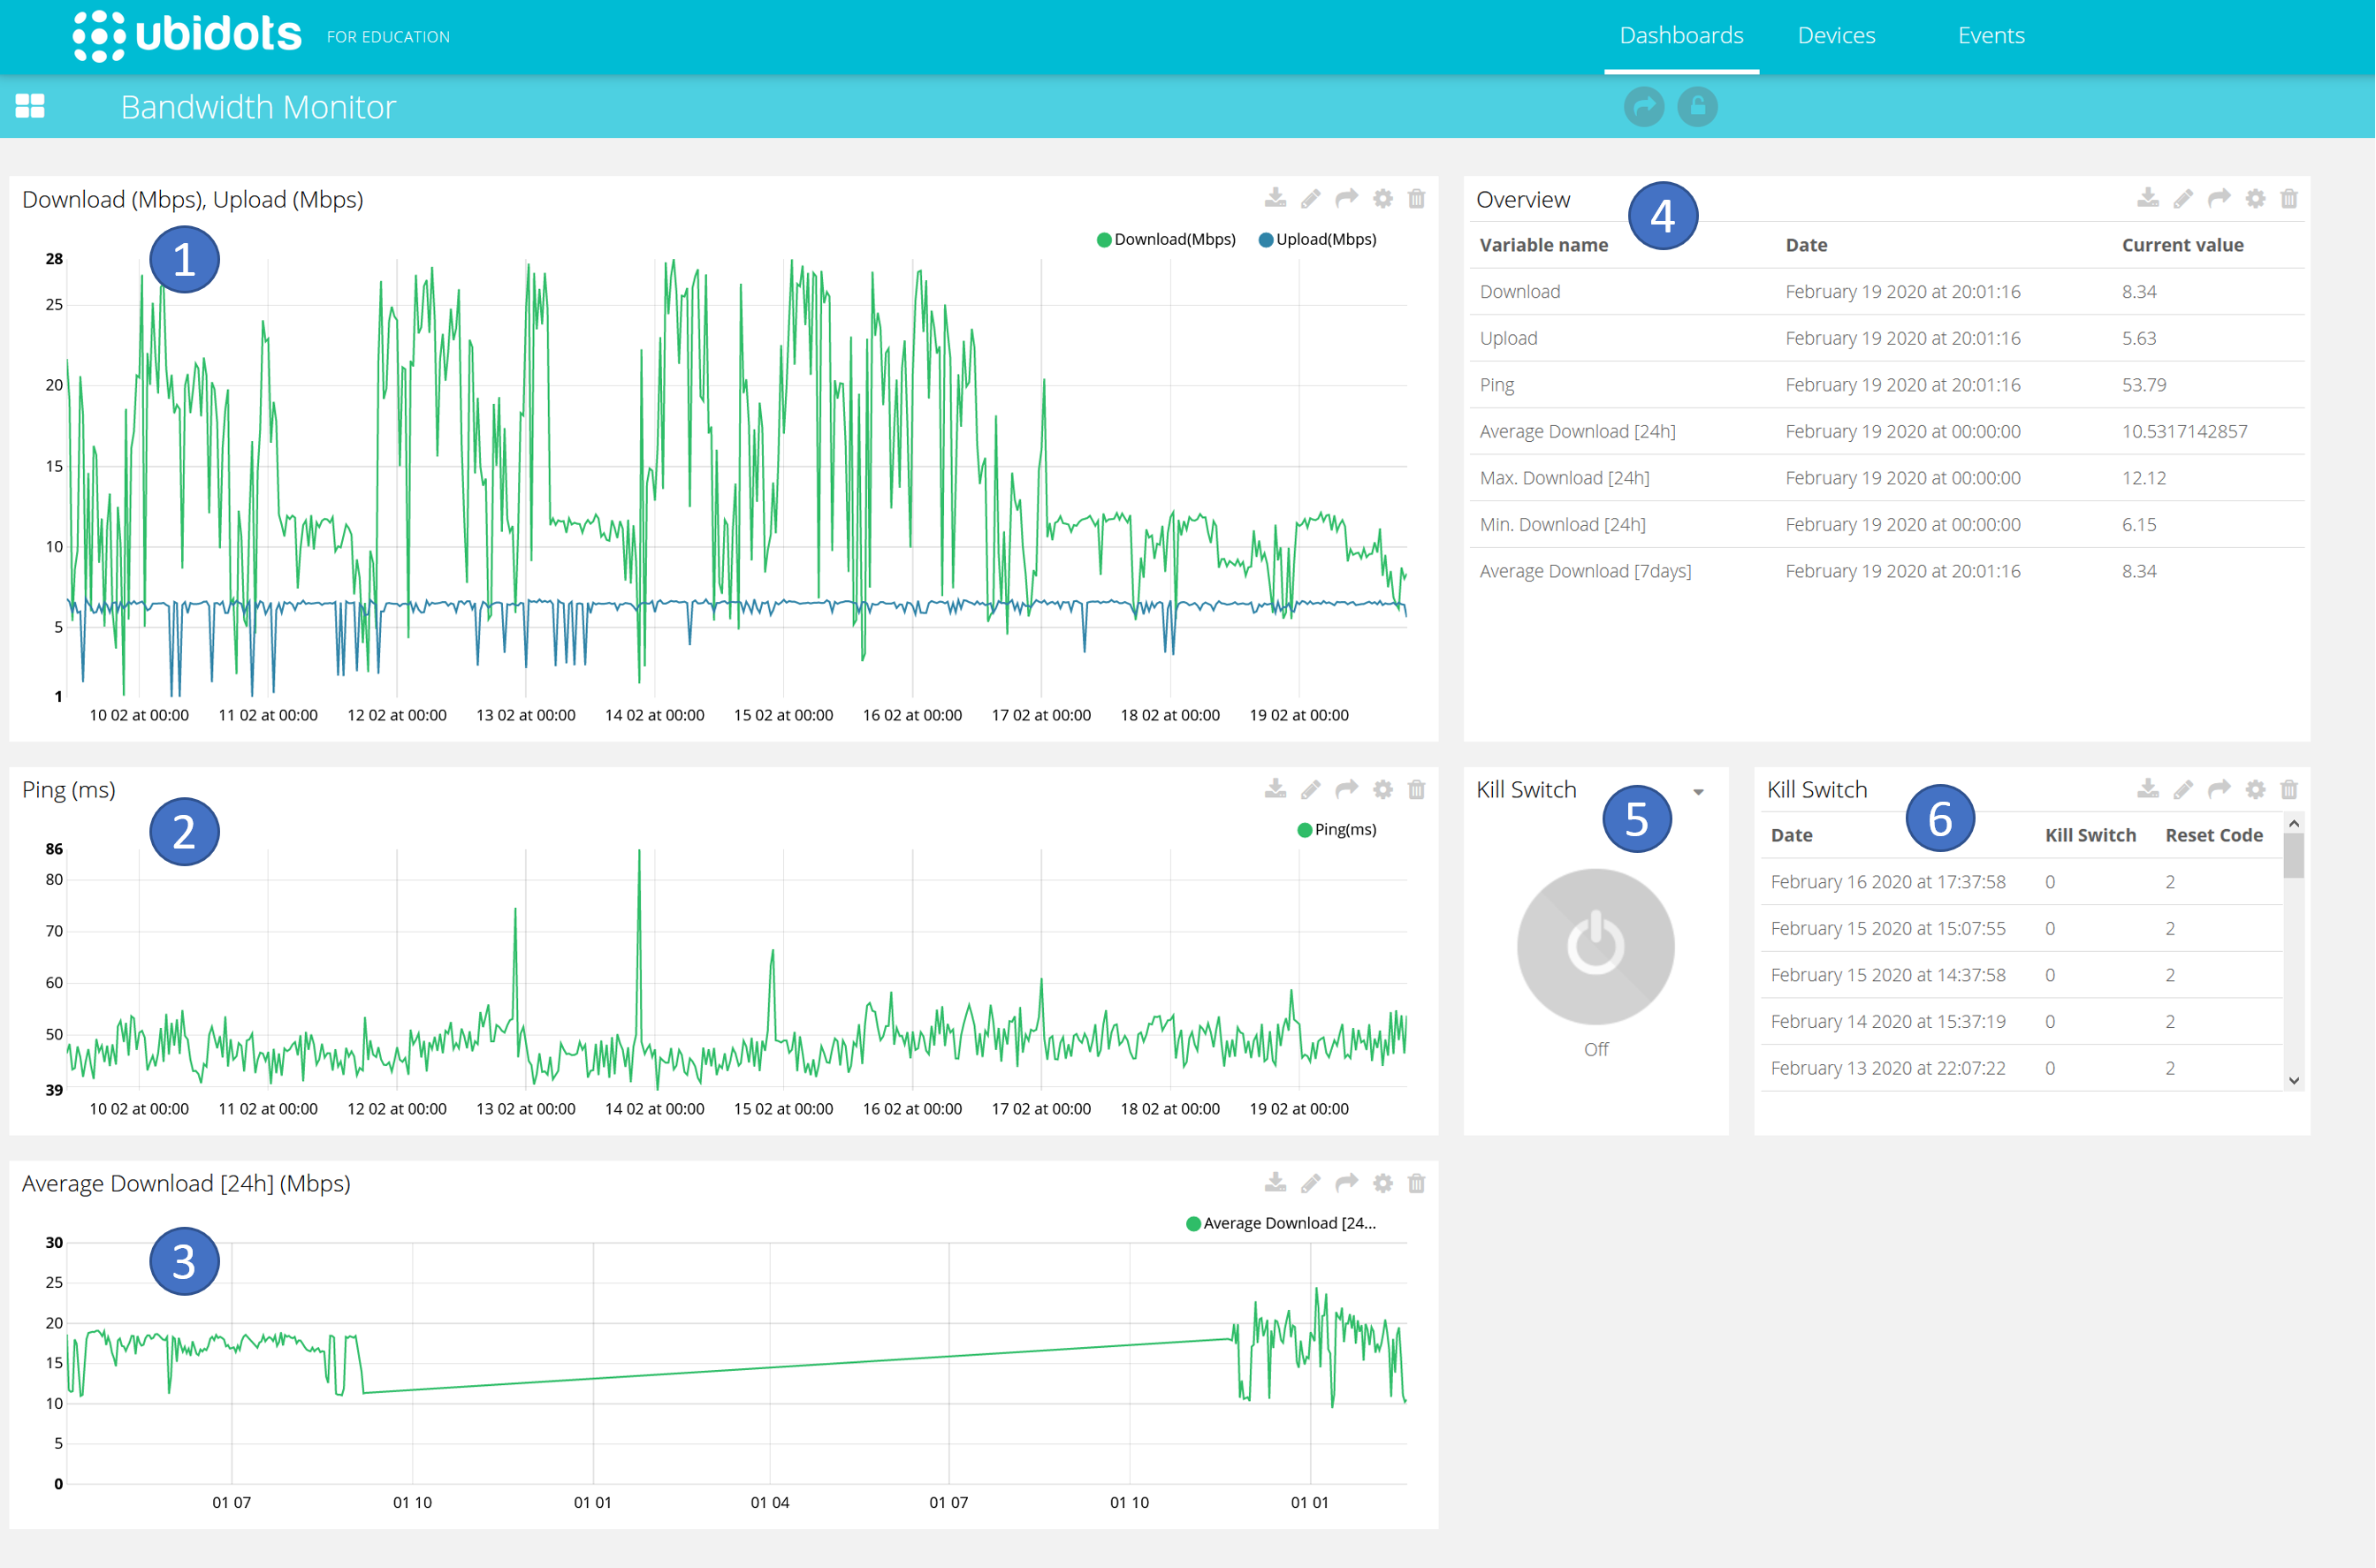
The dashboard hosted by Ubidots (see https://ubidots.com) contains several areas which are briefly described below.
- Time sequence of up- and download speed. Every half hour a new value is inserted into the diagram.
- Time course of the measured ping time. Every half hour a new value is inserted in the diagram.
- Time sequence of the average download speed. The average value over 24 hours is calculated and written to the diagram.
- Spreadsheet representation of the current measurement values including time stamp.
- Remote control button for resetting the modem via the Internet. Query occurs every 3 minutes, i.e. it may take some time until the action is carried out.
- Logging of the last resets including the reason for the reset (remote triggering, switching off or loss of voltage, falling below the minimum bandwidth)
Comprehensive tutorials on how to build the dashboard and how to integrate the dashboard into a Python program can be found directly on the Ubidots page (https://help.ubidots.com/en/) or via Google.
Introduction of Basic Functions
