Automated Diagnosis of Diabetic Retinopathy Via MATLAB
by riniandfam in Circuits > Software
7927 Views, 6 Favorites, 0 Comments
Automated Diagnosis of Diabetic Retinopathy Via MATLAB
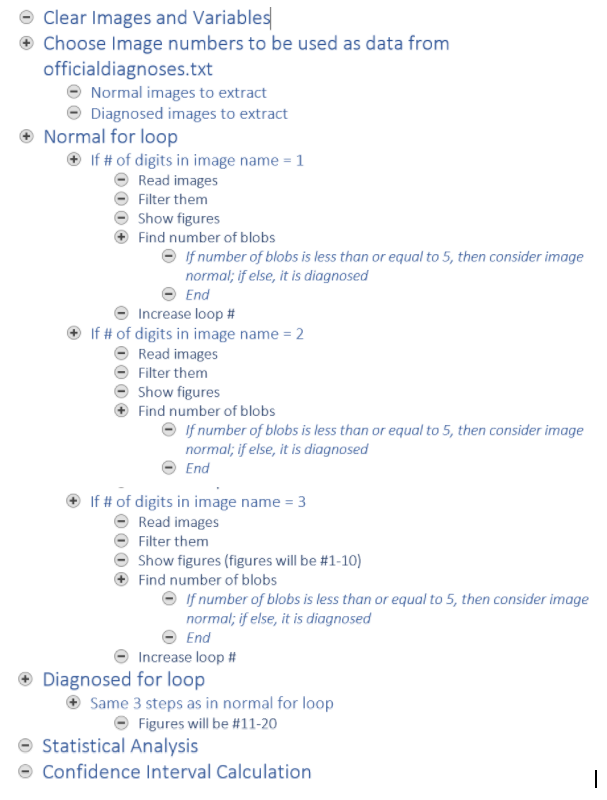
(See code outline above)
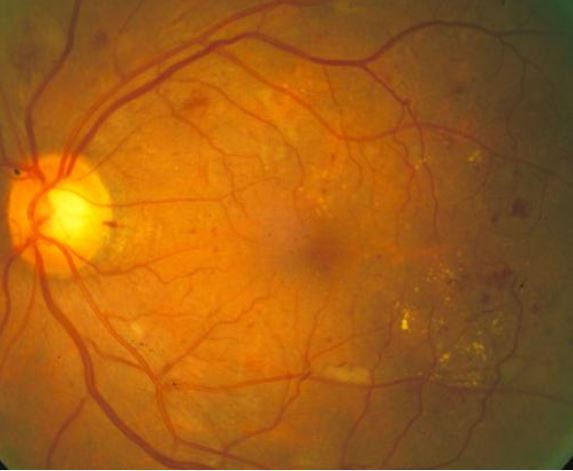
Diabetic retinopathy is a diabetes-related eye disease caused by high blood sugar levels. The high blood sugar levels cause the blood vessels in the retinas to swell, which leads to enlargened blood vessels and even vessel leaks, which lead to dark spots in retinal images. With this code, we aim to use the appearance of blood vessel leak spots as an indicator of background diabetic retinopathy, though further diagnosis techniques would be required in the real world. The goal of this code is to automate image processing and diagnosing of retinal images to identify signs of diabetic retinopathy shown through dark spots in the retinal images.
10 normal retinal images and 10 diagnosed retinal images were processed through a code that first reads and filters the images and then quantifies the dark spots to determine if diabetic retinopathy symptoms are present, based on a given threshold. The results are then printed onto the command window for viewer interpretation.
Prerequisites
1. Make sure you have the MATLAB program downloaded on your computer.
2. Download the txt file found in the link. (Press ‘ctrl+s’ to save to the same directory as the MATLAB Code)
Prerequisites (con't)
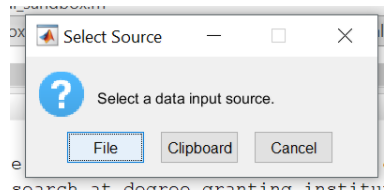
4. Open MATLAB and type ‘uiimport’ into the command window.
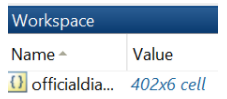
5. Select the officialdiagnoses.txt file and import it into MATLAB as a cell matrix.
6. Make sure you see ‘officialdiagnoses’ as a variable in the workspace.
Prerequisites (con't)
7. Download the function ModWald.m, which can obtain from above code or download it from Canvas.
(Code provided by Professor King and Professor Choi)
Downloads
Prerequisites (con't)
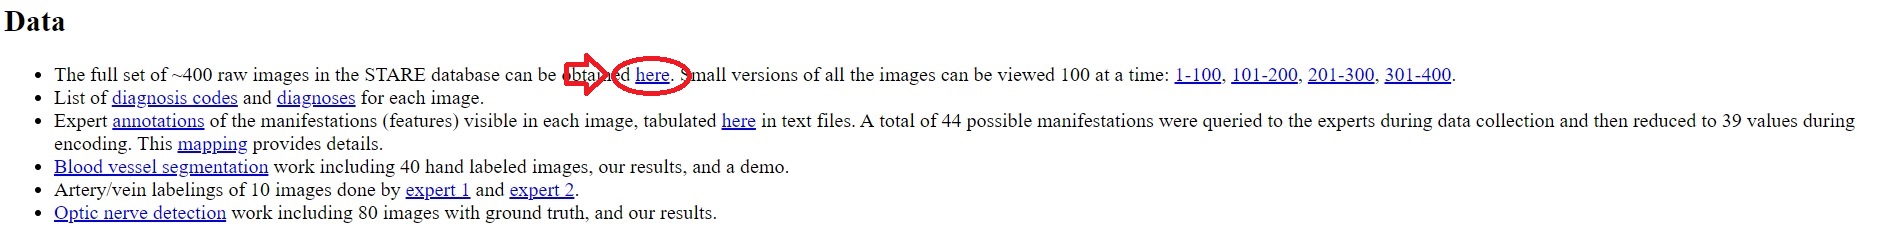
8. Download the 400 raw images from the data section of The STARE Project.
Clean Up Matlab to Prepare for Running Code
Add to code:
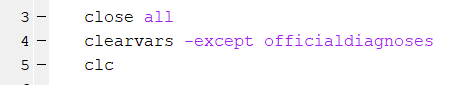
1. close all (Closes all previously opened images )
2. clearvars - except officialdiagnoses (Clears all variables except the official diagnoses txt file previously imported)
3. cclc (Clears Command Window)
Select 10 Normal Eye Images and 10 Images With Diabetic Retinopathy Symptoms
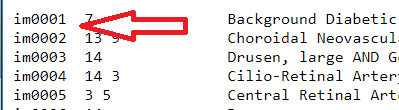
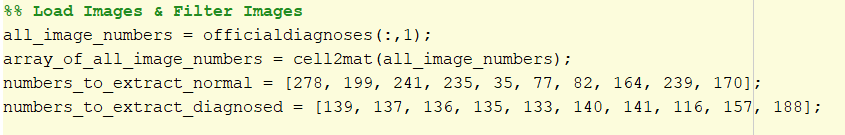
1. Take the diagnosis text file and extract the image names. These names are contained in the first column of the text file so to extract them type 'officialdiagnoses(:,1)'. The matrix of image names was assigned to a variable, “ all_image_numbers”
2. Convert the all_image_numbers variable from a cell array to a matrix array using the cell2mat function
Select 10 Normal Eye Images and 10 Images With Diabetic Retinopathy Symptoms (con't)
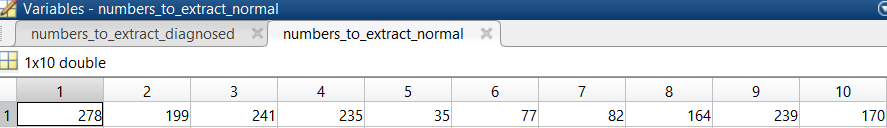
3. Select 10 normal eye images to run the code. The images selected in this case were 278, 199, 241, 235, 35, 77, 82, 164, 239, 170.
Place these numbers in a matrix and assign them to a variable that will be called when loading the images.
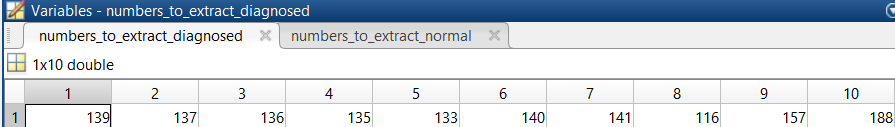
4. Repeat step 3 for retinal images that have been diagnosed with diabetic retinopathy. The images selected in this case were 139, 137, 136, 135, 133, 140, 141, 116, 157, 188.
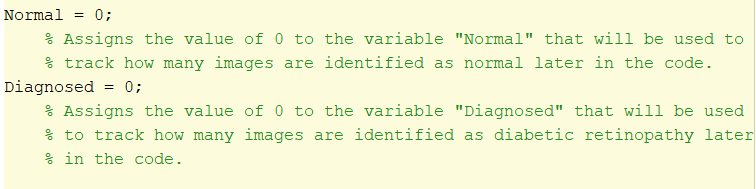
Create 2 Variables (Normal and Diagnosed) and Set Them Each Equal to 0
.png)
Create these variables before the for loop to initialize the loop numbers.
Create a for Loop to Automatically Upload Normal Images
.png)
1. Create a for loop
2. Set a counting variable (i, in this case) to a matrix of values 1-10. This counting variable will be used to call each image individually
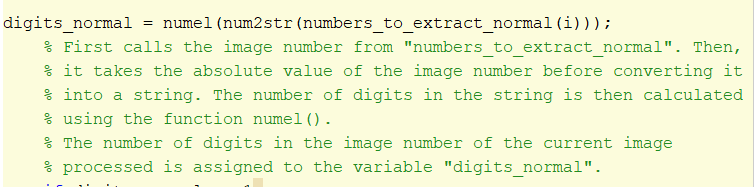
3. Take the i element in the matrix of images to extract and convert the image name from a string to a number using the num2str function.
Find the number of digits present in the image name using the numel function. Assign this value to a variable, digits_normal. This number should be 1 for single digit numbers, 2 for double digit numbers, and 3 for triple digit numbers. This information will be used to automatically call images.
Create a for Loop to Automatically Upload Normal Images (con't)
.png)
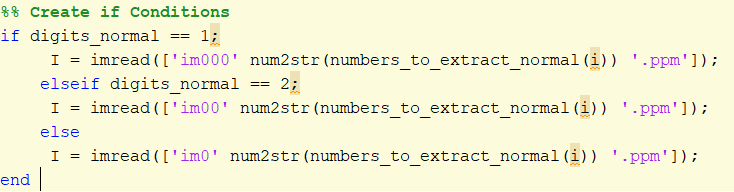
3. Create an if statement containing all three possibilities from the previous steps. If the image name has 1 digit, the image will be called as “im000”, if it has 2 digits, the image will be called as “im00”, and if it has 3 the image will be called as “im0”.
4. Under each if statement, assign a variable to imread “im” under the corresponding, if statement with the appropriate number of zeros (as described above), followed by the i.
Crop the Borders of the Image
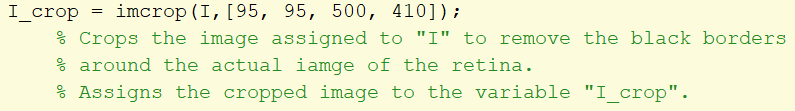
Take the original image and apply an imcrop filter to eliminate black borders and assign to a variable I_crop. The crop rectangle is specified using a matrix [95, 95, 500, 410].
Create a Gray-scale Image
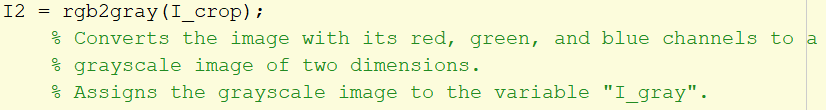
Take the cropped image and apply the rbg2gray filter to change the image to grayscale. Assign this image to variable I2.
Create a Contrasted Image
.png)
Take the image I2 and use imadjust to rescale intensity values.
Take values that fall within the range [0.2, 0.7] and rescale them to a [0, 1]. The gamma is set to 0.8 to make the image brighter. Assign the new image to I_adjusted.
Enhance the Contrast Image
.png)
Take the I_adjusted image and use the adapthisteq function to enhance the contrast.
The Adapthisteq syntax requires the image name, I_adjusted, ‘numTiles’, the size of numTiles, ‘nBins’, and the number of bins. The size of numTiles is set to [8 8], dividing the image into 8x8 tiles and the number of bins is set to 28. Assign the image to I_constrast.
Create an Average Filter
.png)
Create a variable named 'meanfilt' using the fspecial function. Input ‘average function’ to create the averaging filter and insert [90 90] for the sliding window size.
Combine the Averaging Filter With the Contrasted Image
.png)
Create a new variable named mask_mean and use the imfilter function to take the I_contrast image and to apply the mean filter previously created.
Make a New Mean Mask by Subtracting Pixels
.png)
Create a variable named mask_mean2 and use the imsubtract function to subtract the value of each pixel in I_contrast from the corresponding pixel in mask_mean.
Create a Binary Filtered Image
.png)
Turn grayscale images to black and white using imbinarize. Input mask_mean2, ‘adaptive’, ‘ForegroundPolarity’, ‘dark’, ‘Sensitivity’, 0.6. Assign this new image to mask_binarize.
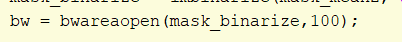
Remove Smaller Blobs Found in the Filtered Images
.png)
Remove objects with connectivity less than 100 pixels using the bwareaopen function on the mask_binarize and set the threshold value to 100. Assign the variable as bw.
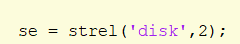
Create a Disk Structuring Element
.png)
Create a disk structuring element (with a radius of 2) using the strel function. Assign it to se.
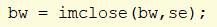
Perform Morphological Close Operations
.png)
Take bw and apply the imclose function to the structural element to perform a morphological close operation on the object.
Find the Objects With Connectivity of at Least 8
.png)
Take bw and use bwconncomp to find the objects with connectivity of at least 8 in the image. Assign the number output to cc_1.
Find the Maximum Number of Connected Pixels
.png)
.png)
Use the cellfun function to perform the function “numel” on every cell in CC. This finds the number of elements in the PixelIdxList cell. Assign Value to “numPixels”.
Find the maximum values in numPIxels. Assign the largest maximum to “biggest” and the index of the maximum value to “idx”.
Set the Max Pixel Values to 0 and Find Pixels With >=26 Pixel Connectivity
.png)
.png)
Set the pixels with the largest values in the image “bw” to 0, making the pixels black.
Find the objects with a connectivity of at least 26 pixels in the image using bwconncomp. Assign to variable cc_1.
Remove Blood Vessels in Image
.png)
Remove the blood vessels still present in the image using the bwpropfilt function with a range of [0, 0.9].
[0.9, 1] is excluded because values close to 1 indicate a line. Assign to “RemoveVessels”.
Figure Display
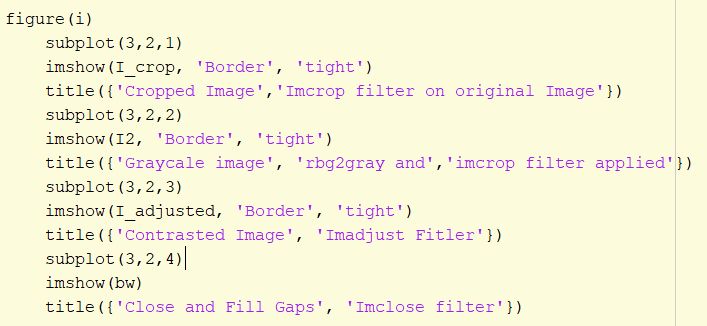.png)
Display each filtered image in a subplot. Imshow. with ‘border’ and ‘tight’ inputs, displays each image in a subplot structure. Add a title to each image to distinguish which filter was used.
Remove Vessels and Count Blobs of Blood
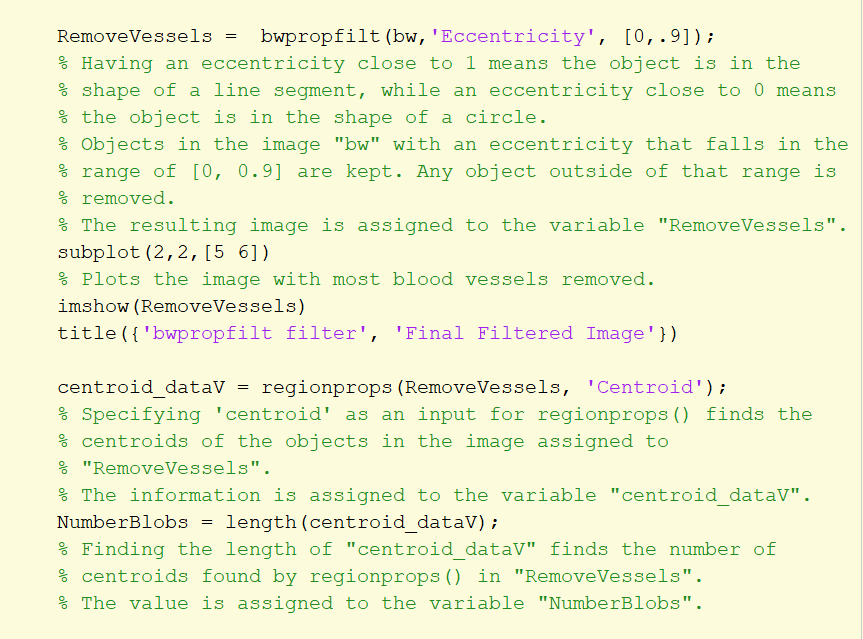
1. Take “RemoveVessels” and apply ‘Centroid’ feature in regionprops to identify the centroids of the objects in the image. These objects should correspond to blood clots present in the image.
2. Count the number of blood clots identified by taking the length of the centroid matrix.
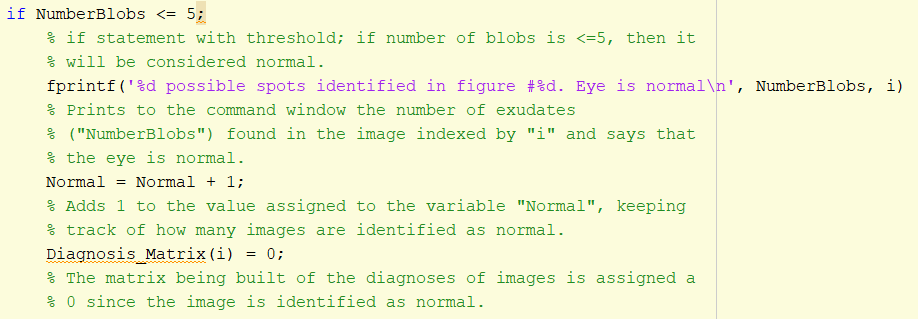
Diagnose the Retinal Image Based on the Number of Blood Clots Identified
.png)
Use if statements to diagnose image based on the number of blood clots identified.
If the number of centroids identified was less than or equal to 5, the image was identified as normal.
If the number of centroids was greater than 5, the image was diagnosed with diabetic retinopathy.
The result is printed onto the command window using fprintf.
If There Are More Than 5 Blobs...
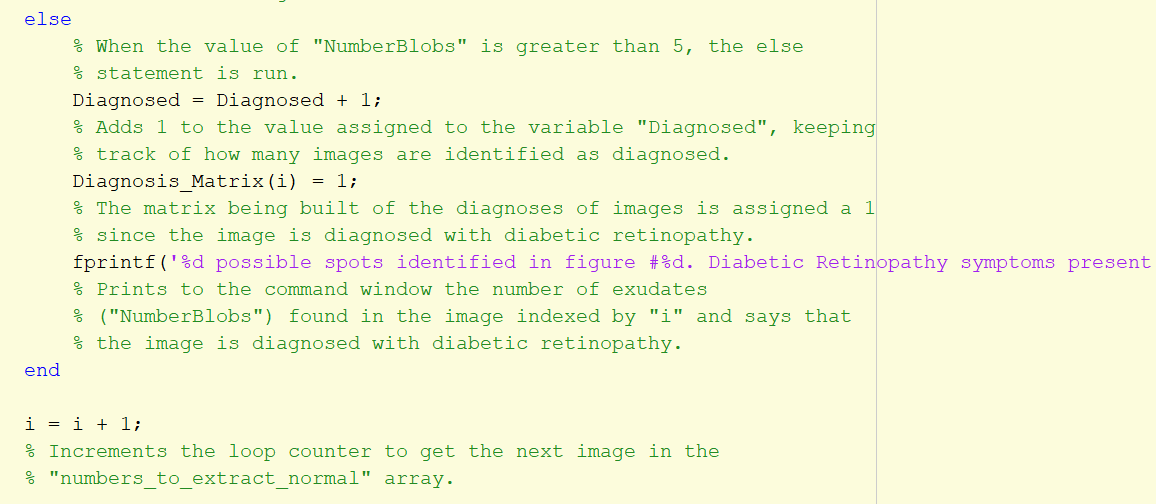
Repeat the instructions above for diagnosed images as an else statement. This part will run if the number of blobs is greater than 5.
End the if statement.
Repeat Filtering Process for Normal Images With Image Digit Values As 2 and 3
.png)
.png)
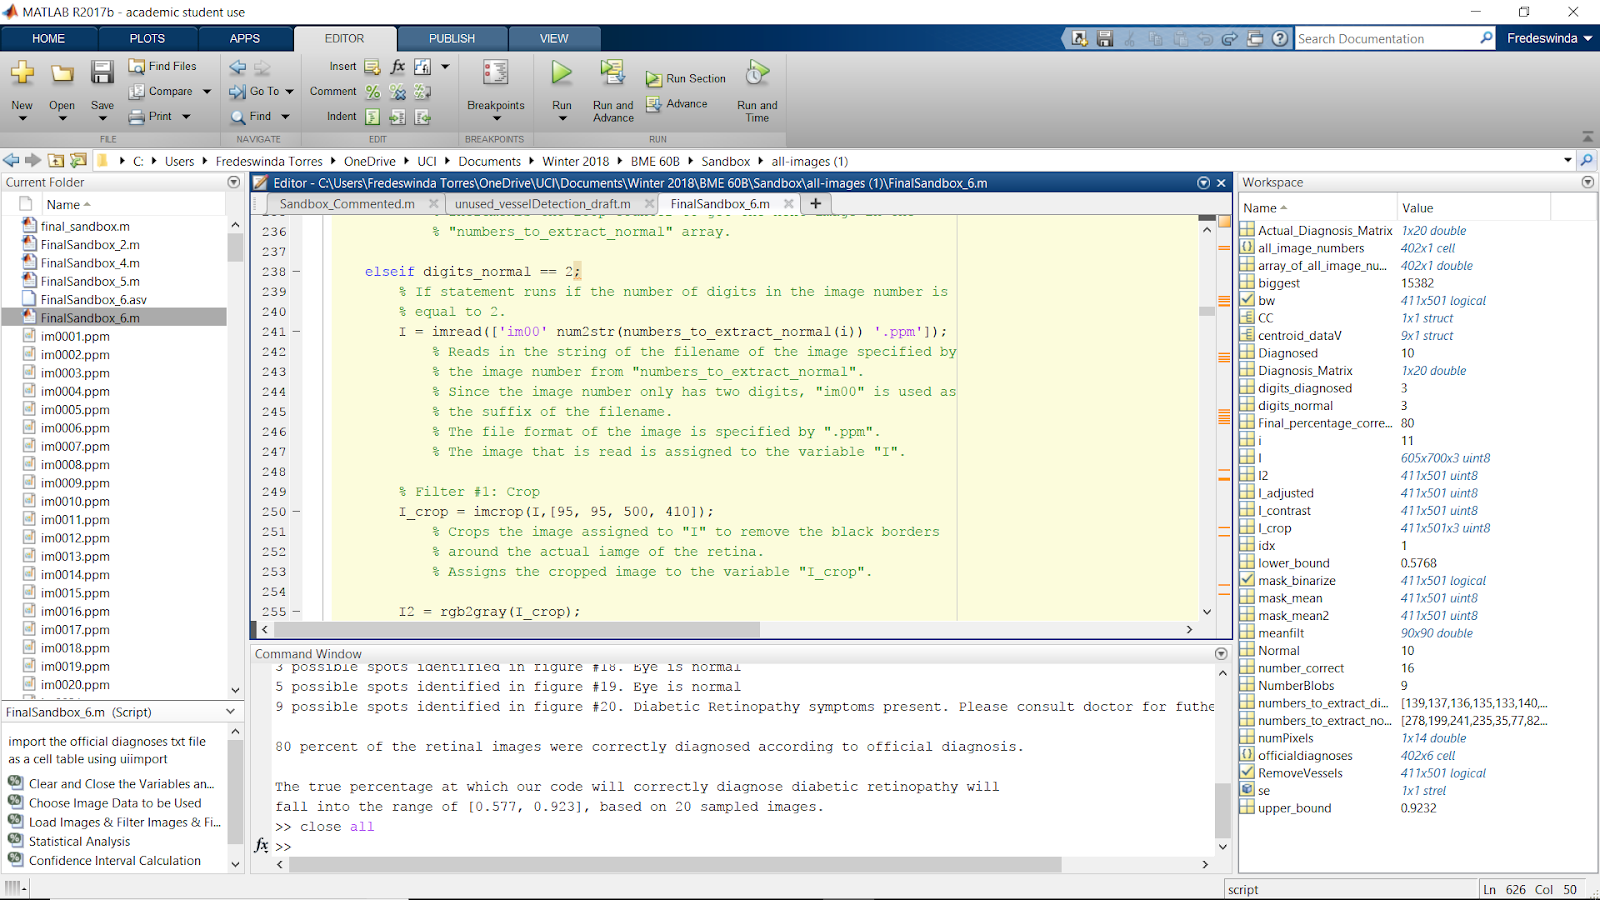
Repeat the process for the remainder of the original if statements when numel (the number of digits in the image number) is equal to 2 and 3. This completes the for loop for the normal images.
End the for loop.
Repeat Entire Process for the Diagnosed Images
.png)
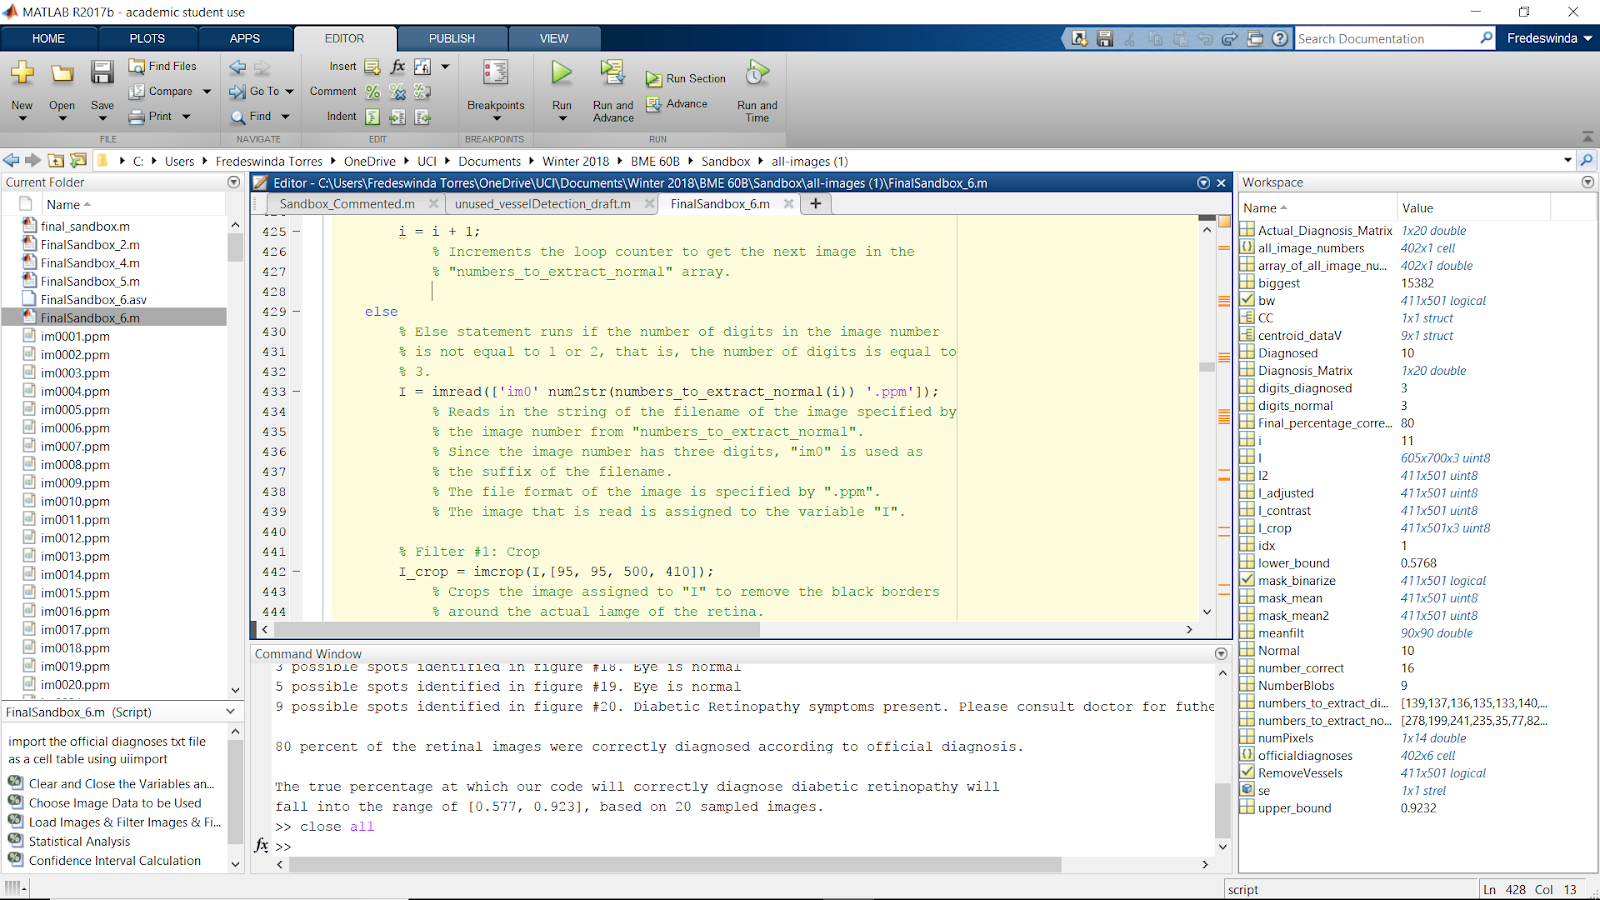
Repeat the entire process using the diagnosed images listed by the matrix “numbers_to_extract_diagnosed”.
Make sure to go through every figure(i) and change it to figure(i+10) so the diagnosed figures will pop up as images 11 to 20.
Statistical Analysis
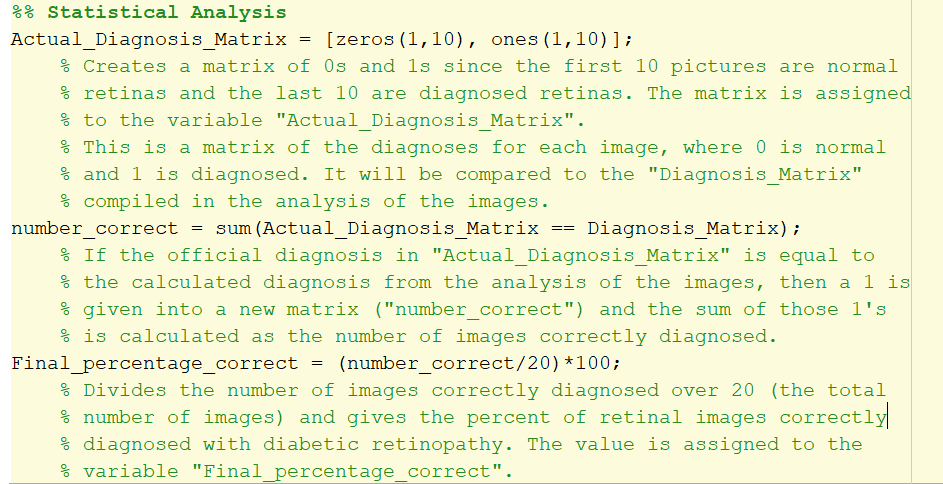
1. 'Actual_Diagnosis_Matrix' is used to compare the results to the official diagnosis found in the txt file. The first 10 zeros indicate that the first 10 images should be normal. The last 10 ones indicate that the last 10 images should be classified as diabetic retinopathy.
2. The double equal sign used to create 'number_correct' creates a logical array by comparing the value of the corresponding elements of 'Actual_Diagnosis_Matrix' to 'Diagnosis_Matrix' created from the for loop.
For each element that matches the diagnosis a 1 will be added, meaning the code correctly diagnosed that image. If it is incorrect it will add a 0 to the matrix.
Then, taking the sum of that adds up all the ones. In other words, it finds the sum of correctly diagnosed images.
3. 'Final_percentage_correct' is the calculated percentage of how accurate the code diagnosed diabetic retinopathy. The number of images diagnosed correctly is divided by 20 (the total number of pictures) and multiplied by 100 to find the percentage of successful diagnoses.
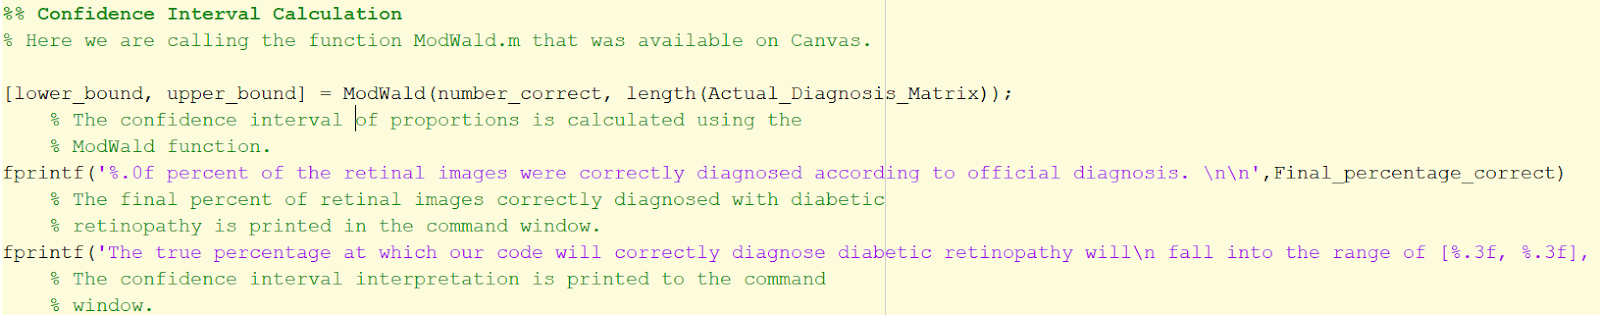
Finding Confidence Interval
.png)
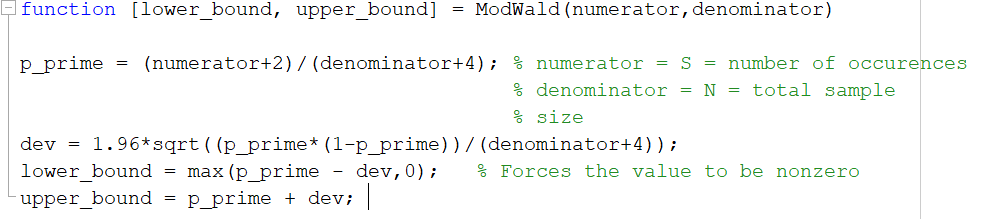
1. Make sure you have ModWald.m downloaded to call it as a function. Without the function, you would have to calculate the confidence interval using the modified Wald method yourself.
2. The ModWald function has 2 inputs where the first is the number of correctly identified images, and the second is the total amount of images.
3. The ModWald function will output the lower and upper bounds of the confidence interval of proportions for the accuracy of the sampled data. In other words, it will you give an interval of percentages where the true percentage of the accuracy of the code will lie.
4. Use fprintf below to output the statistics and confidence interval onto the command window.
>> fprintf('%.0f percent of the retinal images were correctly diagnosed according to official diagnosis. \n\n',Final_percentage_correct)
>> fprintf('The true percentage at which our code will correctly diagnose diabetic retinopathy will\n fall into the range of [%.3f, %.3f], based on 20 sampled images \n', lower_bound, upper_bound)