Arduino Debugger - Getting Started
by cs_michael in Circuits > Arduino
10797 Views, 7 Favorites, 0 Comments
Arduino Debugger - Getting Started
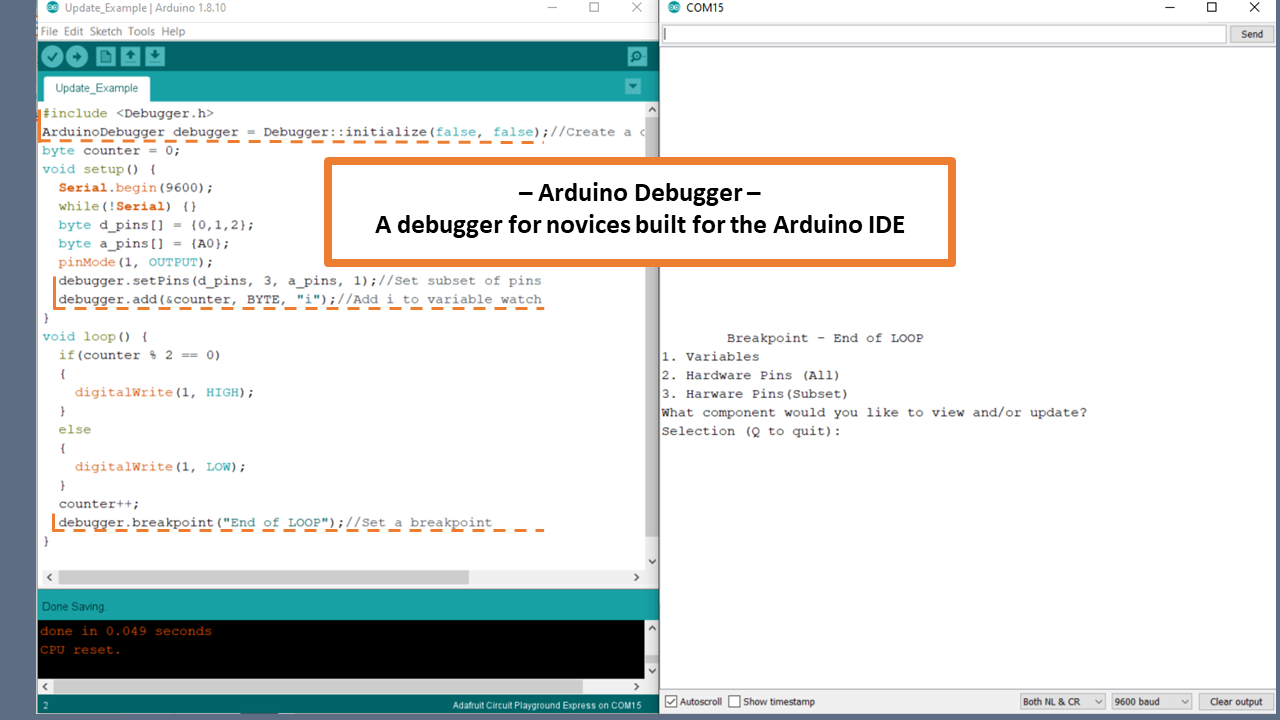
Are you learning to program an Arduino microcontroller, but wish the Arduino IDE provided some tools for debugging? Follow this Instructable to learn how to use the ArduinoDebugger, a C++ library, to debug your Arduino sketches.
The ArduinoDebugger provides the following tools:
- Variable tracking : view and update variable values at runtime
- Hardware pin tracking : view and update the state of hardware pins at runtime
- Breakpoints : pause a running program to check on variables and hardware pins.
- Print Statements : view variables and hardware pins as they change
To try out the ArduinoDebugger, follow the next two steps to include the custom library and load the example program.
This material is based upon work supported by the National Science Foundation under Award #1742081. The project page can be found here.
This project (formerly known as PinStatus) was developed in the Craft Tech Lab at the University of Colorado Boulder and co-created with Chris Hill.
Supplies
Arduino Microcontroller - Ex. Adafruit Circuit Playground or Arduino Uno
Importing the ArduinoDebugger Library
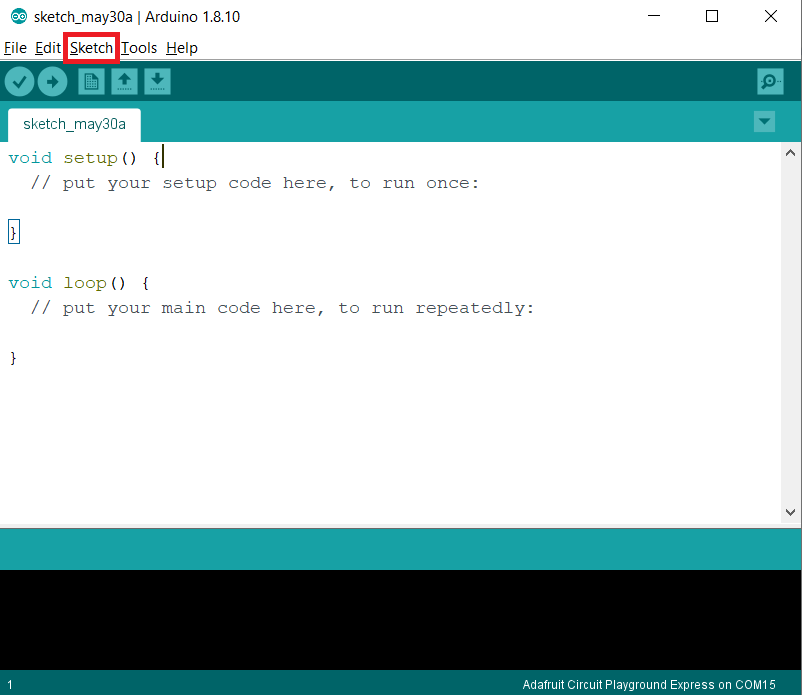
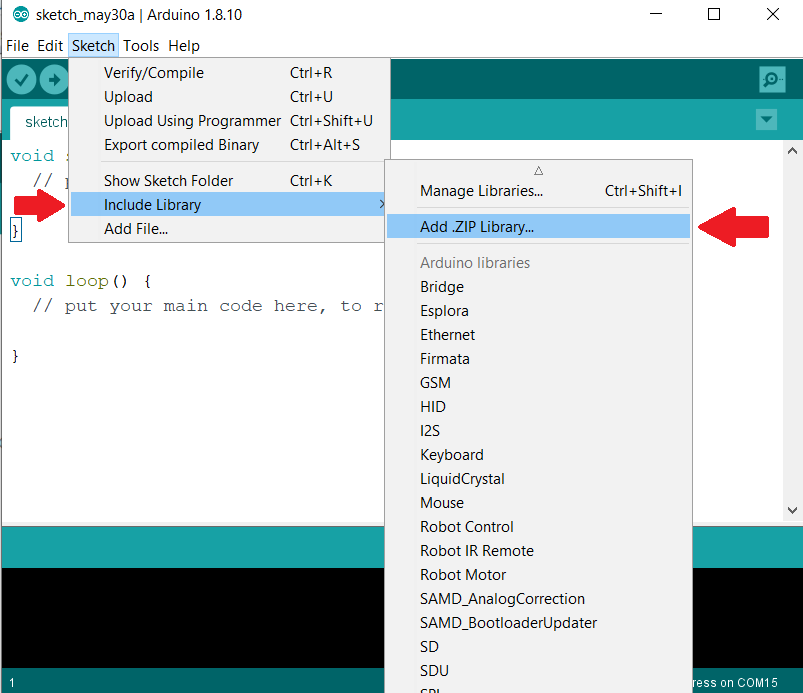
In order to use the ArduinoDebugger library you'll need to first download the library and then add it to your Arduino IDE.
- Download the library
The ArduinoDebugger library can be downloaded from a Google Drive Folder here:
https://drive.google.com/file/d/1i4GvmStOuDjHBdTnZHWQ3yb_RgXX4qPw/view?usp=sharing
Make sure to note where you save the zipped directory (ArduinoDebugger.zip)
2. Add the .zip library
Once downloaded, open your Arduino IDE and navigate to the "Sketch > Include Library > Add .ZIP Library". You can now include the ArduinoDebugger library into your Arduino sketches, but you may need to restart the IDE to access the provided examples.
Example Program
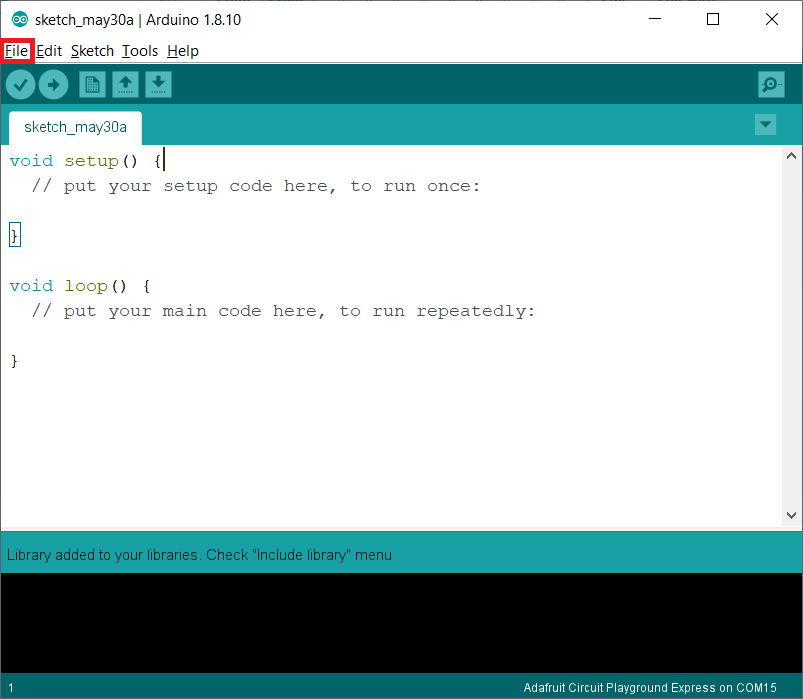
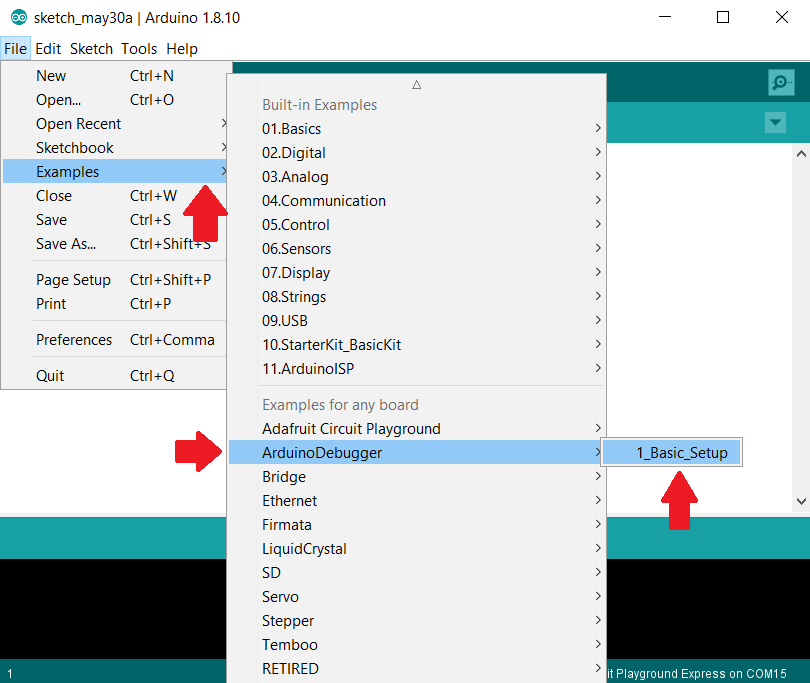
An example program can found under "File > Examples > ArduinoDebugger > 1_Basic_Setup". The code for the example sketch is also provided at the bottom of this step. Upload the example program to your chosen Arduino microcontroller and then open up the Arduino IDE's Serial Monitor.
Via the Serial Monitor, you'll be able to access the breakpoint's menu which will give you control of the program's variables (counter, message) and the board's hardware pins. Try updating a variables value or changing a hardware pin's state (for example Digital Pin 13 is often an onboard LED; try setting it to HIGH/LOW).
#include <ArduinoDebugger.h>
//the intialize method determines if the debugger uses 8-bit or 32-bit registers
//and whether or not it can handle floats.
// intialize(usingFloats, is8Bit);
// Floats are generally not recommended because they use a lot of memory space.
Debugger debugger = ArduinoDebugger::initialize(NO_FLOATS, BITS_8);//Adafruit Circuit Playground Classic
//Debugger debugger = ArduinoDebugger::initialize(NO_FLOATS, BITS_32);//Adafruit Circuit Playground Expressbyte d_pins[] = {LED_BUILTIN, 10, 9};//Subset of digital pins
byte a_pins[] = {A0, A1};//Subset of analog pins
byte counter = 0;
void setup() {
  Serial.begin(9600);
  while(!Serial) {}
  pinMode(LED_BUILTIN, OUTPUT);
  debugger.setSubsetPins(d_pins, 3, a_pins, 2);//Set subset of pins
  debugger.add(&counter, BYTE, "counter");//Add to variable watch
}void loop() {
  if(counter %2 == 0)
  {
    digitalWrite(LED_BUILTIN, HIGH);
    debugger.print("LED HIGH");//Displays information, no pausing
    //debugger.breakpoint("LED HIGH");//Pauses & displays menu for updating variables & hardware pins
  }
  else
  {
    digitalWrite(LED_BUILTIN, LOW);
    debugger.print("LED LOW");//Displays information, no pausing
    //debugger.breakpoint("LED LOW");//Pauses & displays menu for updating variables & hardware pins
  }
  delay(500);
  counter++;
}
Breakpoints Vs Repeats Vs Prints
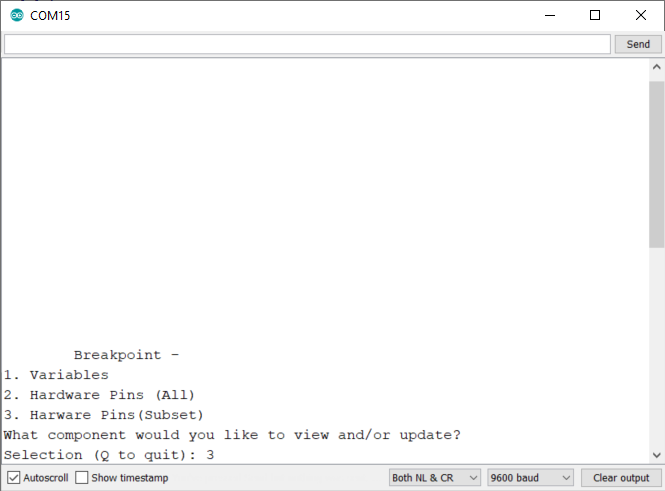
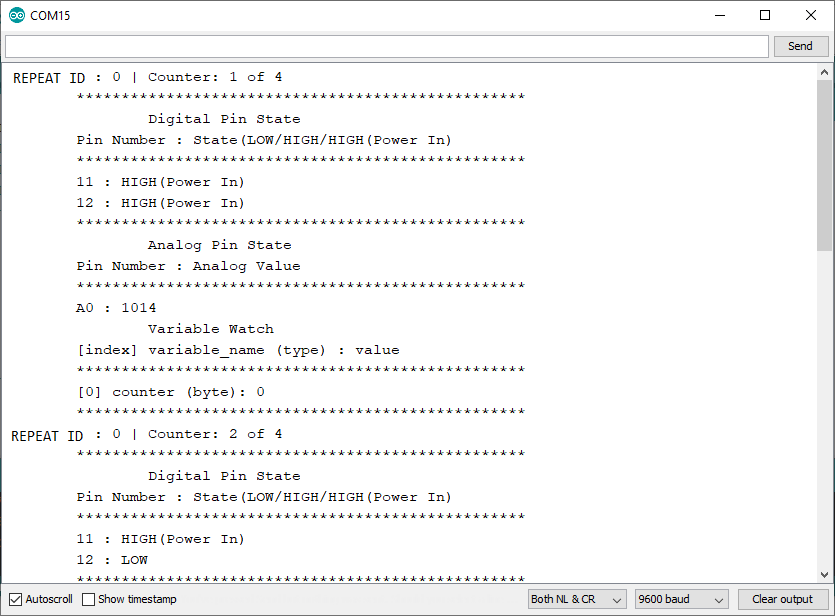
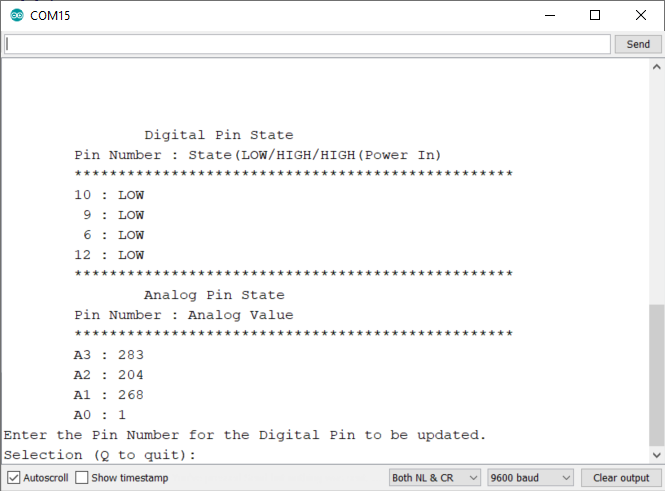
The ArduinoDebugger provides three ways to access debugging information (breakpoints, repeats, and prints). They all will provide information on variables and hardware pins but in slightly different ways.
Breakpoint: Handy for changing values while the program is running
A breakpoint pauses a running Arduino program and provides a menu via the Serial Monitor. With the menu, a programmer can select to:
1) View Variables:
Here you can see what variables are currently set to and even update them to new values. To use this feature, you'll need to add your variables to the debugger, using the add() method.
2) View Hardware Pins:
Here you can see what state digital pins are set to and the current value read off of the boards analog pins. You can also set the digital pins to either HIGH or LOW
debugger.breakpoint();//Use when you only want 1 breakpoint

debugger.breakpoint("Identifier");
//The string identifiers which breakpoint the program has stopped at
Repeat: Great for printing out a series of data and then pausing for you to read it
A call to repeat() will display the current state of hardware pins and variable values. After being called X number of times, the repeat() will pause the running program so the programmer can read through the system information presented in the Serial Monitor.
debugger.repeat(5);//After being called 5 times, repeat() will pause the running program
Print: Display debugging information WITHOUT pausing the program
The print() method displays all the same information repeat() does, but without pausing the program. This is a handy way to throw in debugging information without worrying about pausing/continuing the Arduino Program.
debugger.print();
Turning Off the Debugger
What happens when you finish debugging? You have two choices. You can either delete the code you wrote to use the debugger OR you can simply turn the debugger off until you need it again. We recommended going with the second option until you have completely finished your project. To turn off/on the ArduinoDebugger, make a call to the turnOff() method. This method ensures debugging information isn't displayed to the Serial Monitor. If you later need to do some more debugging, delete the call to the turnOff() method.
debugger.turnOff();//Debugging information won't be displayed
Further Details
The ArduinoDebugger library provides a lot more configurations and options then are covered in this short instructable. To learn more about what the ArduinoDebugger can do, check out the full documentation here: