AirVisual Air Quality API Dashboard
by elizabethna in Circuits > Raspberry Pi
3916 Views, 4 Favorites, 0 Comments
AirVisual Air Quality API Dashboard

AirVisual (https://www.airvisual.com) is a website that provides data on air quality around the world. They have an API that we will use to get air quality data to send to a dashboard. We will interact with this API similar to how we did with the weather dashboard.
This is a simple project that teaches you how to use an API. Let's get started!
Getting Started
We’ve already put most of the code together, but you'll need you to make a few adjustments along the way. There is lots of opportunities for expanding on what we've done, too.
To retrieve all of the things we’ve prepared for you, you’ll need to clone the repository from GitHub. GitHub is an awesome service that allows us to store, revise, and manage projects like this. You will want to run this script on a dedicated device. You can use a laptop, Raspberry Pi, or other single board computer. To clone the repository all we need to do is go into our computer's or Pi’s terminal, and type this command:
$ git clone https://github.com/InitialState/airvisual.git
Hit enter and you’ll see this information:
$ git clone https://github.com/InitialState/airvisual.git  <br>Cloning into 'airvisual'...
remote: Enumerating objects: 13, done.
remote: Counting objects: 100% (13/13), done.
remote: Compressing objects: 100% (12/12), done.
remote: Total 13 (delta 2), reused 0 (delta 0), pack-reused 0
Unpacking objects: 100% (13/13), done.
Once you see this then congrats, you’ve successfully cloned the GitHub Repo and have all of the necessary files to build this project. Let’s move into the new directory. To change directory’s, all you need to do is type “cd” and then type the name of the directory that you wish to go to. In this case, we’ll type:
$ cd airvisual
Once we hit enter, you’ll see that we’re now in the airvisual directory. Let’s type "ls" to see what files we’ve installed. You should seem something as follows:
LICENSE README.md airquality.py
We need some other items before we can edit the code so let's look at the Air Quality API next.
AirVisual API


AirVisual has an air quality (AQI) and pollution API that allows up to 10,000 API calls per month for free. You can sign up for the Community tier. Once you sign up, you can go to My Air and the API tab. It is here that you will find your API keys and documentation on the API.
Click the +New Key button to create our first API access key. For Select Plan, use the dropdown to select Community and click Create. If all goes well you'll see a success message and you can head back to your API dashboard to find your new key information. The Key value (numbers and characters) is what you'll need for this project. If you peruse the API documentation you will see there are multiple kinds of API calls you can make. For this project we want to get the nearest city data based on GPS coordinates. For this call you'll need your longitude, latitude, and API key. Enter those parameters into the call below, put that into an address bar on your browser, and hit enter.
api.airvisual.com/v2/nearest_city?lat={{LATITUDE}}&lon={{LONGITUDE}}&key={{YOUR_API_KEY}} This will return the nearest city's data based on the GPS coordinates. It will look something like this:
{"status":"success","data":{"city":"Nashville","state":"Tennessee","country":"USA","location":
 {"type":"Point","coordinates":[-86.7386,36.1767]},"current":{"weather":{"ts":"2019-04-08T19:00:00.000Z",
 "__v":0,"createdAt":"2019-04-08T19:04:18.662Z","hu":88,"ic":"04d","pr":1012,"tp":18,"updatedAt":
 "2019-04-08T19:46:53.140Z","wd":90,"ws":3.1},"pollution":{"ts":"2019-04-08T18:00:00.000Z",
 "aqius":10,"mainus":"p2","aqicn":3,"maincn":"p2"}}}}
I recommend using a JSON formatter to get a better view of the data. If you use that it will look a little like this instead:
    "status":"success",
    "data":{
        "city":"Nashville",
        "state":"Tennessee",
        "country":"USA",
        "location":{
            "type":"Point",
            "coordinates":[-86.7386,36.1767]},
        "current":{
            "weather":{
                "ts":"2019-04-08T19:00:00.000Z",
                "__v":0,"
                createdAt":"2019-04-08T19:04:18.662Z",
                "hu":88,"
                ic":"04d",
                "pr":1012,
                "tp":18,
                "updatedAt":"2019-04-08T19:46:53.140Z",
                "wd":90,
                "ws":3.1},
            "pollution":{
                "ts":"2019-04-08T18:00:00.000Z",
                "aqius":10,
                "mainus":"p2",
                "aqicn":3,
                "maincn":"p2"}
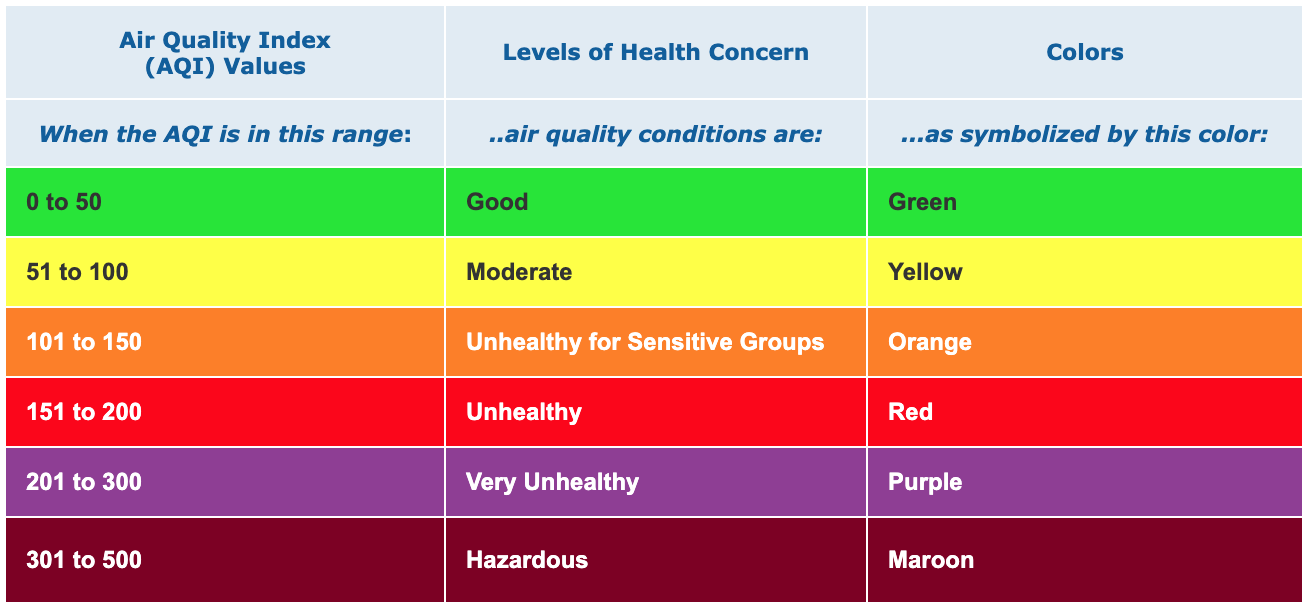
We can easily see now that we have information on location, weather, and pollution. The two values we focus on for this project is the Air Quality Index US (aquis) and Main Pollutant (mainus). The Air Quality Index value tells us what the local air quality value is and how that pertains to your health. The color coded chart is below. The main pollutant tells us what is the main pollutant in the air is for your area (particulate matter, nitrogen oxide, ozone, carbon monoxide, sulfur oxide). These pollutants are typically byproducts of smoke stacks or vehicle emissions.
Now that we know how to use the Air Visual API, the next thing we will need is a dashboard platform to display the data.
Initial State
We want to stream all of our weather data to a cloud service and have that service turn our data into a nice dashboard. Our data needs a destination so we will use Initial State as that destination.
Register for Initial State Account
Go to https://iot.app.initialstate.com and create a new account.
Install the ISStreamer
Install the Initial State Python module onto your laptop or Raspberry Pi. At a command prompt, run the following command:
$ \curl -sSL https://iot.app.initialstate.com -o - | sudo bash
Make some Automagic
After you run the curl command, you will see something similar to the following output to the screen:
$ \curl -sSL https://iot.app.initialstate.com -o - | sudo bash
Password:
Beginning ISStreamer Python Easy Installation!
This may take a couple minutes to install, grab some coffee :)
But don't forget to come back, I'll have questions later!

Found easy_install: setuptools 1.1.6
Found pip: pip 1.5.6 from /Library/Python/2.7/site-packages/pip-1.5.6- py2.7.egg (python 2.7)
pip major version: 1
pip minor version: 5
ISStreamer found, updating...
Requirement already up-to-date: ISStreamer in /Library/Python/2.7/site-packages
Cleaning up...

Do you want automagically get an example script? [y/N]
Where do you want to save the example? [default: ./is_example.py]

Please select which Initial State app you're using:
1. app.initialstate.com
2. [NEW!] iot.app.initialstate.com
Enter choice 1 or 2:
Enter iot.app.initialstate.com user name:
Enter iot.app.initialstate.com password:
When prompted to automatically get an example script, type y. This will create a test script that we can run to ensure that we can stream data to Initial State. The next prompt will ask where you want to save the example file. You can either type a custom local path or hit enter to accept the default location. Finally, you'll be asked which Initial State app you are using. If you've recently created an account, select option 2 then enter user name and password. After that installation will be complete.
Access Keys
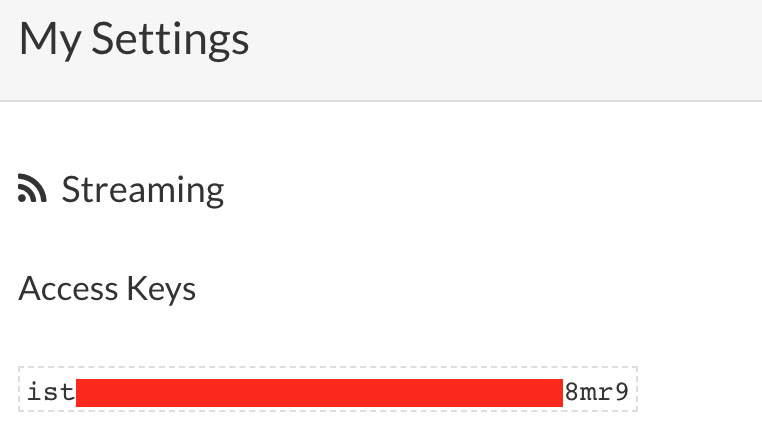
Let’s take a look at the example script that was created. $ nano is_example.py On line 15, you will see a line that starts with streamer = Streamer(bucket_ .... This lines creates a new data bucket named “Python Stream Example” and is associated with your account. This association happens because of the access_key=”...” parameter on that same line. That long series of letters and numbers is your Initial State account access key. If you go to your Initial State account in your web browser, click on your username in the top right, then go to “my settings”, you will find that same access key at the bottom of the page under “Streaming Access Keys”. Every time you create a data stream, that access key will direct that data stream to your account (so don’t share your key with anyone).
Run the Example
Run the test script to make sure we can create a data stream to your Initial State account. Run the following in your command prompt:
$ python is_example.py
Example Data
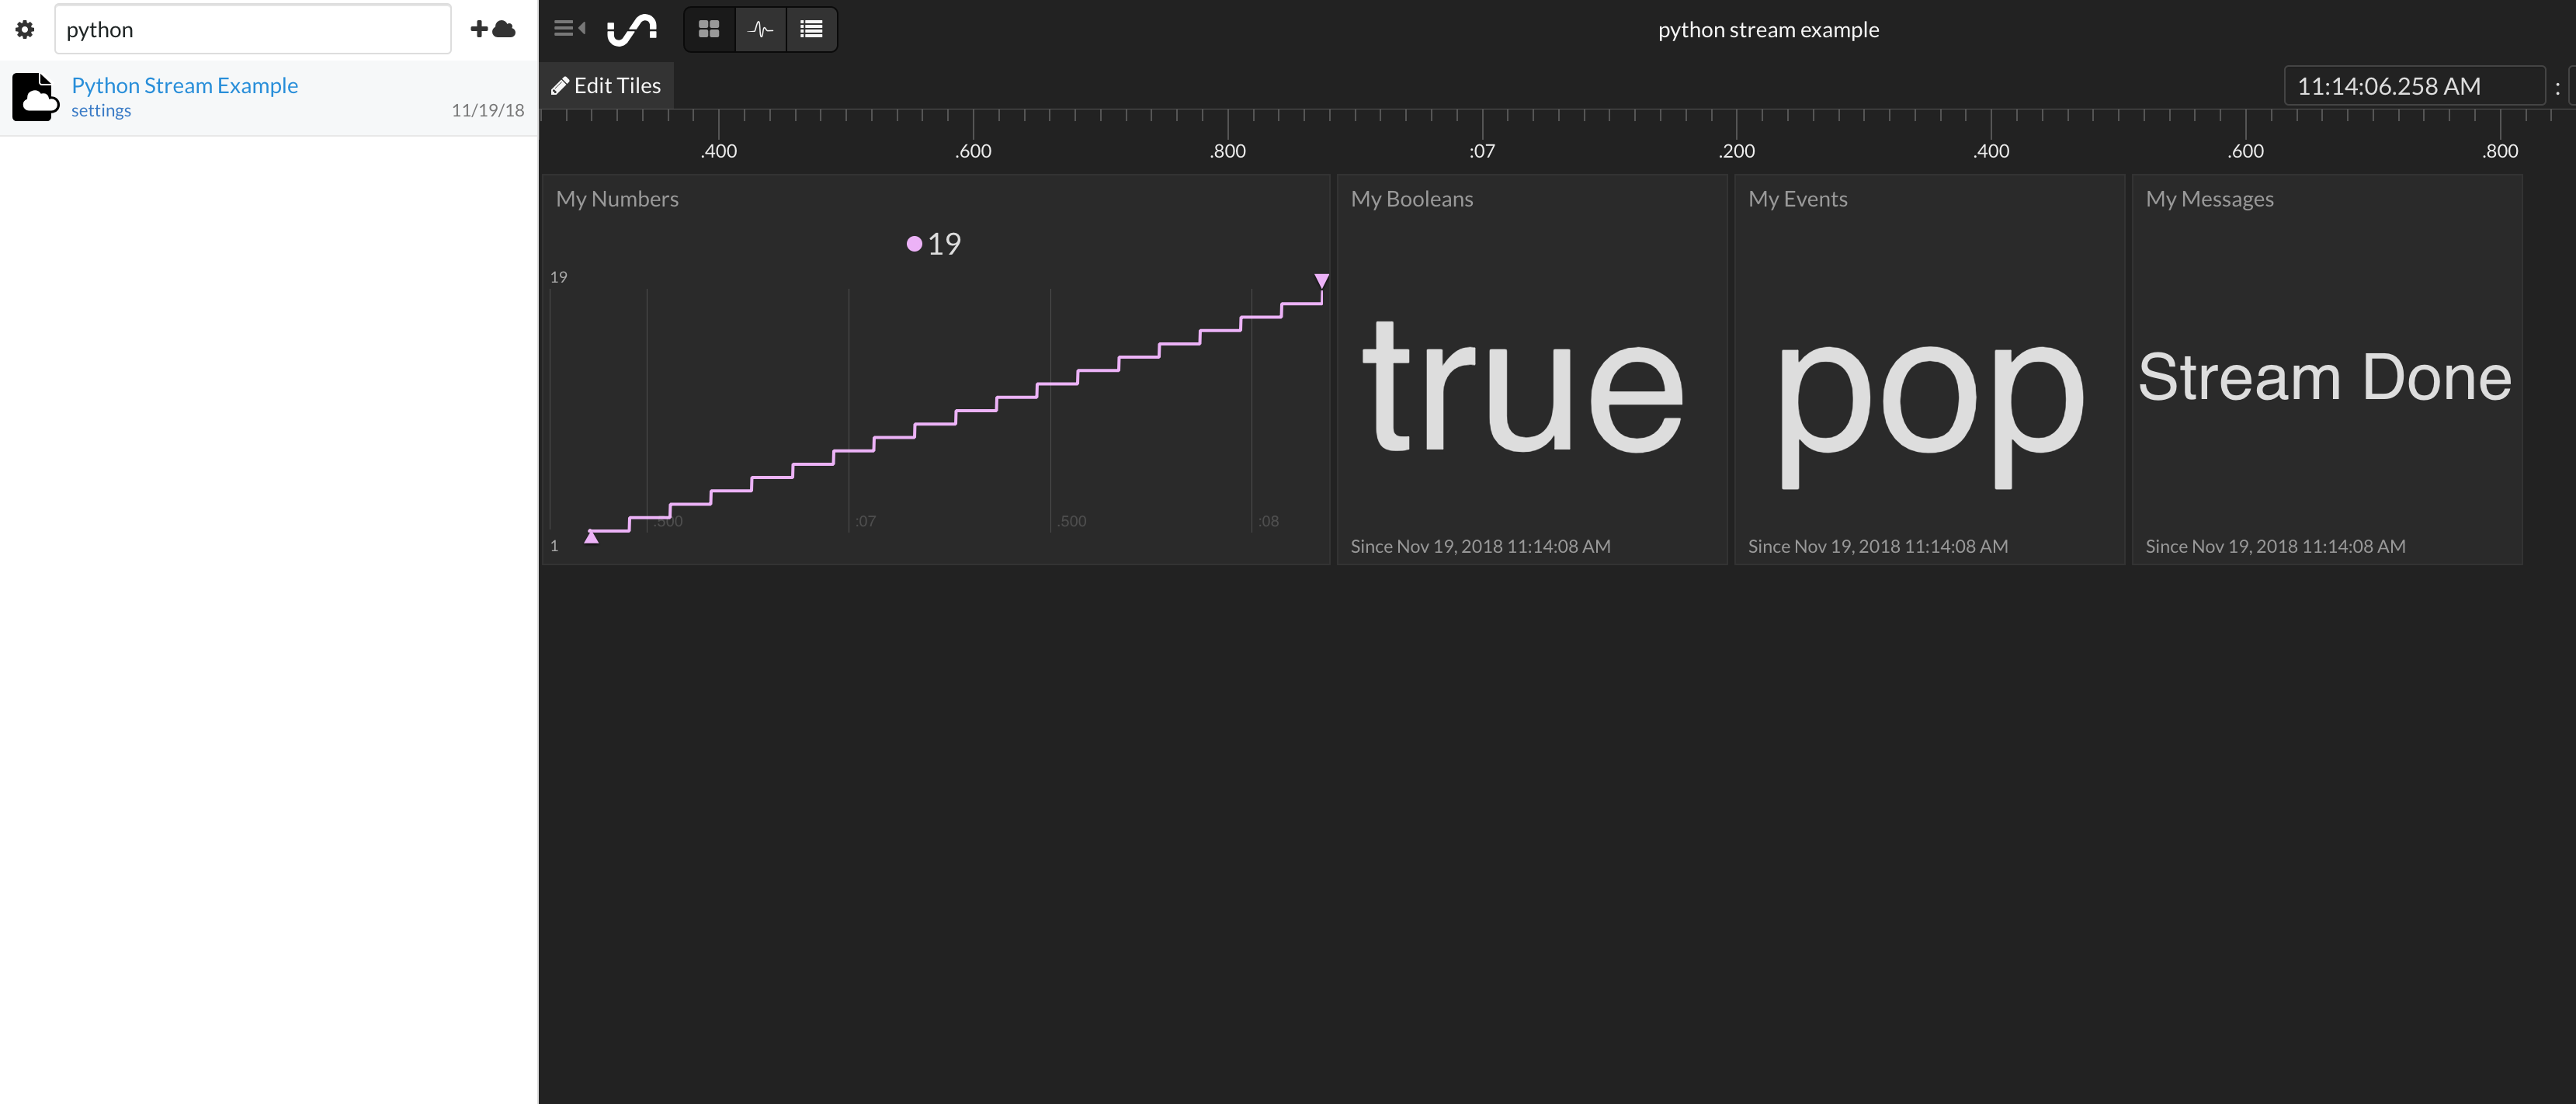
Go back to your Initial State account in your web browser. A new data bucket called “Python Stream Example” should have shown up on the left in your bucket shelf (you may have to refresh the page). Click on this bucket to view the data.
You are now ready to start streaming real data from the AirVisual API.
Air Quality Dashboard
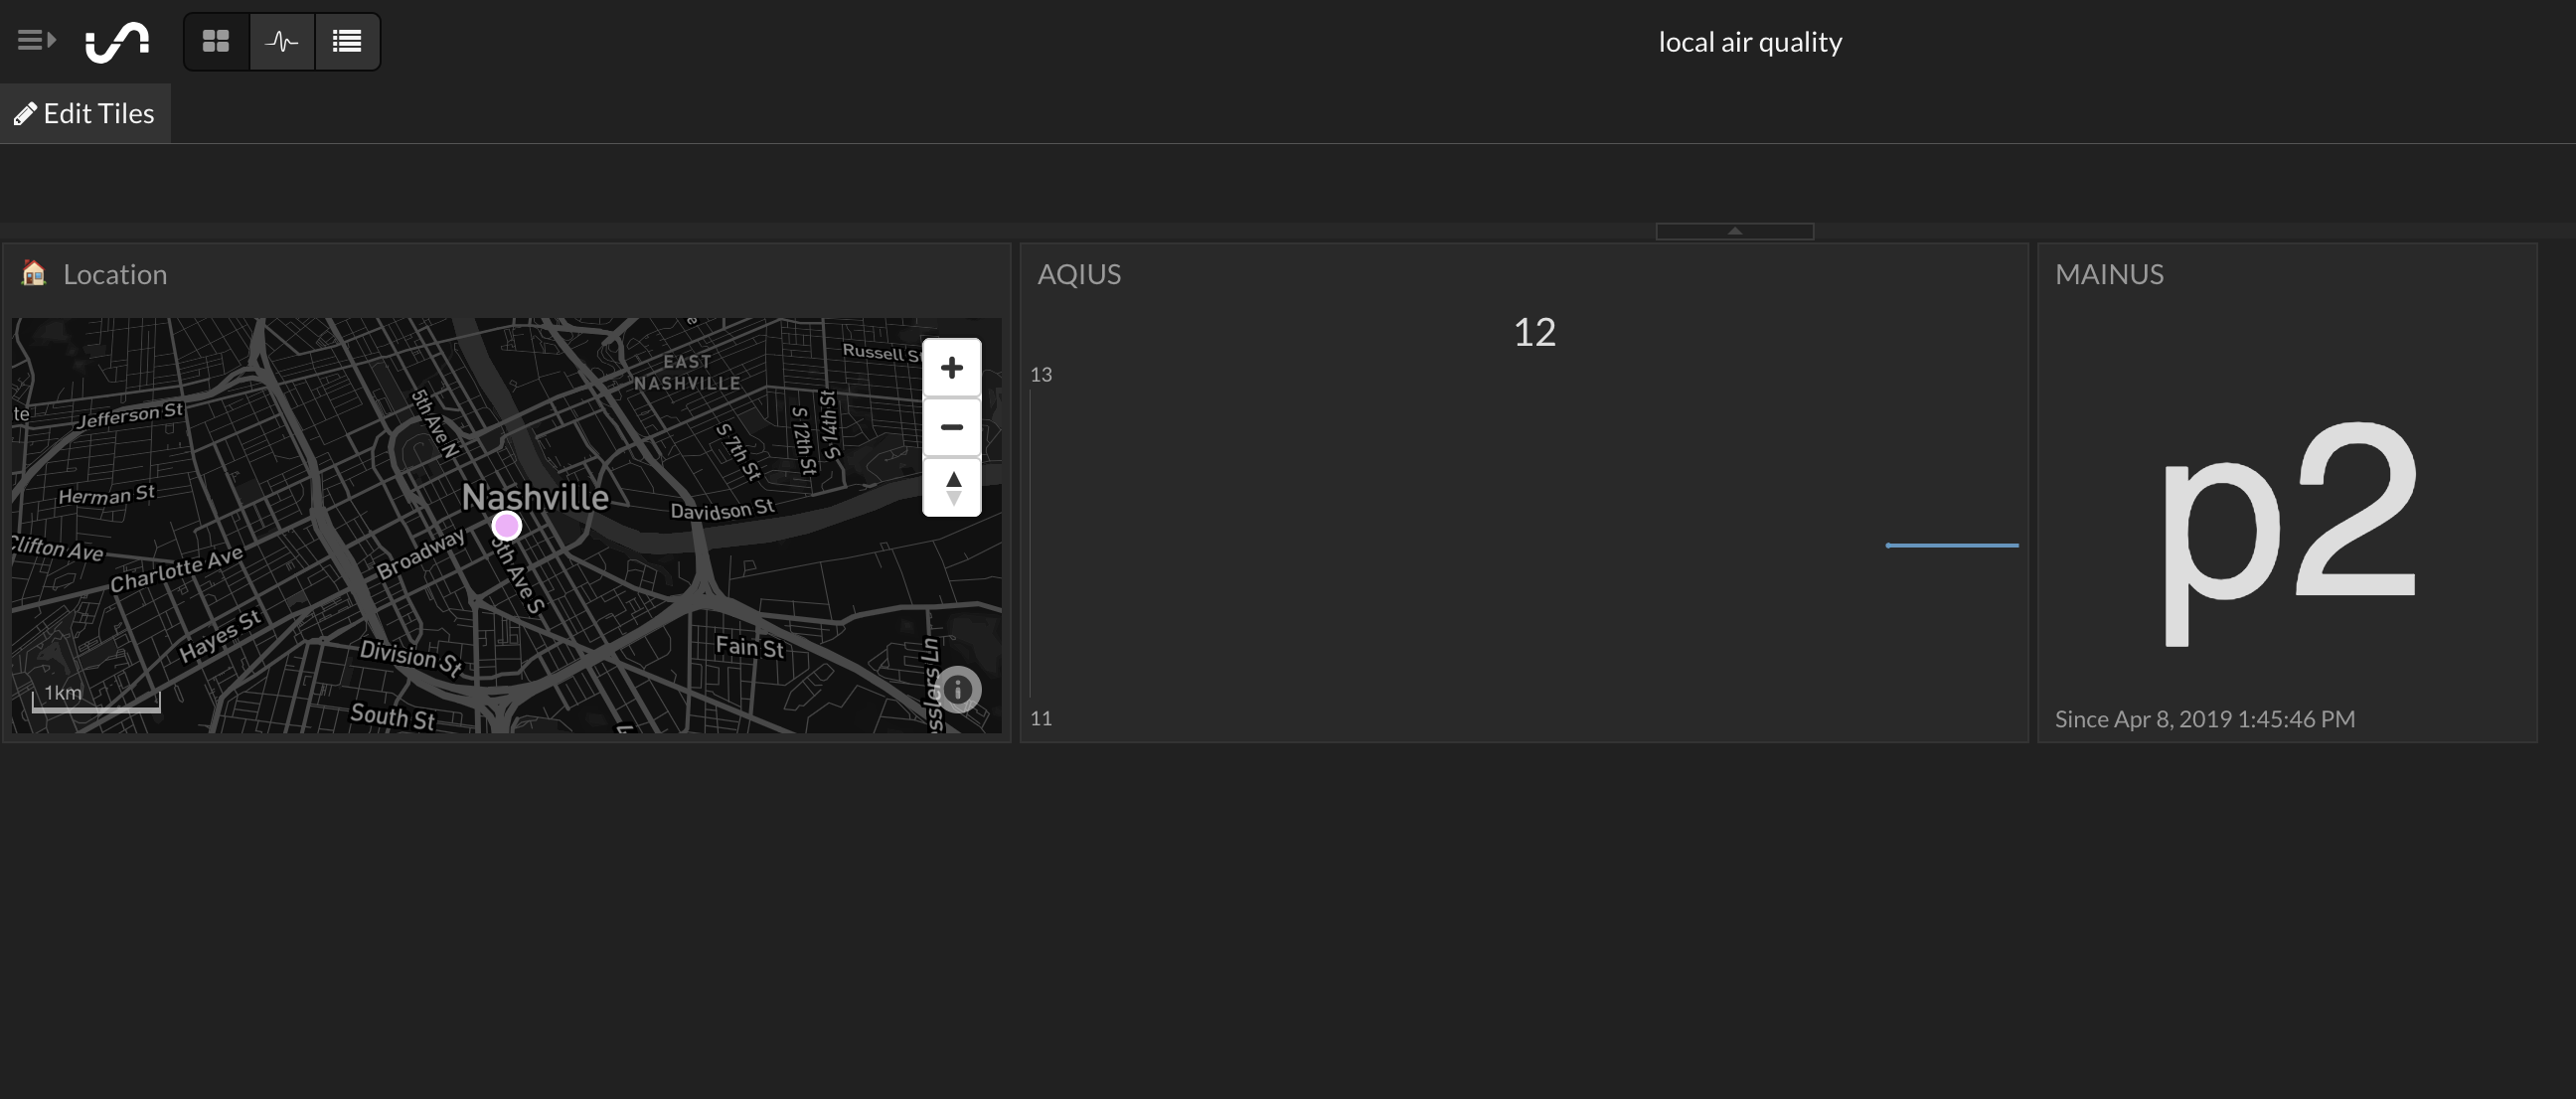
Now for the fun part. We are ready to start using the AirVisual API to create an air quality dashboard and capture the air pollution data for wherever we choose. This airquality.py script simply calls the AirVisual API using your API key and retrieves the current air pollution information. It also streams that data to your Initial State account, which will allow you to create an air quality dashboard.
You can the access the script through the Github repository that we cloned earlier. First thing we need to do is make sure we are in the AirVisual directory:
$ cd airvisual
From here, you'll be able to access the python file that we'll run to create our air quality dashboard. We need to make some changes to the file before we run it. To open the python file, use the nano command to open the text editor:
$ nano airquality.py
Once the text editor is open, you will see the following near the top of your script:
# --------- User Settings ---------
LATITUDE = "LAT"
LONGITUDE = "LONG"
AIRVISUAL_API_KEY = "AIR VISUAL API KEY"
BUCKET_NAME = "Local Air Quality"
BUCKET_KEY = "aq1"
ACCESS_KEY = "INITIAL STATE ACCES KEY"
MINUTES_BETWEEN_READS = 5
# ---------------------------------
ou need to enter your latitude, longitude, AirVisual API key, and Initial State access key. The MINUTES_BETWEEN_READS parameter will set how often your script will poll the AirVisual API for air quality information. 5 minutes enough time so that you won't go over your 10,000 API call per month limit. For the sake of short-term testing, you can set this to 0.5 minutes. Once you have your parameters entered, save and exit the text enter by typing Control+X. Now you are ready to run your script:
$ python airquality.py
If want to leave this script running uninterrupted for a long time, you can use the nohup command (no hang-up) as follows:
$ nohup python airquality.py &
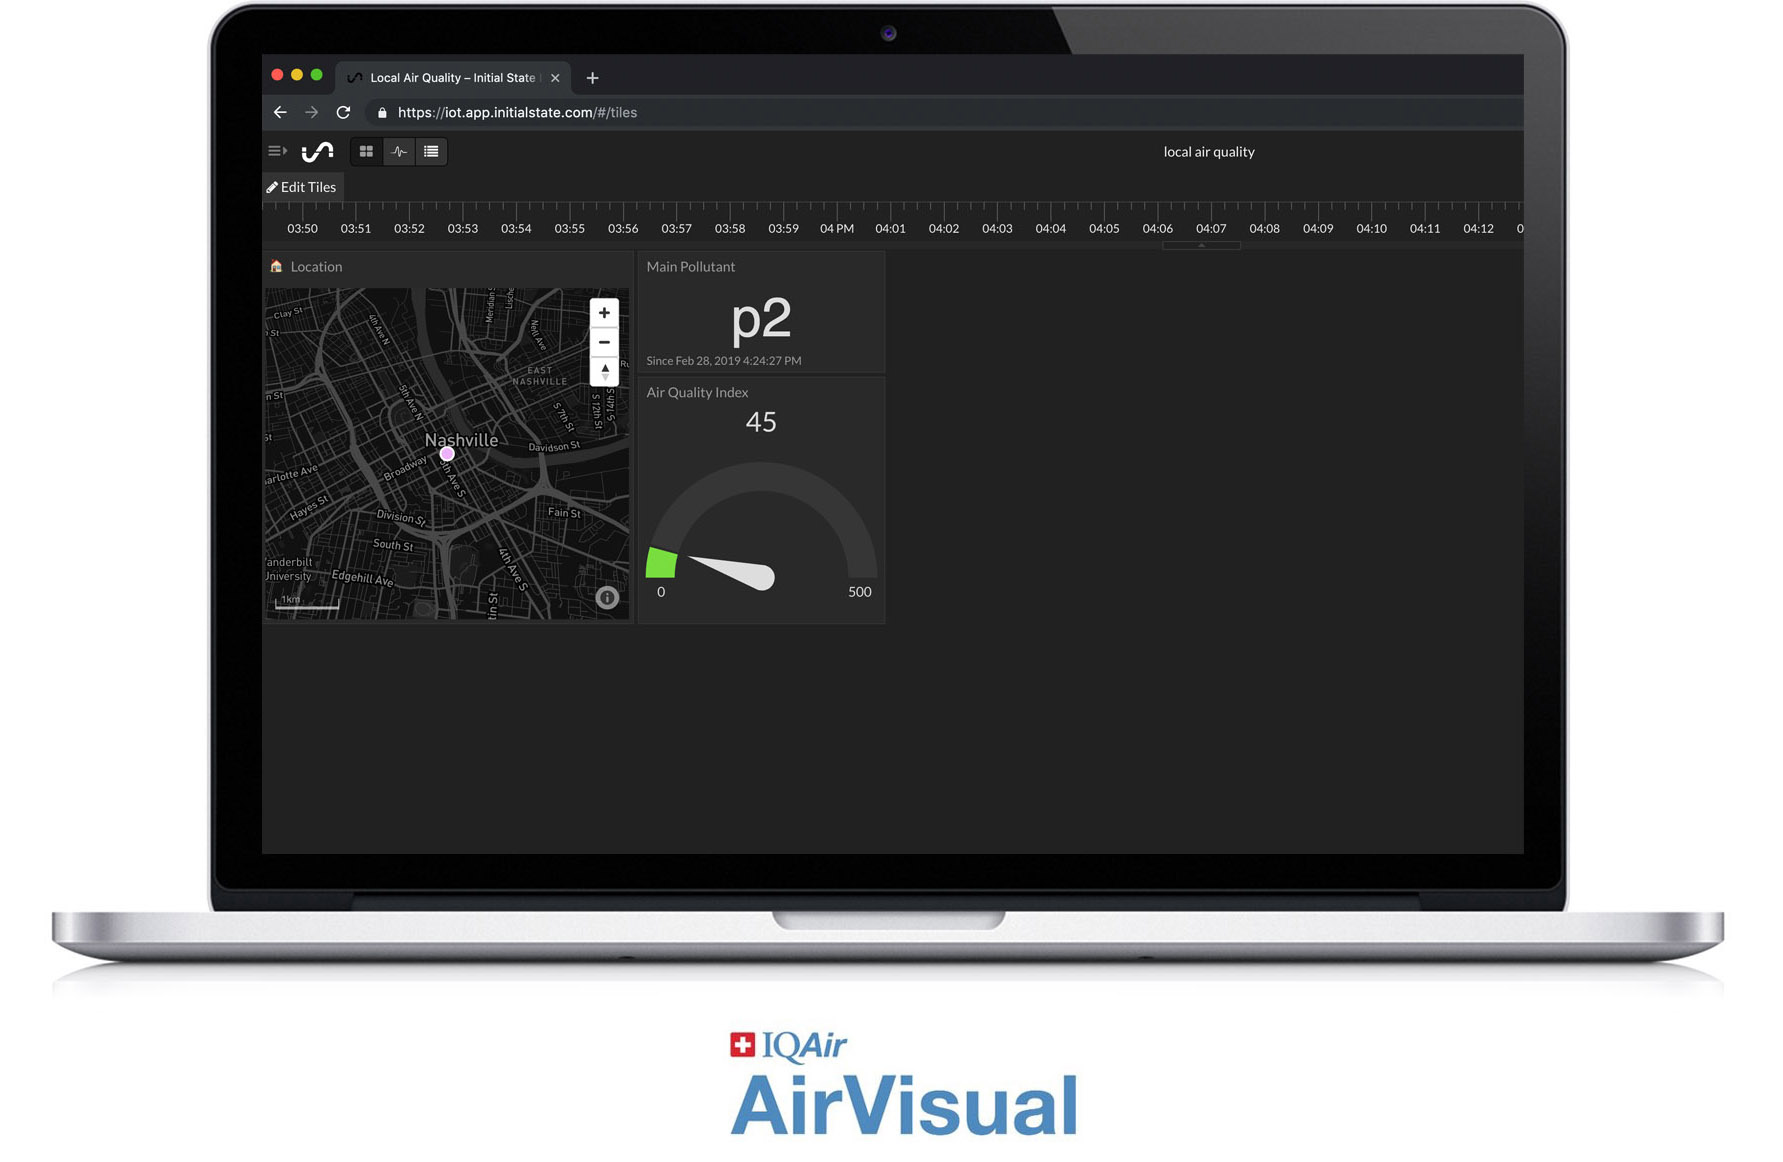
Once this is running go to Initial State to view your data. Your dashboard should look something like the picture below. You have your GPS location, your air quality index value, and your main pollutant.
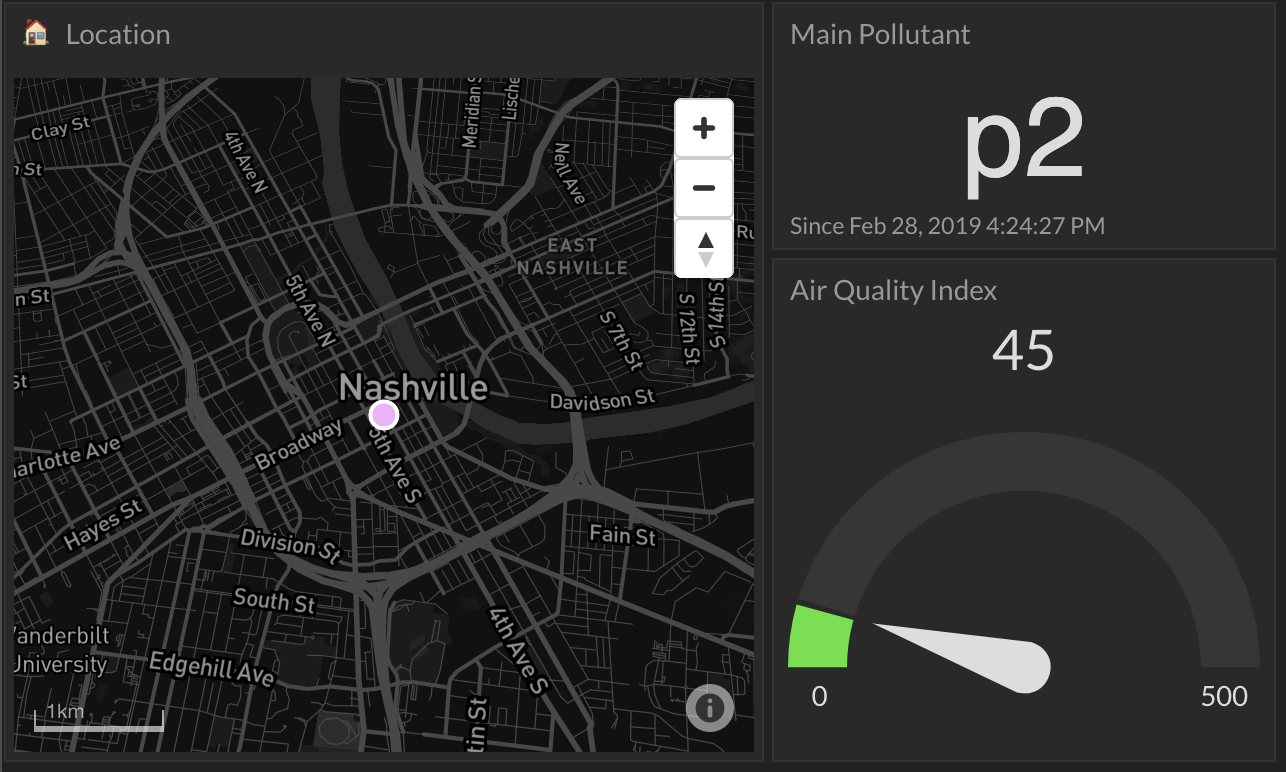
My recommendation would to change your AQI value to a gauge tile. Also, move the tiles around and resize as needed. If you are using this for an embedded dashboard, you can move these around to fit as needed.
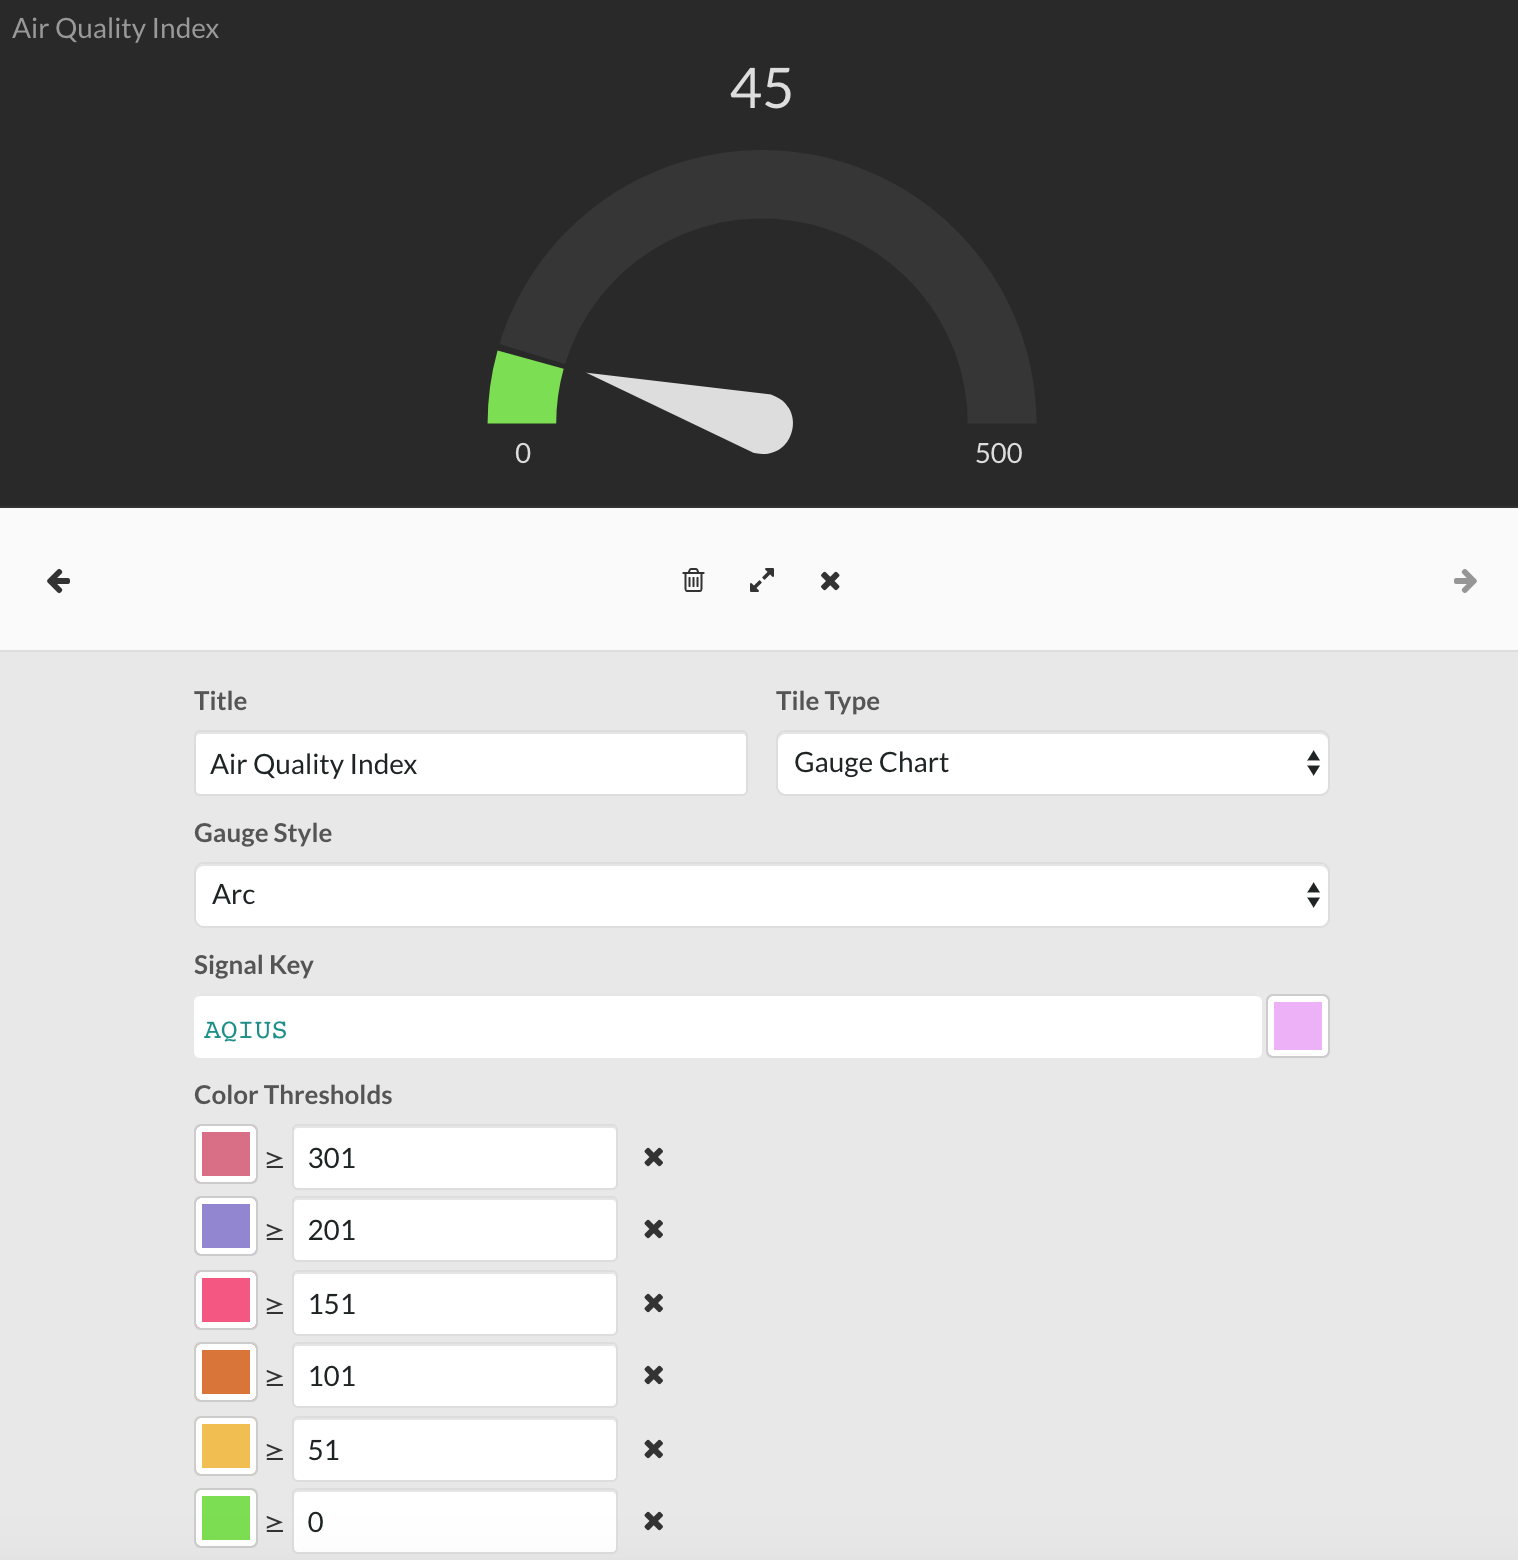
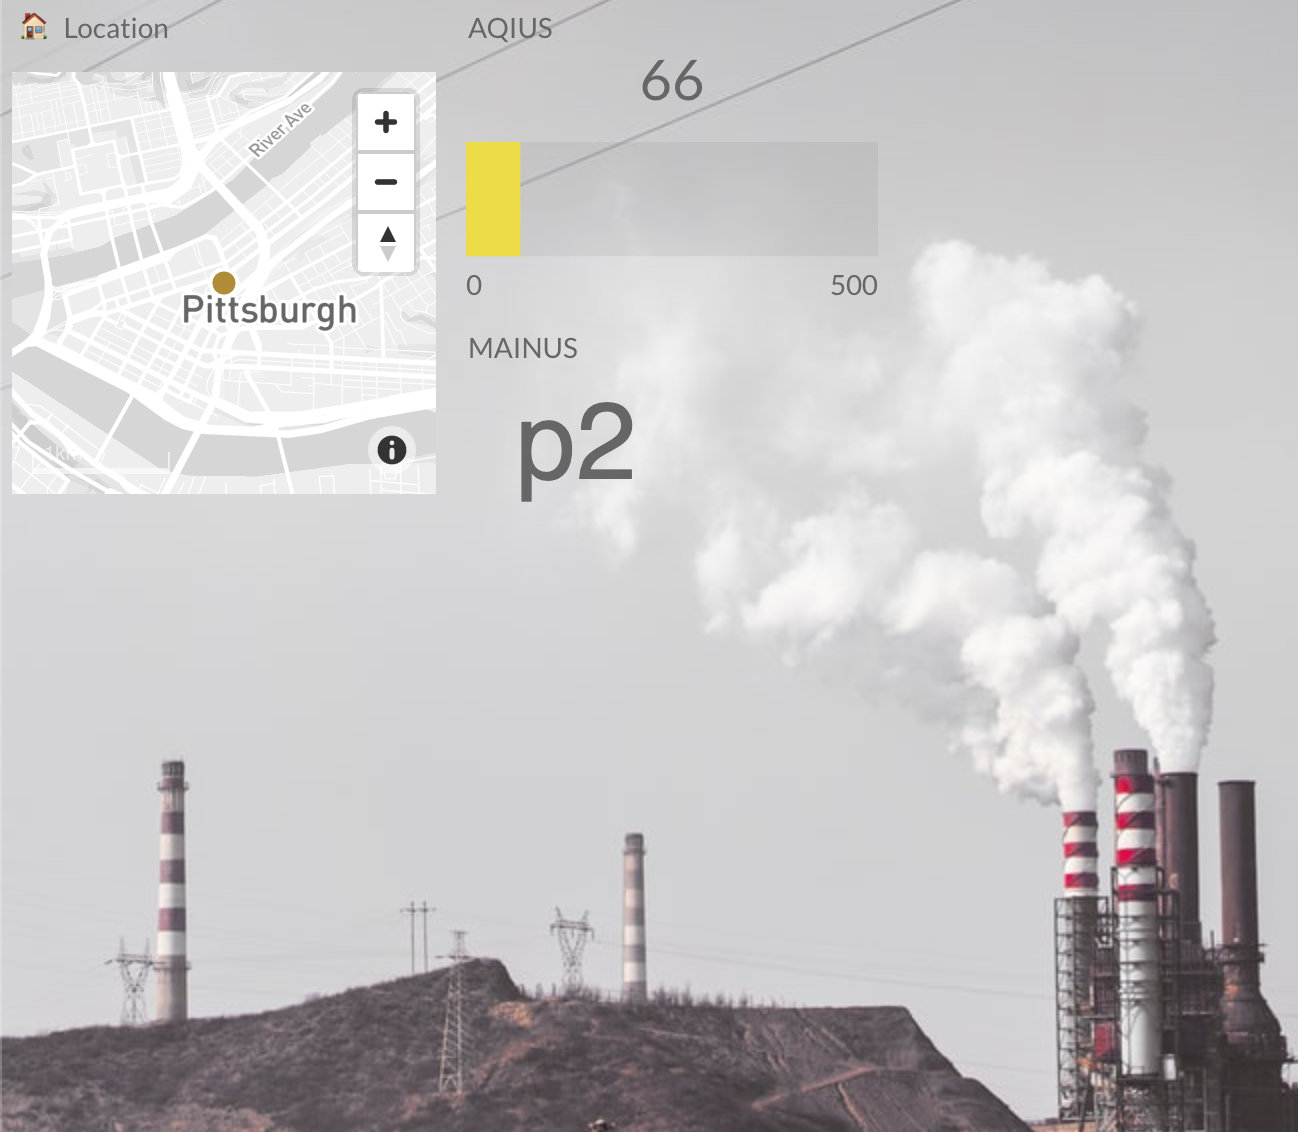
If you decide to make your AQI value a gauge, you can then set the color threshold to be similar to the air quality index chart. This gives you an instant update on where the AQI value falls on the chart when you check your dashboard. You can add a background image to your dashboard to give it more context.
So you have everything you need to create an air quality dashboard. But what if you want to add more or add this to a weather dashboard you've already created? If that is the case then keep reading!
Make a Total Weather Dashboard
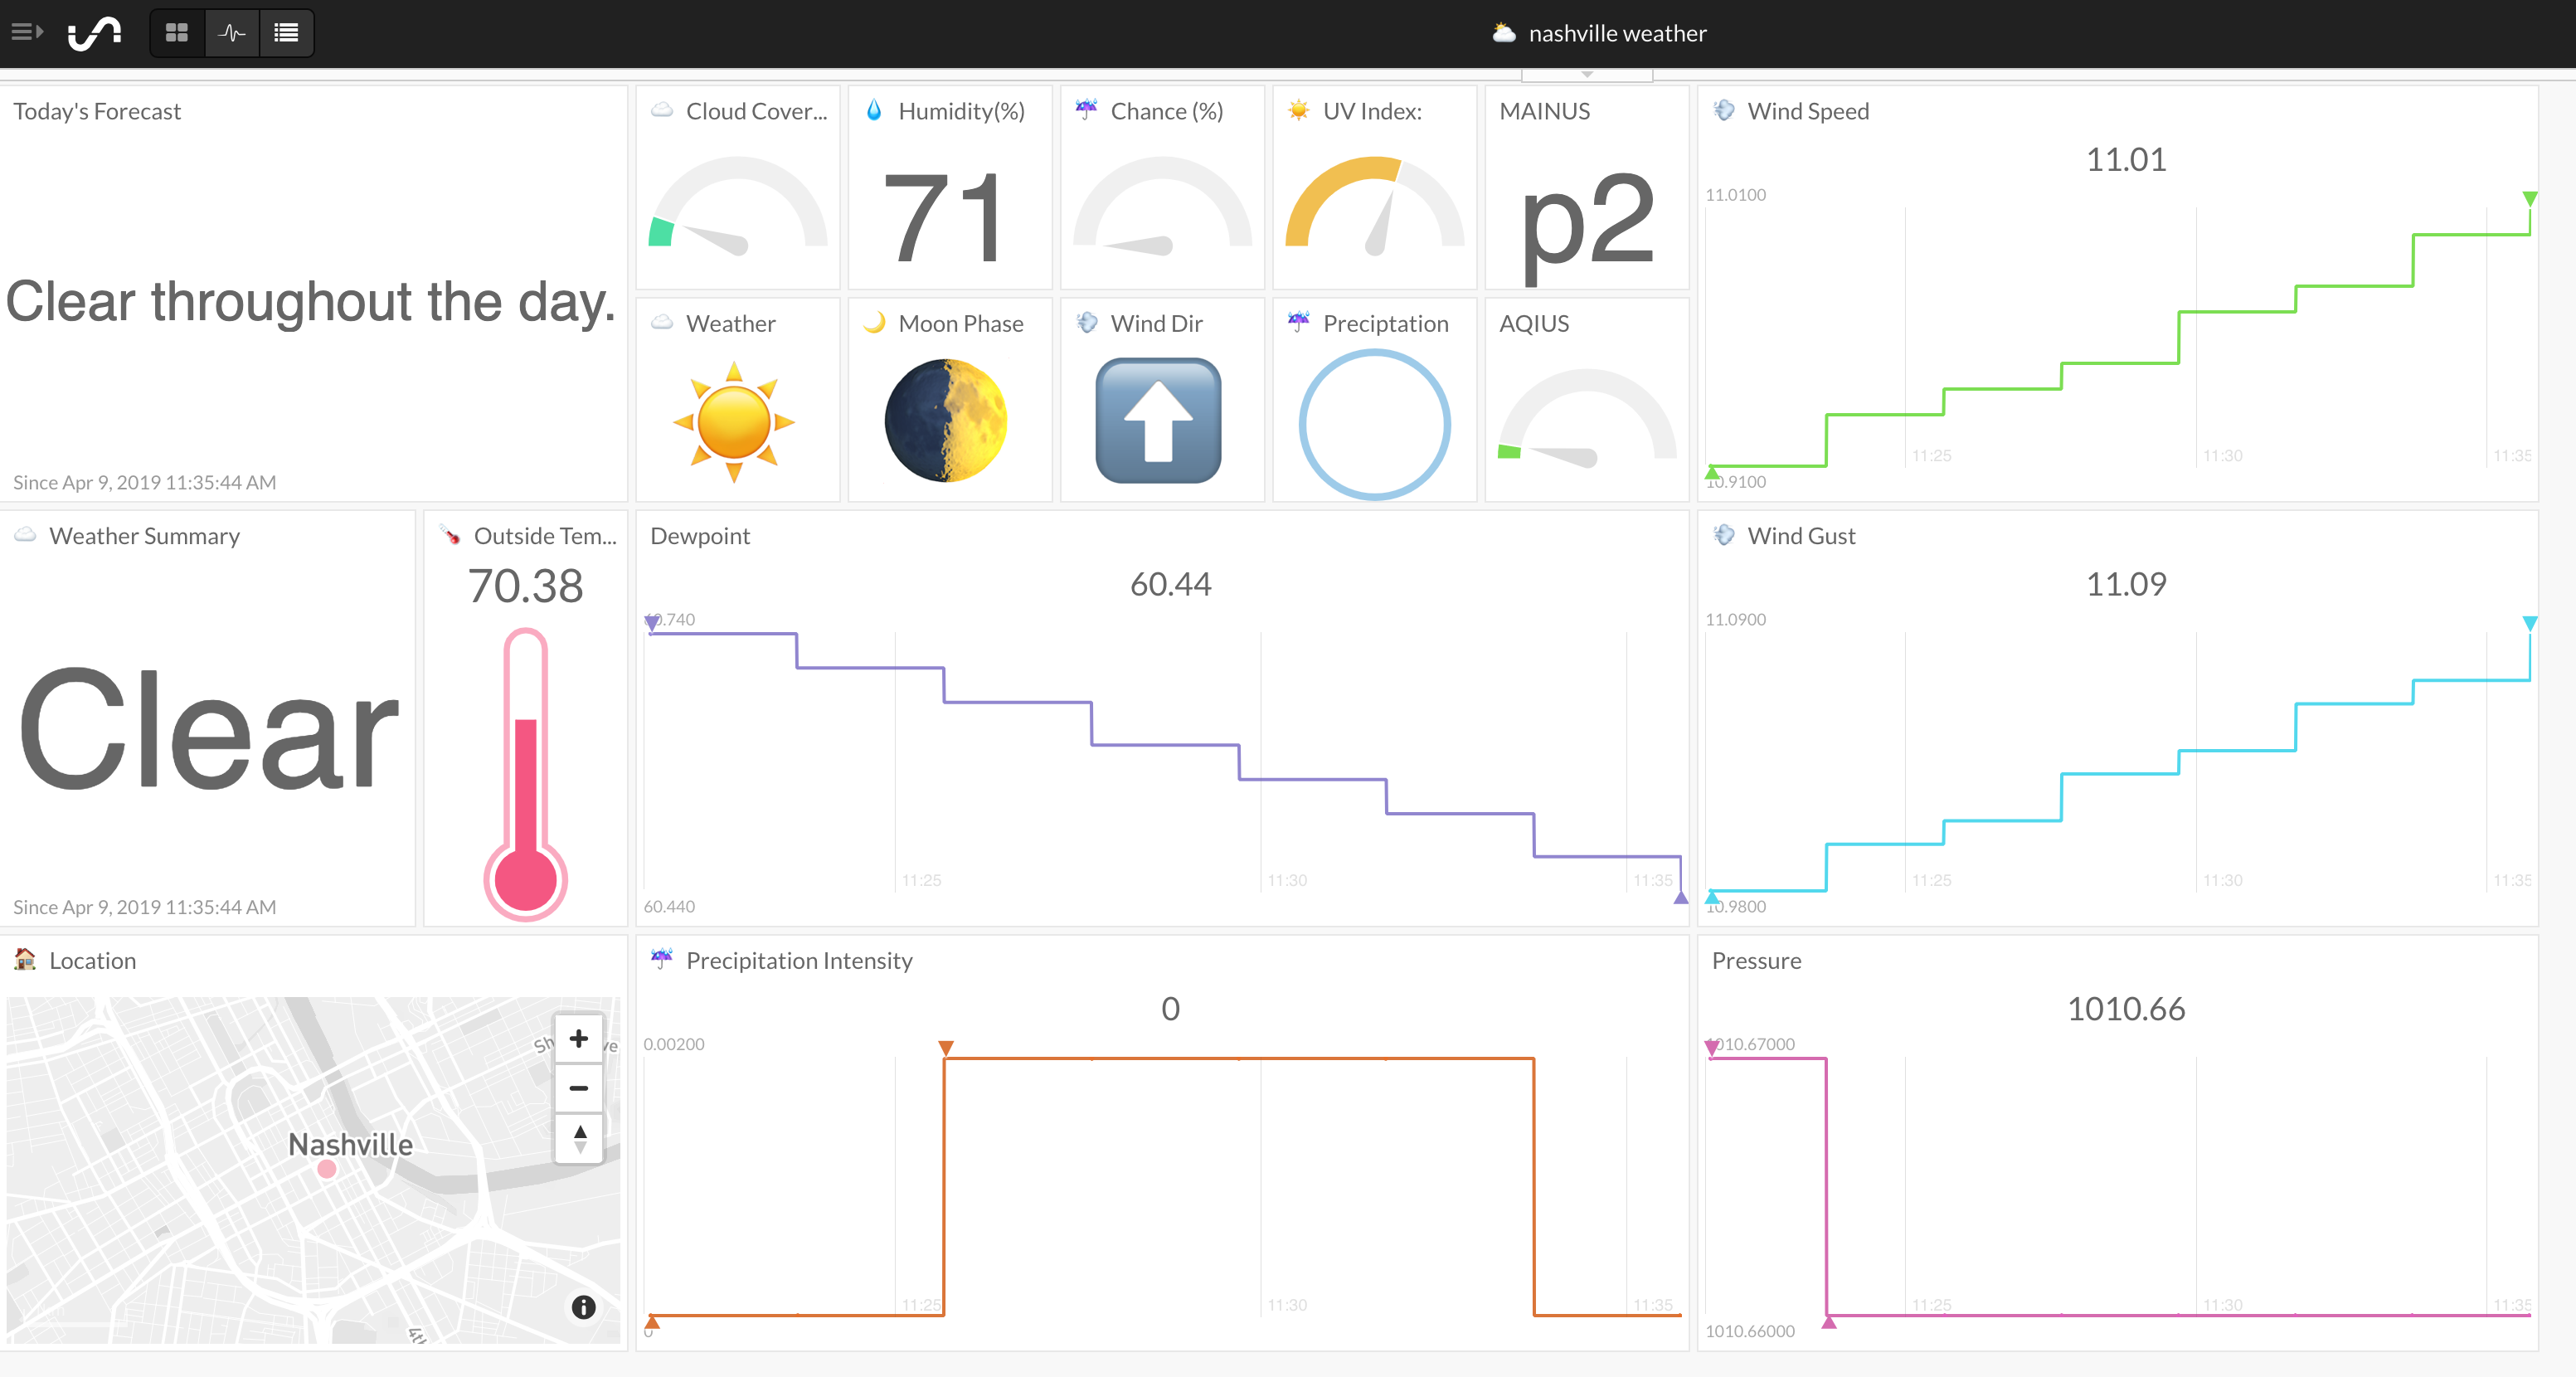
Is air quality data just not enough for you? Well there are plenty of options to add more to your dashboard or stream this data into a weather dashboard you already have!
Stream Weather & Air Quality Into a Single Dashboard
If you already implemented our DarkSky API or Hyper-Local Weather Dashboard project, you can add this air quality data to your existing dashboard. It's pretty simple, all you need to do is change your parameters in the air quality script to have the same bucket name, bucket key, and access key as what you used for your weather dashboard. This will allow the data to be sent into that same dashboard. Now you'll have a total weather dashboard!
Have Your Weather Python File Make a Call to Run the Air Quality Python File
Another option if you don't want to run two separate programs is to put the air quality python file in the weather project directory. Have the weather project python file make a call to the air quality file so that it runs when your weather file is running. Again, make sure to put the same bucket name, bucket key, and access key so that they run to the same dashboard.
Create A Single File with Both Weather & Air Quality
And if you are feeling real bold, you can put some of the air quality code into your weather python script and just have a single script to run. It will require a little more coding effort than the other two options but it makes for a simplified program.
Stream Additional Information from the AirVisual API
As you saw when we made a call to the AirVisual API, it has more information than just air quality. It also provides temperature, humidity, wind speed, wind direction, and atmospheric pressure. We can send that information to Initial State the same way we sent the air quality index value and main pollutant. It only requires you to write a few more if statements.